Yiyin Zhou1,2, Solomon Ojo1,2, Chen-Wei Wu3, Yuanhao Miao1..., Huong Tran1, Joshua M. Grant1,2, Grey Abernathy1,2, Sylvester Amoah1, Jake Bass1, Gregory Salamo4,5, Wei Du6, Guo-En Chang3, Jifeng Liu7, Joe Margetis8, John Tolle8, Yong-Hang Zhang8, Greg Sun9, Richard A. Soref9, Baohua Li10 and Shui-Qing Yu1,5,*|Show fewer author(s)
Author Affiliations
1Department of Electrical Engineering, University of Arkansas, Fayetteville, Arkansas 72701, USA2Microelectronics-Photonics Program, University of Arkansas, Fayetteville, Arkansas 72701, USA3Department of Mechanical Engineering, Taiwan Chung-Cheng University, Ming-Hsiung, Chiayi 62102, China4Department of Physics, University of Arkansas, Fayetteville, Arkansas 72701, USA5Institute for Nanoscience and Engineering, University of Arkansas, Fayetteville, Arkansas 72701, USA6Department of Electrical Engineering and Physics, Wilkes University, Wilkes-Barre, Pennsylvania 18766, USA7Thayer School of Engineering, Dartmouth College, Hanover, New Hampshire 03755, USA8School of Electrical, Energy and Computer Engineering, Arizona State University, Tempe, Arizona 85287, USA9Department of Electrical Engineering, University of Massachusetts Boston, Boston, Massachusetts 02125, USA10Arktonics, LLC, Fayetteville, Arkansas 72701, USAshow less
DOI: 10.1364/PRJ.443144
Cite this Article
Set citation alerts
Yiyin Zhou, Solomon Ojo, Chen-Wei Wu, Yuanhao Miao, Huong Tran, Joshua M. Grant, Grey Abernathy, Sylvester Amoah, Jake Bass, Gregory Salamo, Wei Du, Guo-En Chang, Jifeng Liu, Joe Margetis, John Tolle, Yong-Hang Zhang, Greg Sun, Richard A. Soref, Baohua Li, Shui-Qing Yu, "Electrically injected GeSn lasers with peak wavelength up to 2.7 μm," Photonics Res. 10, 222 (2022)
Copy Citation Text
show less
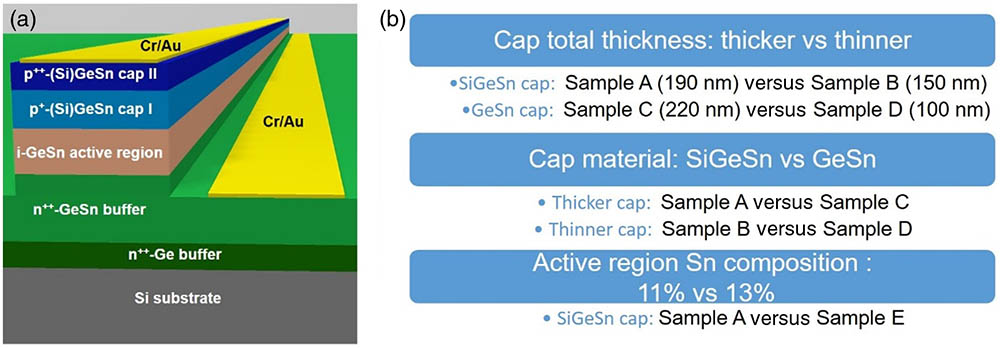
Fig. 1. (a) 3D schematic of the ridge waveguide laser designed structure; (b) three experiment groups are studied with tuning of the total cap thickness, cap layer material, and active region Sn composition.
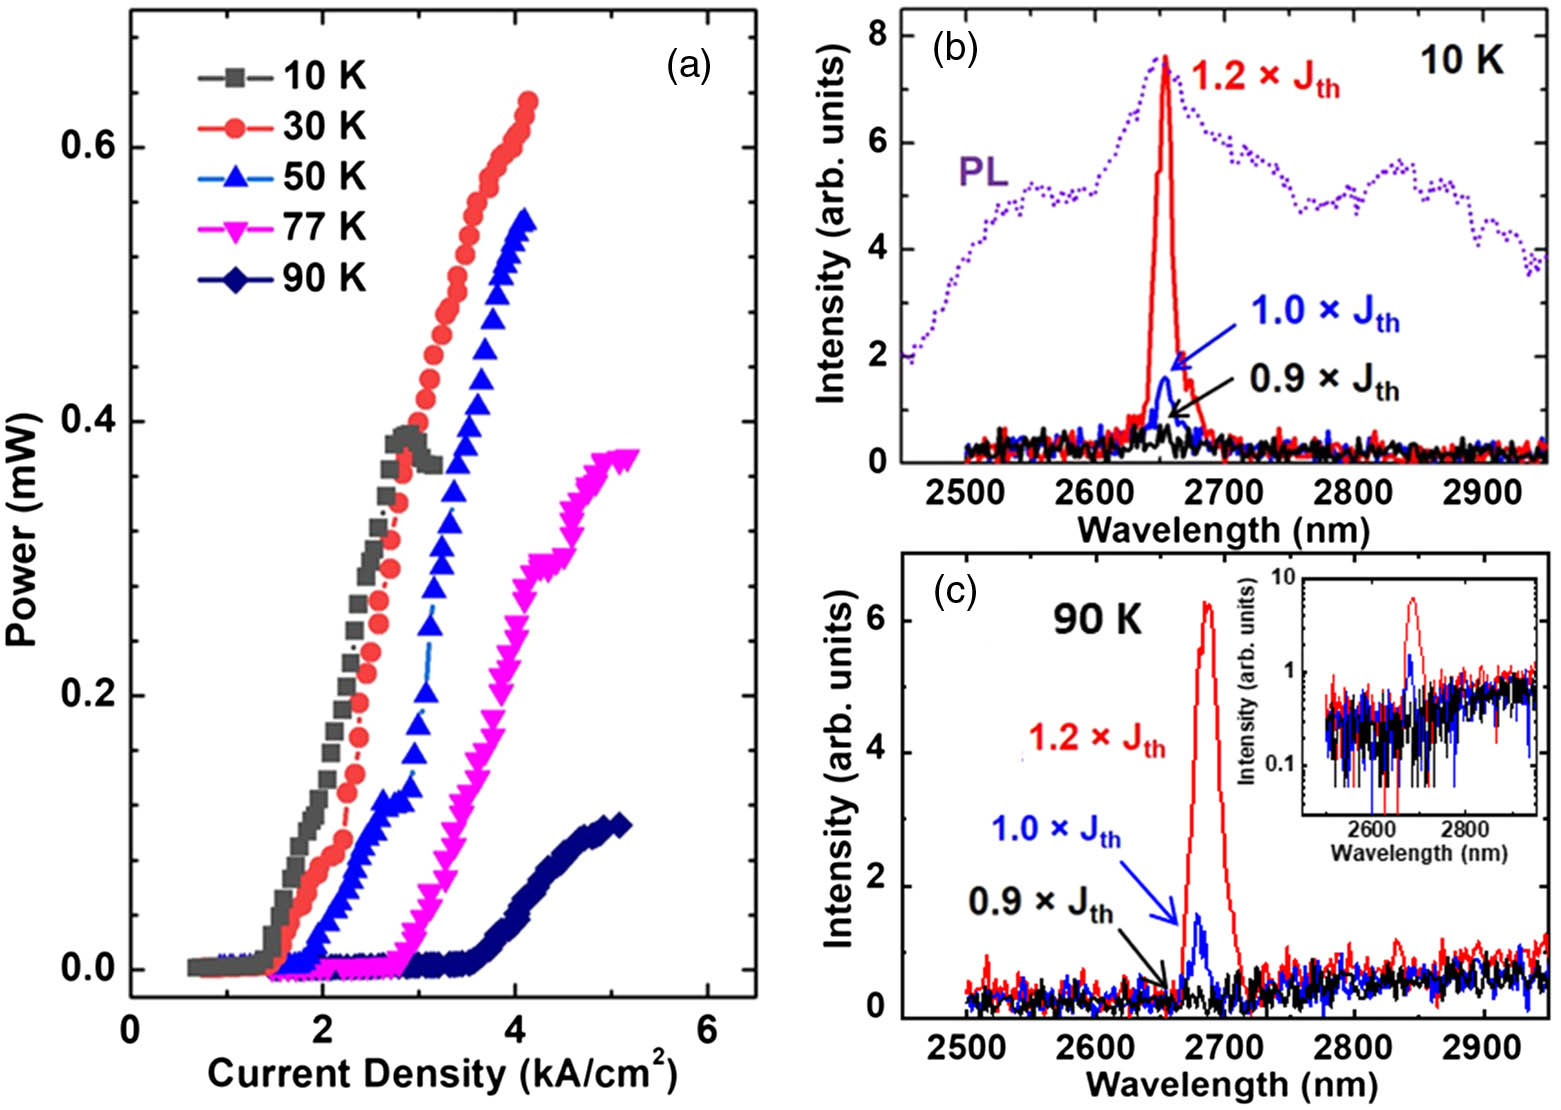
Fig. 2. Characterizations of sample E. (a) Temperature-dependent L-I curve. (b) Lasing spectra under injections below and above threshold at 10 K. The PL spectrum was also plotted for comparison. (c) Emission spectra under injections below and above threshold at 90 K; inset: semi-log plot of the spectra.
Fig. 3. L-I curves of each sample at (a) 10 K, (b) 50 K, and (c) 90 K.
Fig. 4. Normalized spectra showing the lasing peaks under 1.1×Jth injection for each sample at the corresponding operational temperatures.
Fig. 5. Calculated metal absorption loss and FCA loss in p-type cap layer for sample A as functions of SiGeSn cap layer total thickness.
| Sample | p-type Cap | GeSn Active Region | n-type Buffer |
|---|
| Material | Thickness (nm) | (meV) | Sn Composition (%) | Thickness (nm) | Material | Thickness (nm) |
|---|
| A | | 190 | 114 | 11.2 | 610 | | 950 | | B | | 150 | 114 | 10.8 | 430 | | 670 | | C | | 220 | 58 | 11.2 | 520 | | 650 | | D | | 100 | 58 | 11.5 | 450 | | 610 | | E | | 180 | 131 | 13.1 | 540 | | 540 |
|
Table 1. Summary of Laser Structure
| Sample | Cap Layer Material | Cap Layer Thickness (nm) | Sn Composition in Active Region (%) | Threshold at 10 K () | Threshold at 77 K () | (K) | (K) | Lasing Wavelength at 10 K (nm) |
|---|
| A | | 190 | 11 | 0.6 | 1.4 | 100 | 76 | 2238 | | B | | 150 | 11 | 1.4 | N.A. | 50 | 119 | 2281 | | C | | 220 | 11 | 2.4 | 3.1 | 90 | 123 | 2294 | | D | | 100 | 11 | 3.4 | N.A. | 10 | N.A. | 2272 | | E | | 180 | 13 | 1.4 | 2.9 | 90 | 81 | 2654 |
|
Table 2. Summary of Laser Characteristicsa
| Sample | Metal Absorption Loss () | P-type Cap FCA Loss () | Active Region FCA Loss () | N-type Buffer FCA Loss () | Mirror Loss () | Total Loss () | Threshold at 10 K () |
|---|
| A | 554 | 39 | 383 | 6 | 6 | 988 | 0.6 | | B | 1287 | 51 | 320 | 7 | 8 | 1673 | 1.4 | | C | 720 | 72 | 443 | 9 | 8 | 1252 | 2.4 | | D | 1724 | 36 | 341 | 11 | 8 | 2120 | 3.4 | | E | 1557 | 70 | 753 | 11 | 8 | 2399 | 1.4 |
|
Table 3. Calculated Loss and Threshold at 10 K