Tong Wu, Huifang Zhang, Sivaloganathan Kumaran, Yuehong Xu, Qingwei Wang, Wladislaw Michailow, Xueqian Zhang, Harvey E. Beere, David A. Ritchie, Jiaguang Han, "All dielectric metasurfaces for spin-dependent terahertz wavefront control," Photonics Res. 10, 1695 (2022)

Search by keywords or author
- Photonics Research
- Vol. 10, Issue 7, 1695 (2022)

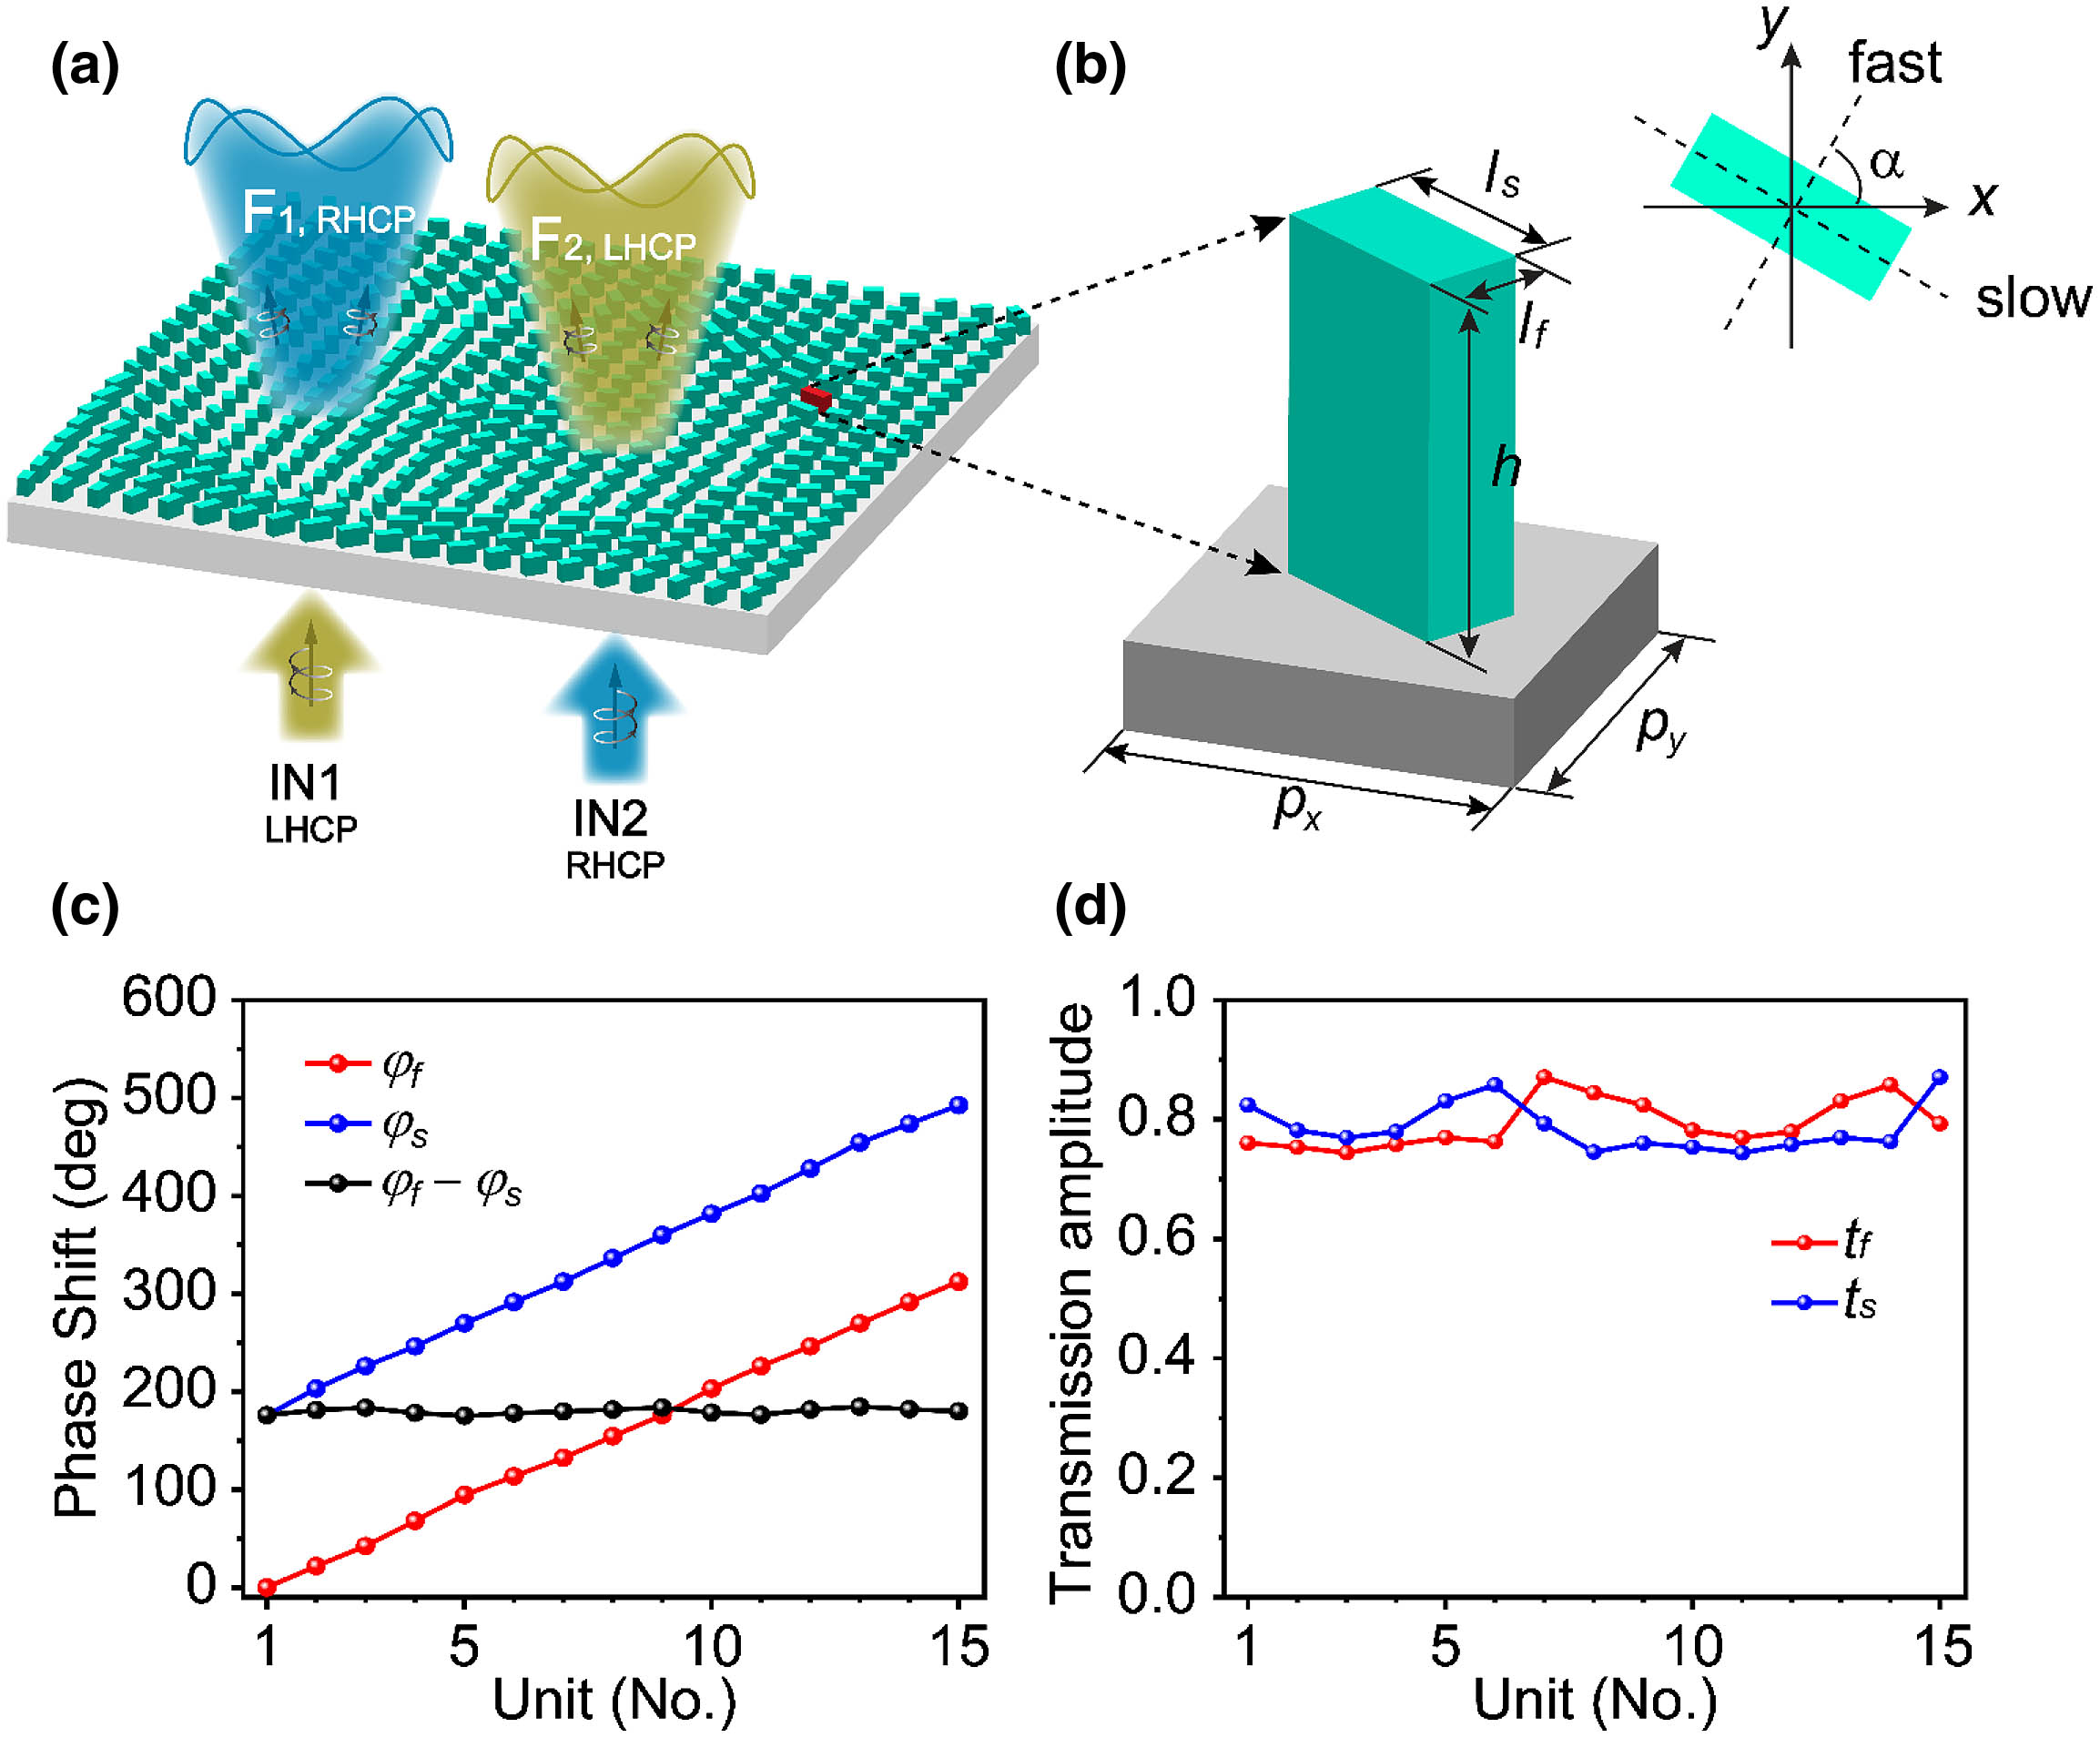
Fig. 1. (a) Schematic of the spin-dependent metasurface, which consists of PBOEs and can generate two arbitrarily designable beam functions, F 1 and F 2 , under orthogonally circularly polarized incidences. (b) Schematic of a rotated constituent PBOE marked by the red rectangular post in (a). (c) and (d) The simulated transport phase shifts and the corresponding transmission amplitudes of all the 15 PBOEs.

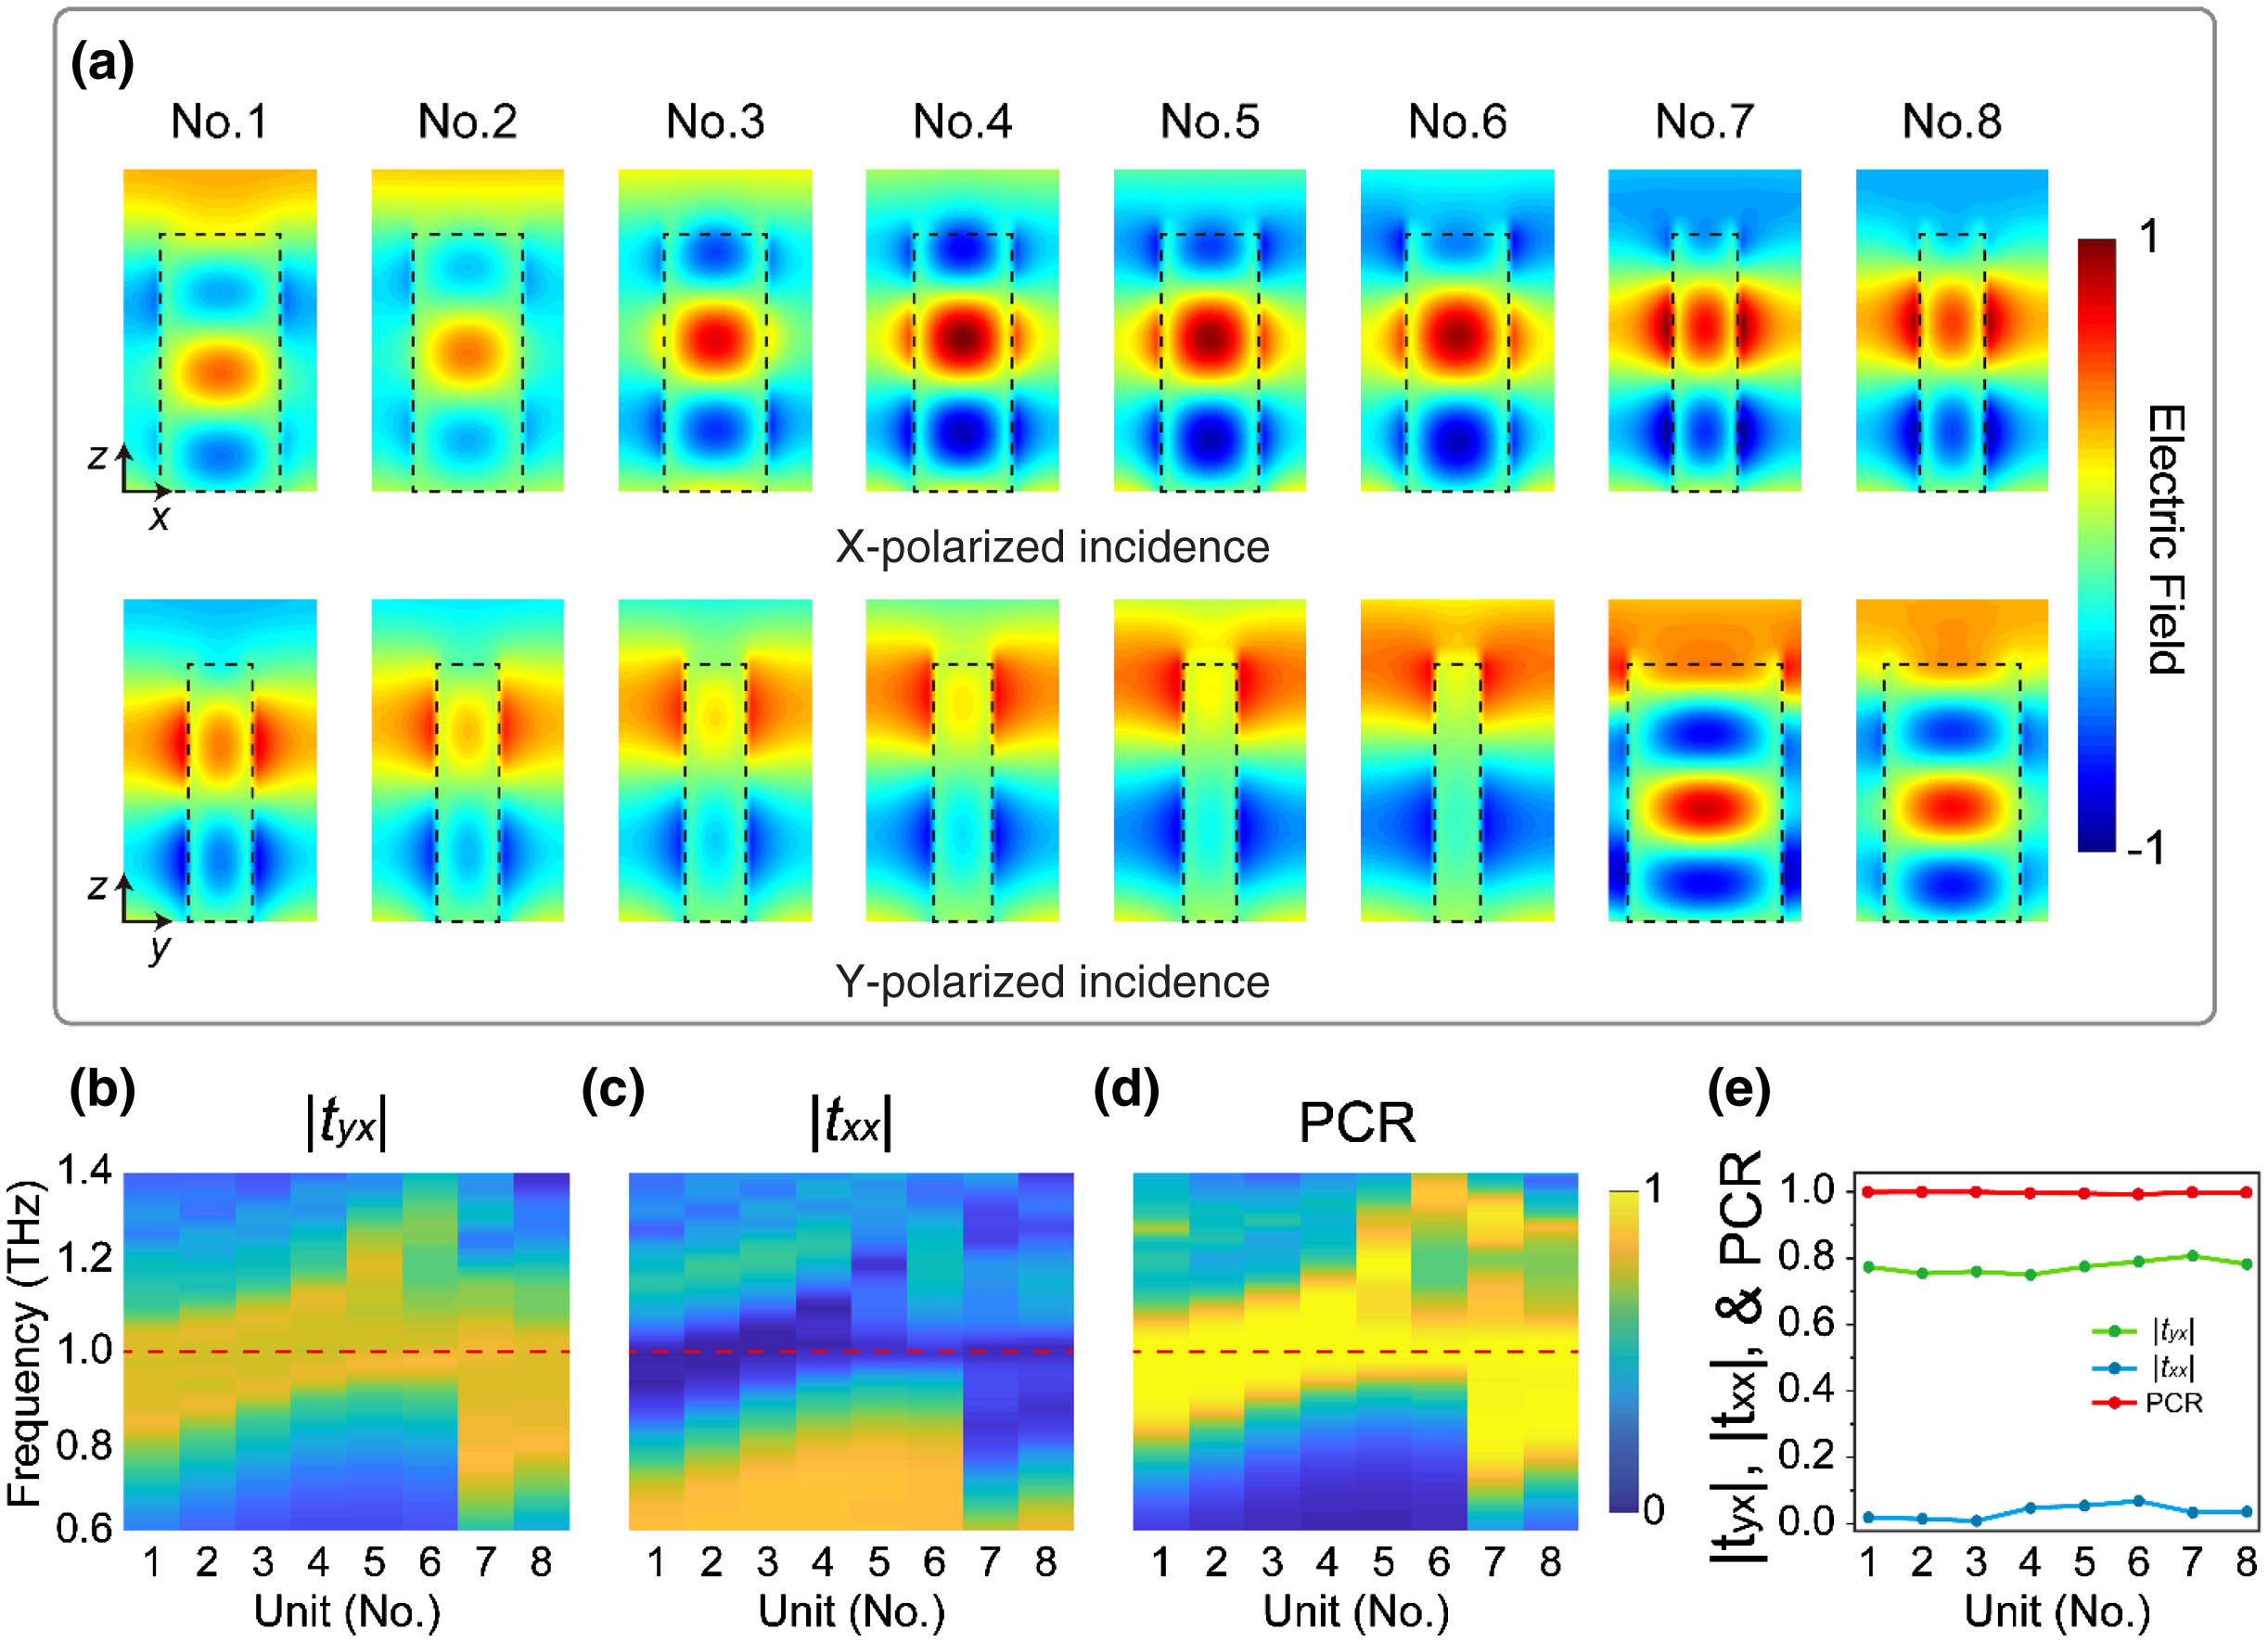
Fig. 2. (a) Simulated electric field distributions of E x (top row, in the x - z cross section) and E y (bottom row, in the y - z cross section) at 1.0 THz of the 8 fundamental PBOEs under x - and y -polarized incidences, respectively. (b) and (c) Simulated transmission amplitude spectra | t y x | and | t x x | of the 8 fundamental PBOEs (No.1 to No.8) with α = 45 ° under the x -polarized incidence. (d) Calculated PCR of the 8 fundamental PBOEs. (e) Extracted | t y x | , | t x x | , and PCR values at 1.0 THz.

Fig. 3. (a) Microscopic image of the fabricated PCD. Scale bar: 300 μm. (b) and (c) The measured normalized intensity distributions as a function of the diffraction angle and the frequency of the y - and x -polarized outputs under x -polarized input, respectively. The white dashed line in (b) indicates the theoretical angles for the + 1 st diffraction order. (d) The power efficiency of the PCD. The maximum power efficiency appears at 1.1 THz. (e) The normalized intensity profiles of x - and y -polarized output at 1.1 THz.

Fig. 4. (a) Microscopic image of a fraction of the fabricated Bessel/half-wave metasurface. Scale bar: 300 μm. (b)–(d) The measured normalized RHCP intensity distributions at the longitudinal propagation plane at x = 0 and the intensity and phase profiles at the transverse plane at z = 8 mm under the LHCP incidence. (e)–(g) The corresponding measured LHCP distributions under the RHCP incidence. In the measurement, the longitudinal plane spans from − 5 to 5 mm along the y -direction and 1 to 12.2 mm along the z -direction, whereas the transverse plane spans from − 5 to 5 mm along both the x - and y -directions. The scanning steps are 0.2, 0.2, and 0.4 mm along the x -, y -, and z -directions, respectively.

Fig. 5. (a) Microscopic image of a fraction of the fabricated Bessel/vortex metasurface. Scale bar: 300 μm. (b)–(d) The measured normalized RHCP intensity distributions at the longitudinal propagation plane at x = 0 , and the intensity and phase profiles at the transverse plane at z = 5 mm under LHCP incidence. (e)–(g) The corresponding measured LHCP distributions under the RHCP incidence, in which the transverse plane is at z = 8 mm .
|
Table 1. Geometrical Parameters and Relative φ f of the Selected 15 PBOEs

Set citation alerts for the article
Please enter your email address