
Jingjing Xia, Jun Yu, Zhanshan Wang, Siwen Lu. Scratch Evolution for Monocrystalline Silicon During Chemical-Mechanical Polishing[J]. Acta Optica Sinica, 2022, 42(9): 0912002
- Acta Optica Sinica
- Vol. 42, Issue 9, 0912002 (2022)
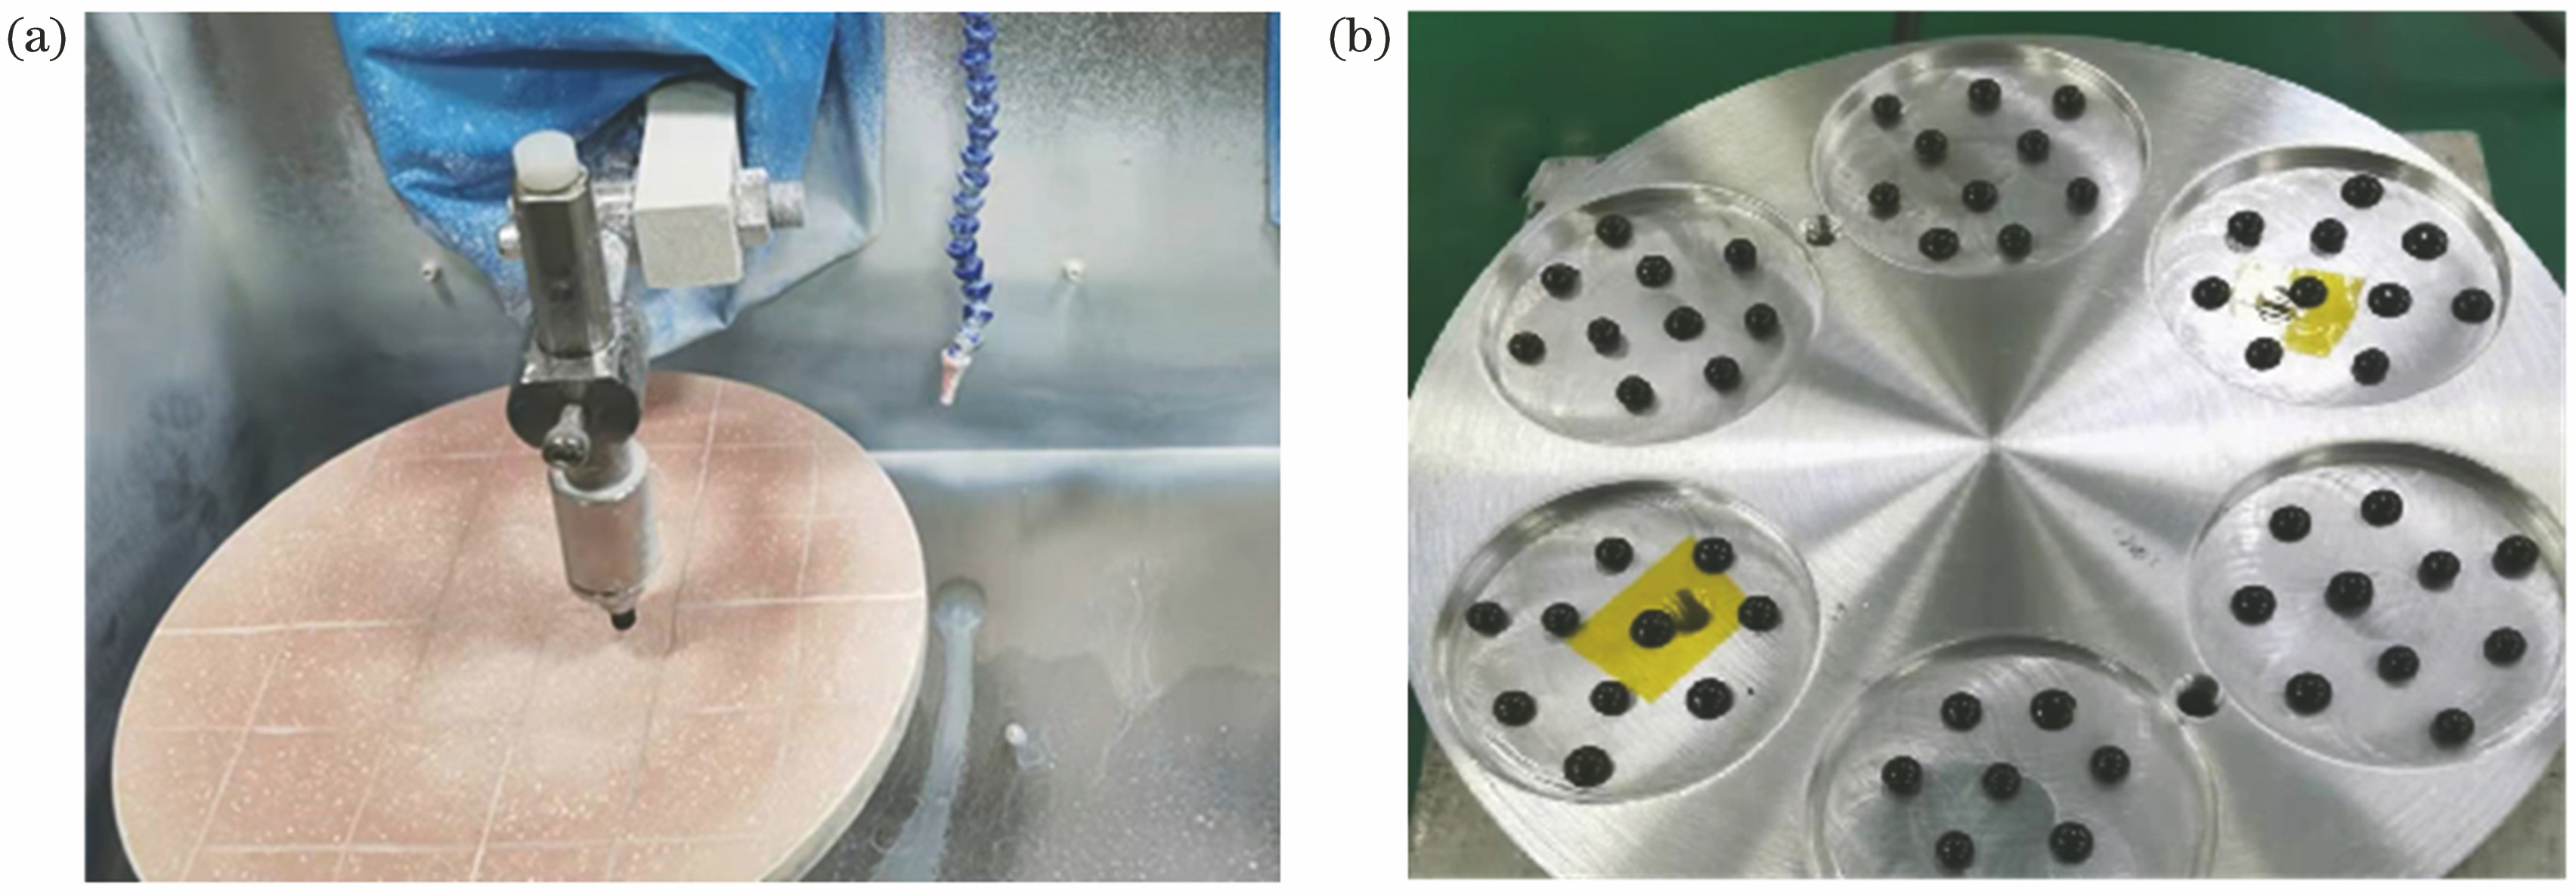
Fig. 1. Schematic diagrams of experimental devices. (a) Experimental device for chemical-mechanical polishing; (b) schematic diagram of adhesive silicon wafer and adapter obtained by asphalt
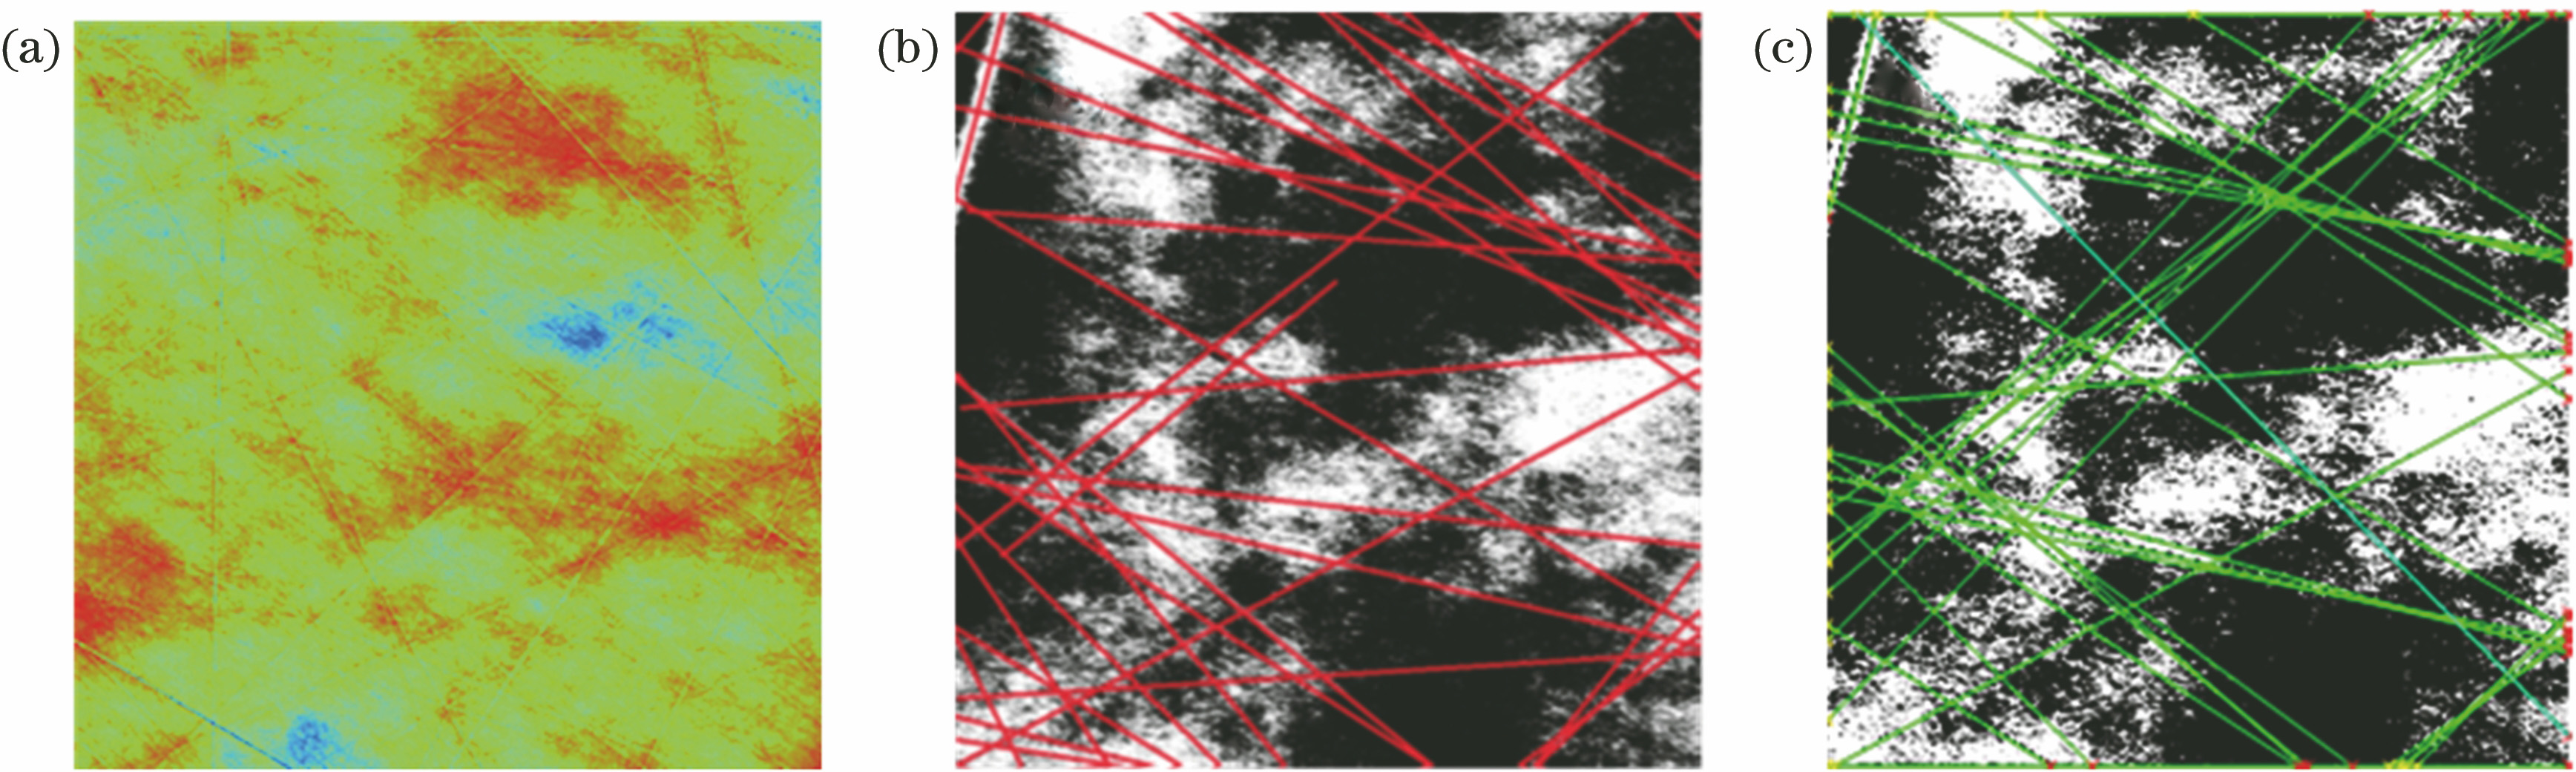
Fig. 2. Measurement result and scratch extraction of Si(111) within 1 mm×1 mm region polished by polishing slurry with doping concentration of 0.00050% under 50×profilometry. (a) Surface morphology before image filtering; (b) scratch number density result obtained by manual identification after MATLAB image filtering; (c) scratch number density result obtained by automatic recognition afer MATLAB image filtering and feature extraction
Fig. 3. Normalized results of scratch depth distributions of Si(111), Si(110) and Si(100) within 1 mm×1 mm region polished by doping polishing slurry under 50×profilometer. Scratch depth distributions for (a) Si(111), (b) Si(110) and (c) Si(100) under doping concentration of 0.00200%; scratch depth distributions for (d) Si(111), (e) Si(110) and (f) Si(100) under doping concentration of 0.00020%; scratch depth distributions for Si(111) under doping concentration of (g) 0.00002%, (h) 0.00050% and (i) 0.00100%
Fig. 4. Particle size distribution of diamond micro powder with mean particle size of 4 μm measured by static light scattering
Fig. 5. Surface morphologies of monocrystalline silicon with different crystal directions polished by polishing slurry with doping concentration of 0.00200% under 50×profilometer. (a) Si(111),height range is -34.5--12.4 nm; (b) Si(110), height range is -8.4--5.9 nm; (c) Si(100), height range is -18.3--6.5 nm
Fig. 6. Scratch number density results of Si(111) polished by polishing slurry with gradient concentrations within 1 mm×1 mm region under 50×profilometer after load normalization
Fig. 7. RMS results of roughness of Si(111) polished by polishing slurry with gradient concentrations within 1 mm×1 mm region under 50×profilometer after load normalization
Fig. 8. PSD results of Si(111) polished by polishing slurry with doping concentration of 0.00200% under 50×profilometer. (a) Two-dimensional PSD result for X-Y direction; (b) one-dimensional PSD result for X direction
Fig. 9. PSD results of Si(111) polished by polishing slurry with doping concentration of 0.00020% under 50×profilometer. (a) Two-dimensional PSD result for X-Y direction; (b) one-dimensional PSD result for X direction
Fig. 10. Scratch number density results of Si(111), Si(110) and Si(100) within 1 mm×1 mm region polished by polishing slurry with doping concentrations of 0.00020%, 0.00040% and 0.00200% under 50×profilometer
|
Table 1. Gradient concentration of rogue particles and scratch number density of Si(111)

Set citation alerts for the article
Please enter your email address
© Copyright 2018-2021 | Chinese Laser Press. All Rights Reserved 沪ICP备15018463号-20