• Photonics Research
  • Vol. 8, Issue 6, 929 (2020)
Xueli Chen1、2、†,*, Xinyu Wang1、2、†, Lin Wang3、†, Peng Lin4, Yonghua Zhan1、2, and Ji-Xin Cheng4
Author Affiliations
  • 1Engineering Research Center of Molecular & Neuro Imaging, Ministry of Education, Xi’an 710126, China
  • 2School of Life Science and Technology, Xidian University, Xi’an 710126, China
  • 3School of Information Sciences and Technology, Northwest University, Xi’an 710127, China
  • 4Department of Electrical and Computer Engineering & Biomedical Engineering, Boston University, Boston, Massachusetts 02215, USA
  • show less
    DOI: 10.1364/PRJ.384604 Cite this Article Set citation alerts
    Xueli Chen, Xinyu Wang, Lin Wang, Peng Lin, Yonghua Zhan, Ji-Xin Cheng. Stimulated Raman scattering signal generation in a scattering medium using self-reconstructing Bessel beams[J]. Photonics Research, 2020, 8(6): 929 Copy Citation Text show less
    Illustration of the optical setup implemented in the simulations. (a) Optical setup for Bessel beam generation: A, axicon; SM, scanning mirror; L, lens; M, mirror; O, objective. (b) and (c) Simulation area and setup for single bead and multibeads, respectively.
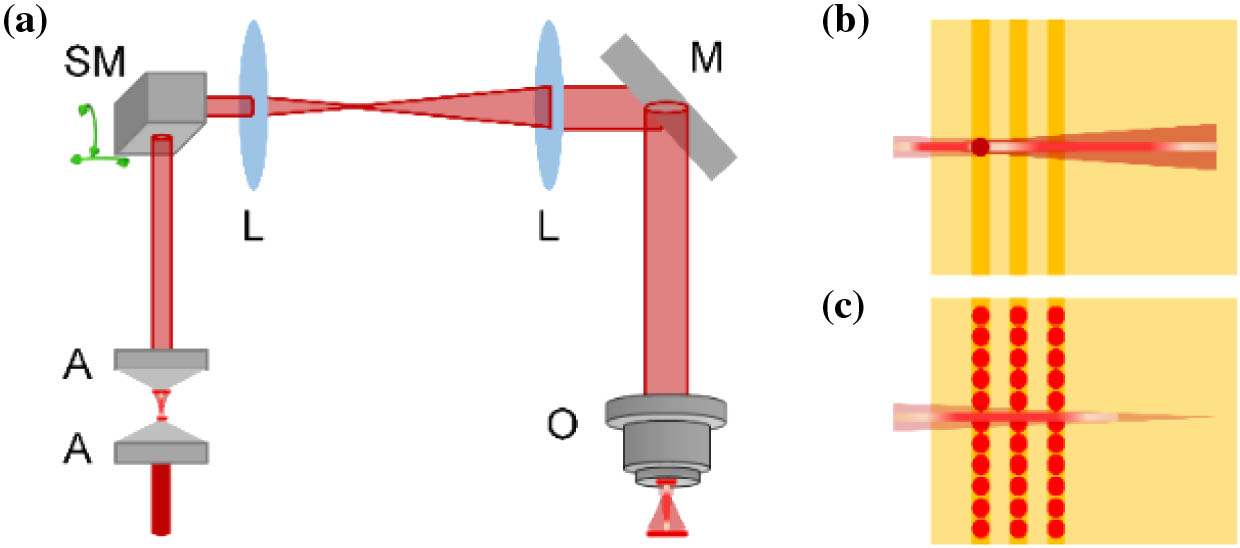
    Fig. 1. Illustration of the optical setup implemented in the simulations. (a) Optical setup for Bessel beam generation: A, axicon; SM, scanning mirror; L, lens; M, mirror; O, objective. (b) and (c) Simulation area and setup for single bead and multibeads, respectively.
    Schematic diagrams of the geometry of the added glass beads and of the simulated experimental conditions. (a) Schematic showing of geometrical parameters to determine the variation of the refractive index according to Eqs. (5) and (6). (b) Bessel beam propagation and SRS signal generation in free space. (c)–(f) Bessel beam propagation and SRS signal generation in a scattering medium by adding (c) a bead of different sizes, (d) a bead at different positions, (e) single layered beads and (f) multilayered beads of different sizes (red circles indicate the scattering beads). The pale yellow, large rectangles in panels (b)–(f) represent the target chemicals that can generate SRS signals. (g) Experimental setup relevant to the Bessel beam-based SRS simulation in the presence of scattering beads (red circles) and small chemicals (green circles). The pale yellow, large rectangle here represents the propagation medium.
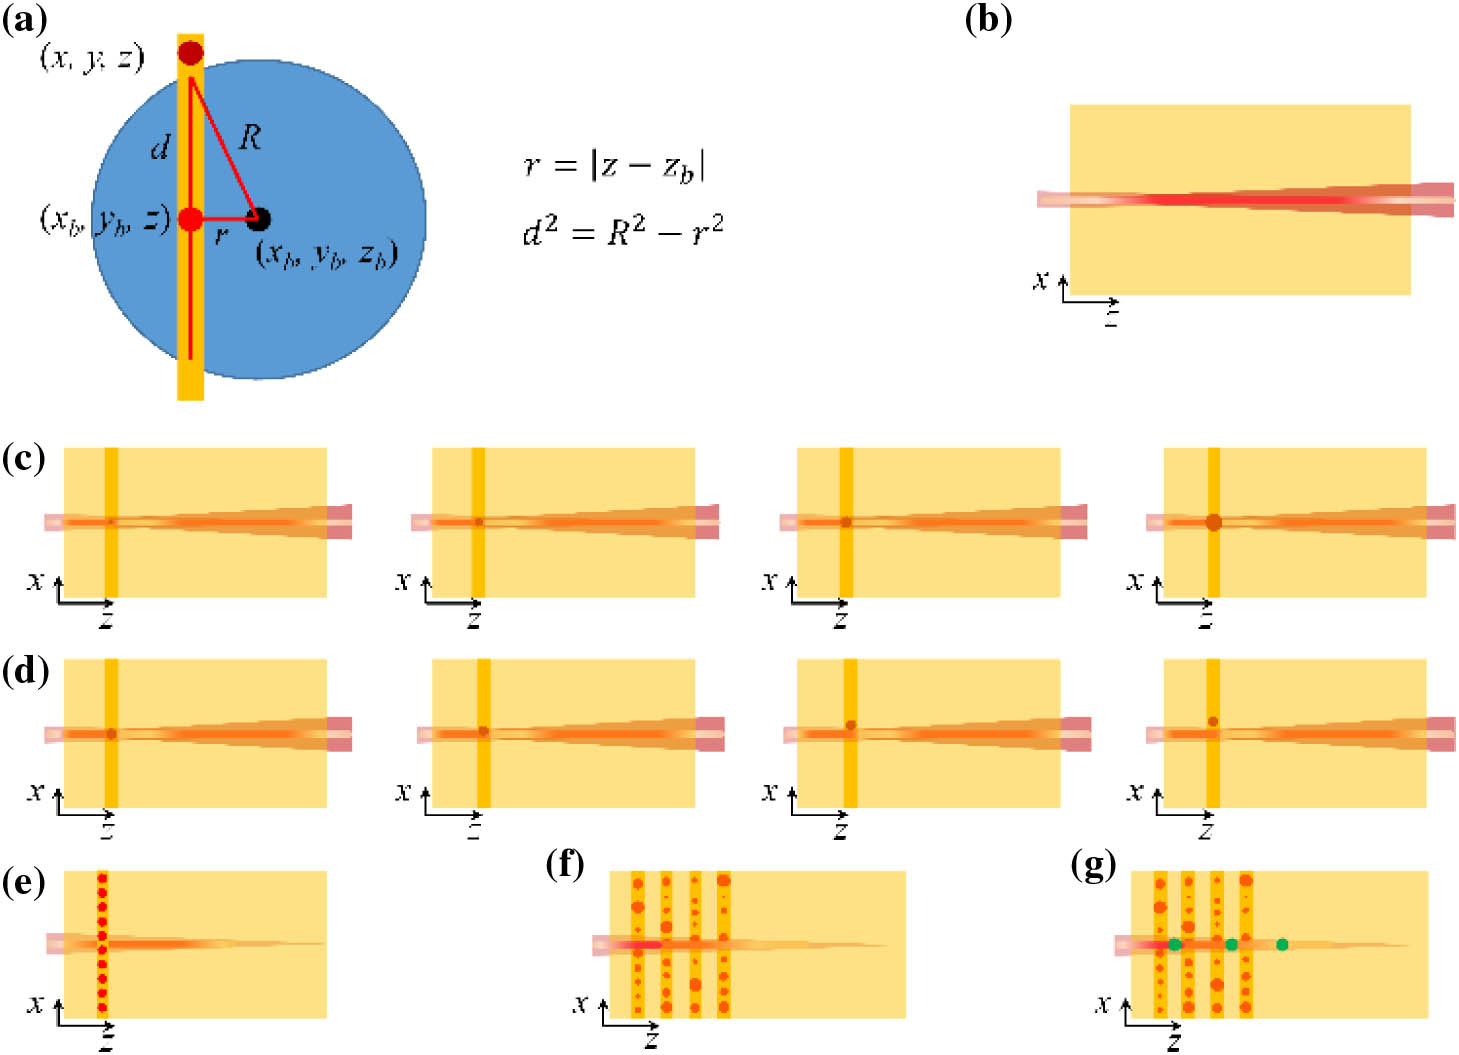
    Fig. 2. Schematic diagrams of the geometry of the added glass beads and of the simulated experimental conditions. (a) Schematic showing of geometrical parameters to determine the variation of the refractive index according to Eqs. (5) and (6). (b) Bessel beam propagation and SRS signal generation in free space. (c)–(f) Bessel beam propagation and SRS signal generation in a scattering medium by adding (c) a bead of different sizes, (d) a bead at different positions, (e) single layered beads and (f) multilayered beads of different sizes (red circles indicate the scattering beads). The pale yellow, large rectangles in panels (b)–(f) represent the target chemicals that can generate SRS signals. (g) Experimental setup relevant to the Bessel beam-based SRS simulation in the presence of scattering beads (red circles) and small chemicals (green circles). The pale yellow, large rectangle here represents the propagation medium.
    Simulation of the Bessel beam intensity distributions and of the SRS signal generation in transparent and scattering media. (a) and (b) Cross-sectional and longitudinal distributions of the pump beam intensity at a wavelength of 800 nm. (c) and (d) Cross-sectional and longitudinal distributions of the Stokes beam intensity at a wavelength of 1040 nm. (e) and (f) Cross-sectional and longitudinal distributions of the SRS signal intensity generated around 2885 cm−1. Cross-sectional images listed in (a), (c), and (e) were selected at a plane of z=1 μm. The units of the coordinates in (a)–(f) are in micrometers. (g) Investigation of the focusing state of a Gaussian beam and (h) of the self-reconstructing property of a Bessel beam when propagating in a scattering medium. The color bars are the same for all panels displayed in each row.
    Fig. 3. Simulation of the Bessel beam intensity distributions and of the SRS signal generation in transparent and scattering media. (a) and (b) Cross-sectional and longitudinal distributions of the pump beam intensity at a wavelength of 800 nm. (c) and (d) Cross-sectional and longitudinal distributions of the Stokes beam intensity at a wavelength of 1040 nm. (e) and (f) Cross-sectional and longitudinal distributions of the SRS signal intensity generated around 2885  cm1. Cross-sectional images listed in (a), (c), and (e) were selected at a plane of z=1  μm. The units of the coordinates in (a)–(f) are in micrometers. (g) Investigation of the focusing state of a Gaussian beam and (h) of the self-reconstructing property of a Bessel beam when propagating in a scattering medium. The color bars are the same for all panels displayed in each row.
    Simulation of the influence of the bead size on the SRS signal generation. (a) Longitudinal and (b) cross-sectional distributions of the SRS signal intensity without adding a bead and with adding a single bead at the center of the beam with a radius of 0.5, 1, 2, and 6 μm. The cross-sectional images were selected at different axial positions z=42, 48, 54, 60, 75, 82.5, 157.5, and 292.5 μm. The units of the coordinates are in micrometers. (c) and (d) Corresponding longitudinal profiles along the z direction of the SRS signal intensity without and with adding a bead. Inset is a magnified view of the profiles plotted in (d).
    Fig. 4. Simulation of the influence of the bead size on the SRS signal generation. (a) Longitudinal and (b) cross-sectional distributions of the SRS signal intensity without adding a bead and with adding a single bead at the center of the beam with a radius of 0.5, 1, 2, and 6 μm. The cross-sectional images were selected at different axial positions z=42, 48, 54, 60, 75, 82.5, 157.5, and 292.5 μm. The units of the coordinates are in micrometers. (c) and (d) Corresponding longitudinal profiles along the z direction of the SRS signal intensity without and with adding a bead. Inset is a magnified view of the profiles plotted in (d).
    Simulation results of the SRS signals affected by adding a single bead of 0.5 or 1 μm in radius at different positions on the cross-sectional plane. (a) and (b) Intensity maps of the longitudinal distribution of the SRS signals calculated by adding a bead with a radius of 0.5 and 1 μm, respectively, at positions of (0, 0, 25), (2, 0, 25), (4, 0, 25), and (8, 0, 25) μm. Intensity map without adding the bead is also reported in both figures. The units of the coordinates are in micrometers. (c) and (d) Longitudinal profiles (along the z direction) of the SRS signals displayed in (a) and (b), respectively. Insets show an enlarged view of the reported profiles.
    Fig. 5. Simulation results of the SRS signals affected by adding a single bead of 0.5 or 1 μm in radius at different positions on the cross-sectional plane. (a) and (b) Intensity maps of the longitudinal distribution of the SRS signals calculated by adding a bead with a radius of 0.5 and 1 μm, respectively, at positions of (0, 0, 25), (2, 0, 25), (4, 0, 25), and (8, 0, 25) μm. Intensity map without adding the bead is also reported in both figures. The units of the coordinates are in micrometers. (c) and (d) Longitudinal profiles (along the z direction) of the SRS signals displayed in (a) and (b), respectively. Insets show an enlarged view of the reported profiles.
    Simulation results of SRS signals affected by different positions of a single bead of 2 μm in radius. (a) Longitudinal and (b) cross-sectional distributions of the SRS signal intensity without adding a bead and with adding a bead at positions (0, 0, 25), (2, 0, 25), (4, 0, 25), and (8, 0, 25) μm. The cross-sectional images were selected at the planes of z=22.5, 37.5, 45, 60, 75, 82.5, 157.5, and 292.5 μm. The units of the coordinates are in micrometers. (c) and (d) Longitudinal profiles (along the z direction) of the SRS signals displayed in (a). Inset is an enlarged view of the reported profile of (c).
    Fig. 6. Simulation results of SRS signals affected by different positions of a single bead of 2 μm in radius. (a) Longitudinal and (b) cross-sectional distributions of the SRS signal intensity without adding a bead and with adding a bead at positions (0, 0, 25), (2, 0, 25), (4, 0, 25), and (8, 0, 25) μm. The cross-sectional images were selected at the planes of z=22.5, 37.5, 45, 60, 75, 82.5, 157.5, and 292.5 μm. The units of the coordinates are in micrometers. (c) and (d) Longitudinal profiles (along the z direction) of the SRS signals displayed in (a). Inset is an enlarged view of the reported profile of (c).
    Simulation results of SRS signals affected by a single bead of 6 μm in radius placed at different positions. (a) Longitudinal and (b) cross-sectional distributions of the SRS signal intensity without adding the bead and with adding a bead at positions (0, 0, 25), (2, 0, 25), (4, 0, 25), and (8, 0, 25) μm. The cross-sectional images were selected at the planes of z=22.5, 37.5, 45, 60, 75, 82.5, 157.5, and 292.5 μm. The units of the coordinates are in micrometers. (c) and (d) Longitudinal profiles (along the z direction) of the SRS signals displayed in (a). Inset is an enlarged view of the reported profile of (c).
    Fig. 7. Simulation results of SRS signals affected by a single bead of 6 μm in radius placed at different positions. (a) Longitudinal and (b) cross-sectional distributions of the SRS signal intensity without adding the bead and with adding a bead at positions (0, 0, 25), (2, 0, 25), (4, 0, 25), and (8, 0, 25) μm. The cross-sectional images were selected at the planes of z=22.5, 37.5, 45, 60, 75, 82.5, 157.5, and 292.5 μm. The units of the coordinates are in micrometers. (c) and (d) Longitudinal profiles (along the z direction) of the SRS signals displayed in (a). Inset is an enlarged view of the reported profile of (c).
    Simulation results of the influence on the SRS signal generation of bead number and distribution in a single layered bead setup. (a), (b), and (c) Longitudinal distributions of the SRS signal intensity by adding beads with a radius of 1, 2, and 6 μm, respectively, at proportions of 0% (i.e., without adding beads), 10%, 30%, and 50%. The units of the coordinates are in micrometers. (d), (f), and (g) Respective longitudinal profiles of the SRS signal intensity distributions reported in (a)–(c). (e) Enlarged view of the reported profile of (d).
    Fig. 8. Simulation results of the influence on the SRS signal generation of bead number and distribution in a single layered bead setup. (a), (b), and (c) Longitudinal distributions of the SRS signal intensity by adding beads with a radius of 1, 2, and 6 μm, respectively, at proportions of 0% (i.e., without adding beads), 10%, 30%, and 50%. The units of the coordinates are in micrometers. (d), (f), and (g) Respective longitudinal profiles of the SRS signal intensity distributions reported in (a)–(c). (e) Enlarged view of the reported profile of (d).
    Simulation results of the influence on the SRS signal generation of bead number and distribution in a single layered bead setup. The cross-sectional images selected from the planes of z=22.5, 37.5, 52.5, 67.5, 82.5, 97.5, 157.5, and 292.5 μm are presented for beads of (a) 2 μm, and (b) 6 μm in radius, and for proportions of 0% (i.e., no added beads), 10%, 30%, and 50%. The units of the coordinates are in micrometers.
    Fig. 9. Simulation results of the influence on the SRS signal generation of bead number and distribution in a single layered bead setup. The cross-sectional images selected from the planes of z=22.5, 37.5, 52.5, 67.5, 82.5, 97.5, 157.5, and 292.5 μm are presented for beads of (a) 2 μm, and (b) 6 μm in radius, and for proportions of 0% (i.e., no added beads), 10%, 30%, and 50%. The units of the coordinates are in micrometers.
    Simulation results of the impact of multilayered beads on the SRS signal generation. (a) Longitudinal and (b) cross-sectional distributions of the SRS signal intensity by adding beads with 0 layer (i.e., no added beads), one layer, two layers, three layers, and four layers. The cross-sectional images were selected at the planes of z=15, 31, 42, 55, 67.5, 82.5, 127.5, and 292.5 μm. In each layer, the beads were selected randomly with a radius from 1 μm to 6 μm, and a proportion from 10% to 50%. The units of the coordinates are in micrometers. (c) The respective longitudinal profiles of the SRS signal intensity distributions displayed in (a). (d) An enlarged view of the profiles plotted in (c).
    Fig. 10. Simulation results of the impact of multilayered beads on the SRS signal generation. (a) Longitudinal and (b) cross-sectional distributions of the SRS signal intensity by adding beads with 0 layer (i.e., no added beads), one layer, two layers, three layers, and four layers. The cross-sectional images were selected at the planes of z=15, 31, 42, 55, 67.5, 82.5, 127.5, and 292.5 μm. In each layer, the beads were selected randomly with a radius from 1 μm to 6 μm, and a proportion from 10% to 50%. The units of the coordinates are in micrometers. (c) The respective longitudinal profiles of the SRS signal intensity distributions displayed in (a). (d) An enlarged view of the profiles plotted in (c).
    Simulation results of the impact of multilayered beads on the SRS signals generated from sparsely distributed target chemicals. (a) and (b) Longitudinal and (c) and (d) cross-sectional distributions of the SRS signal intensity generated by (a) and (c) the Bessel beam-based SRS scheme and (b) and (d) the Gaussian beam-based SRS scheme. The cross-sectional images were selected at the planes of z=15, 31, 55, and 79 μm. The positions of the layers were set as z=25, 37, 49, and 61 μm, and the target chemicals were located at (0, 0, 31), (0, 0, 55), and (0, 0, 79) μm. The units of the coordinates are in micrometers. (e) and (f) Longitudinal profiles of the SRS signal intensity generated by the Bessel and Gaussian beam-based SRS schemes, respectively.
    Fig. 11. Simulation results of the impact of multilayered beads on the SRS signals generated from sparsely distributed target chemicals. (a) and (b) Longitudinal and (c) and (d) cross-sectional distributions of the SRS signal intensity generated by (a) and (c) the Bessel beam-based SRS scheme and (b) and (d) the Gaussian beam-based SRS scheme. The cross-sectional images were selected at the planes of z=15, 31, 55, and 79 μm. The positions of the layers were set as z=25, 37, 49, and 61 μm, and the target chemicals were located at (0, 0, 31), (0, 0, 55), and (0, 0, 79) μm. The units of the coordinates are in micrometers. (e) and (f) Longitudinal profiles of the SRS signal intensity generated by the Bessel and Gaussian beam-based SRS schemes, respectively.
    Preliminary experimental results for the SRS signal generation in a scattering medium by two Bessel beams. (a) Bessel beam-based SRS (bSRS) signal generation with and without scatters. (b) Gaussian beam-based SRS (gSRS) sectioning imaging with and without scatters. (c) Summation of multiheight Gaussian beam-based SRS (gSRS sum) sectioning images with and without scatters. (d) Quantitative evaluation. Red rectangles in the (a)–(c) panels indicate the regions of interest. Scale bars: 50 μm.
    Fig. 12. Preliminary experimental results for the SRS signal generation in a scattering medium by two Bessel beams. (a) Bessel beam-based SRS (bSRS) signal generation with and without scatters. (b) Gaussian beam-based SRS (gSRS) sectioning imaging with and without scatters. (c) Summation of multiheight Gaussian beam-based SRS (gSRS sum) sectioning images with and without scatters. (d) Quantitative evaluation. Red rectangles in the (a)–(c) panels indicate the regions of interest. Scale bars: 50 μm.
    Xueli Chen, Xinyu Wang, Lin Wang, Peng Lin, Yonghua Zhan, Ji-Xin Cheng. Stimulated Raman scattering signal generation in a scattering medium using self-reconstructing Bessel beams[J]. Photonics Research, 2020, 8(6): 929
    Download Citation