Abstract
Scattering is a huge challenge for microscopic imaging. Indeed, it is difficult to observe target chemicals in scattering media by means of the current Gaussian beam-based stimulated Raman scattering (SRS) microscopy, since the tight focus of the Gaussian beam is destroyed after propagating through a certain distance. Bessel beams, featuring self-reconstructing property, may bring a solution to this problem. By combining Bessel beams with SRS microscopy, we can probe the SRS signal from a scattering medium. In this paper, using the beam propagation method, we first simulate the propagation of the Bessel beam as well as the generation and self-reconstruction of SRS signals. By adding glass beads along the beam propagation path in order to simulate scattering, the propagation of the Bessel beams and the generation of the SRS signals will change. Then, we design a series of simulations to investigate the influence of the size, position, number, and distribution of the added glass beads on the generation of the SRS signals. A preliminary experiment is also carried out to confirm the simulation predictions. Results demonstrate that the SRS signals can be generated or be recovered at a certain depth in scattering media, and that such signals are greatly affected by the parameters of the scatters.1. INTRODUCTION
In recent years, coherent Raman scattering (CRS) microscopy, such as coherent anti-Stokes Raman scattering (CARS) and stimulated Raman scattering (SRS) microscopy, has brought breakthroughs in biology and medicine due to its ability to image chemical bonds without labeling [1–3]. Compared with CARS, SRS microscopy is a background-free and automatically phase-matched technique; thus, it is more suitable for imaging living systems [4,5]. As a nonlinear optical process, SRS microscopy requires two tightly focused laser beams, which are spatially and temporally overlapped at the same position of the sample [6–8]. Gaussian beams are commonly used in SRS microscopy as both pump and Stokes beams. Due to the tight focus characteristics, Gaussian beam-based SRS microscopy can provide high spatial and axial resolution. However, this feature presents two issues. First, the Gaussian beam is focused to a point, and it is rapidly dispersed beyond the focus, leading to a small focal volume. Therefore, SRS microscopy cannot be applied to image a large three-dimensional (3D) volume. As a matter of fact, different volumetric imaging methods have been reported for coherent Raman imaging of a 3D volume, such as fast scanning the focal plane or using the Bessel beams [9–11]. Second, Gaussian beam-based SRS microscopy suffers from scattering. The scatters would in fact destroy the focusing status of the Gaussian beams. Even at a small depth of the scattering medium, the Gaussian beams can no longer keep the focus. In this case, the SRS signal would be destroyed or not be generated [12].
Maintaining the focus depth in a scattering tissue is always a difficult task in the field of microscopic imaging. A number of techniques have been reported to overcome such depth limit, including adaptive optics, wave manipulation, nonlinear excitation, longer wavelengths, and incorporating other imaging modalities [13–18]. Both adaptive optics and wave manipulation extend the depth limit by detecting, controlling, and correcting dynamic wavefront errors in real time, e.g., by using time-reversed ultrasonically encoded light, or photoacoustically guided wavefront shaping technique [13–16]. Unfortunately, these techniques usually require complicated instrumentation [12], which is not suitable for implementing two-pulse SRS. Moreover, such methods only work in a limited bandwidth, whereas SRS uses ultrafast lasers, which usually feature a broader bandwidth (a few hundred wavenumbers). Longer wavelength light excitation can provide deeper imaging depth, since it is less affected by tissue scattering, at the expense of spatial resolution [17]. Photoacoustic imaging can push the depth of optical microscopic imaging to a millimeter scale by detecting the ultrasonic signals produced by light irradiated tissues [18]. However, its spatial resolution only reaches a scale of several to tens of micrometers, and it is also affected by a limited chemical contrast. Bessel beams, possessing nondiffracting properties, may overcome such problems presented by the Gaussian beams. By taking advantage of their favorable properties, such as maintaining a long focusing status as well as providing an extending depth of focus, Bessel beams have been successfully applied to two-photon microscopy [19], light-sheet microscopy [20,21], photoacoustic microscopy [22], and optical coherence tomography [23]. In our previous study [24], we have applied Bessel beams to SRS microscopy and implemented 3D SRS imaging of a volume. Recently, Bessel beams have also been used in fluorescence microscopy to solve the problem that Gaussian beam-based microscopy cannot be imaged or provides poor resolution in the scattering case [25–27]. The reported results clearly demonstrate that the Bessel beam can image deeper than the Gaussian beam.
Thus, in principle, by combining Bessel beams with SRS microscopy, the SRS signal can be probed from a scattering medium. In order to investigate the feasibility of this concept, we first performed a series of simulations based on the fractal propagation method (FPM). The FPM is an implementation of the beam propagation method (BPM), which was developed to accurately and efficiently simulate the propagation of focused beams in scattering tissues [28]. We first simulated the propagation of Bessel beams and then investigated the generation and self-reconstruction of the SRS signals. A schematic representation of the optical setup for Bessel beam generation is displayed in Fig. 1(a). By adding glass beads along the beam propagation path in order to simulate scatters [Figs. 1(b) and 1(c)], the propagation of the Bessel beams and the generation of the SRS signals were changed. In particular, simulations were performed by adding glass beads of different size, position, number, and distribution, which had influence on the generation and self-reconstruction of SRS signals. On the whole, our simulated results demonstrated that the SRS signals can be generated or recovered at a certain depth in the scattering medium, and that they are greatly affected by parameters of the added glass beads. In the end, a preliminary experiment was conducted to confirm the simulation predictions.
Sign up for Photonics Research TOC. Get the latest issue of Photonics Research delivered right to you!Sign up now
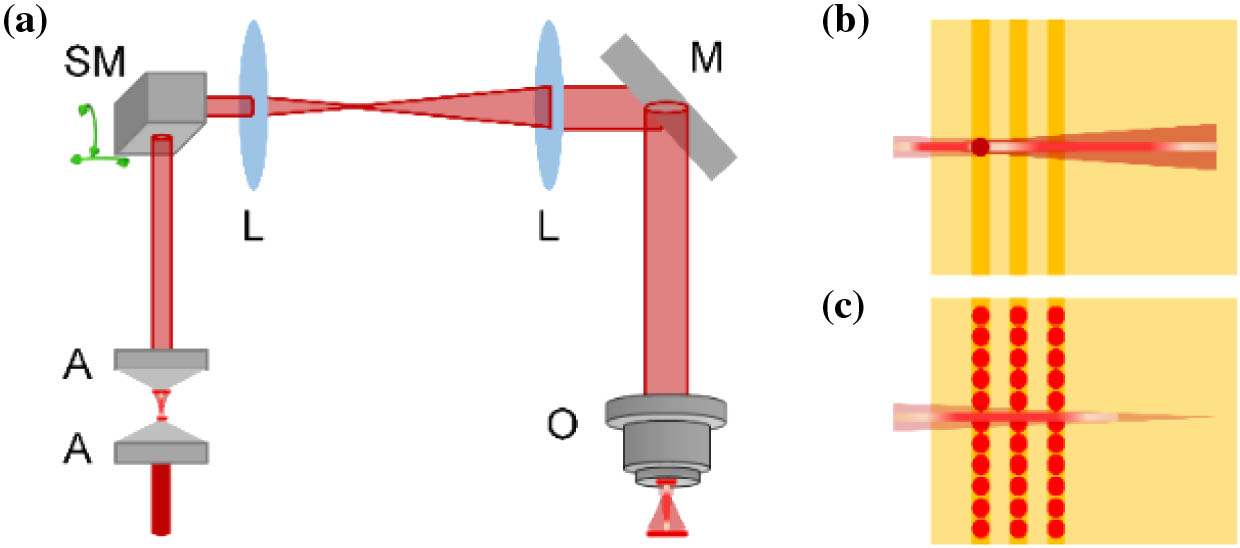
Figure 1.Illustration of the optical setup implemented in the simulations. (a) Optical setup for Bessel beam generation: A, axicon; SM, scanning mirror; L, lens; M, mirror; O, objective. (b) and (c) Simulation area and setup for single bead and multibeads, respectively.
2. RESULTS AND DISCUSSION
A. FPM Simulation of Bessel Beam-Based SRS Signal Generation
It is well-known that a Bessel beam is a type of nondiffractive light beam. Many methods, such as slit aperture, axicon, fiber, tunable acoustic gradient lens, and spatial-light modulator-based methods, can be used to generate a Bessel beam [29]. The latter may have different expressions of the electric field, depending on the different generation methods. In this work, the Bessel beam was generated by a pair of axicons combined with an objective, as shown in Fig. 1(a), and described in detail in our previous study [24]. Thus, the electric field relevant to the Bessel beam can be expressed as where and are the electric field and waist radius of the incident Gaussian beam, respectively, is the starting point for beam propagation, is the focal position, is the equivalent Rayleigh range of the Bessel beam, is the radius of the incident ring beam, denotes the 0th order Bessel function, is the wave vector, and is the angle between the beam propagation direction and the radial direction. Using the relationship between the intensity distribution and the electric field, the resulting intensity distribution of the Bessel beam can be calculated as , where is a refractive index related constant.
Several methods can be used to simulate light propagation in the scattering medium, including Monte Carlo simulation, radiative transfer equation-based method, electromagnetic field theory-based method, beam propagation method, and optical transfer function- or point-spread function-based methods [30–34]. In particular, the BPM has been successfully applied to the simulation of Bessel beam propagation since it is easy to understand and implement [28,35] as well as having good accuracy. The BPM uses the angular spectrum method and the slice-by-slice model to simulate light propagation step-by-step. During the light propagation simulation process, the uneven distributed refractive index is used to simulate the scattering condition. In this work, the stepped spectral-domain-based BPM, namely, the FPM, was used to simulate the propagation of Bessel beams as well as the generation of SRS signals in a scattering medium. The simulation process along the beam propagation direction , within a step size of , was decomposed into three operations, and the effects of diffraction and refraction were dealt with independently at each operation. The stepwise calculation of the electric field can be formulated as [28] where are the spatial frequency coordinates of , is the mean refractive index of the surroundings, is the variation of the refractive index between the scatters and the surroundings, is the electric field of the Bessel beam after propagating a step of , and and are intermediate electric fields between and . Equations (2)–(4) reveal that the initial electric field was first converted to its Fourier domain, whose result was then multiplied by the phase change on a half-step by taking the diffraction into account (i.e., the intermediate electric field ). A single refraction was then applied in the spatial domain over the entire step (i.e., the intermediate electric field ). Finally, the diffraction is applied again on the second half-step in order to obtain the final electric field . If the beam propagates in free space, the variation of the refractive index should be zero. However, Eqs. (2)–(4) show that both the variation of the refractive index and the length of the scatters would affect the beam propagation status.
In order to simulate the scatters, which affect the beam propagation status as well as the generation of SRS signals, glass beads were selected and used in the simulations. Indeed, the glass beads are a flexible and well-defined tool to investigate a strongly scattering sample [25,35,36]. Based on the aforementioned analysis, the distribution of the refractive index variation at each step should be first determined. Assuming that the beads are not spatially overlapping, this distribution can be calculated as where is the mean refractive index of the scatters, and is an impulse-like function, which is defined as where and are the radius and the central coordinates of the beads, respectively, as schematically shown in Fig. 2(a).

Figure 2.Schematic diagrams of the geometry of the added glass beads and of the simulated experimental conditions. (a) Schematic showing of geometrical parameters to determine the variation of the refractive index according to Eqs. (5) and (6). (b) Bessel beam propagation and SRS signal generation in free space. (c)–(f) Bessel beam propagation and SRS signal generation in a scattering medium by adding (c) a bead of different sizes, (d) a bead at different positions, (e) single layered beads and (f) multilayered beads of different sizes (red circles indicate the scattering beads). The pale yellow, large rectangles in panels (b)–(f) represent the target chemicals that can generate SRS signals. (g) Experimental setup relevant to the Bessel beam-based SRS simulation in the presence of scattering beads (red circles) and small chemicals (green circles). The pale yellow, large rectangle here represents the propagation medium.
SRS is a third-order nonlinear optical process that probes the third-order nonlinear susceptibility of the sample. A pump beam and a Stokes beam are required for SRS signal excitation. Assuming that the pump and the Stokes beams are collinearly overlapped, the resulting SRS signal intensity generated by the two Bessel beams can be expressed as Here, is the imaginary part of the third-order nonlinear susceptibility , is a constant [24], and and are the electric fields of the Bessel pump and Stokes beams, respectively, calculated by using Eqs. (2)–(4).
B. Generation of SRS Signals in Free Space by Two Bessel Beams
Based on Eqs. (2)–(4) and (7), the intensity distributions of the propagated pump, Stokes, and SRS fields in free space were calculated by setting the variation of the refractive index to zero. The corresponding experimental setup is shown in Fig. 2(b). A objective having a numerical aperture of 0.8 was used in all simulations, unless otherwise specified, which generates a Bessel pump beam (800 nm) having a lateral diameter of 1.5 μm and a Bessel Stokes beam (1040 nm) with a lateral diameter of 2 μm. Figures 3(a)–3(d) show the propagation status of the intensity distribution of the pump and Stokes beams. In particular, Figs. 3(a) and 3(c) are the lateral distributions at the propagation distance of 1 μm, and Figs. 3(b) and 3(d) are the longitudinal distributions along the beam propagation direction. The generated SRS signals by the two propagated Bessel pump and Stokes beams are shown in Figs. 3(e) (lateral distribution) and 3(f) (longitudinal distribution). We found that FPM well simulates the propagation of the Bessel beam and the generation of SRS signals in free space. Benefiting from the nonlinearity of SRS, the influence of side rings on SRS signal generation is suppressed [Figs. 3(e) and 3(f)].
Figure 3.Simulation of the Bessel beam intensity distributions and of the SRS signal generation in transparent and scattering media. (a) and (b) Cross-sectional and longitudinal distributions of the pump beam intensity at a wavelength of 800 nm. (c) and (d) Cross-sectional and longitudinal distributions of the Stokes beam intensity at a wavelength of 1040 nm. (e) and (f) Cross-sectional and longitudinal distributions of the SRS signal intensity generated around . Cross-sectional images listed in (a), (c), and (e) were selected at a plane of . The units of the coordinates in (a)–(f) are in micrometers. (g) Investigation of the focusing state of a Gaussian beam and (h) of the self-reconstructing property of a Bessel beam when propagating in a scattering medium. The color bars are the same for all panels displayed in each row.
C. Generation of SRS Signals in the Scattering Medium by Two Bessel Beams
Before studying the influence of scatters on SRS signal generation, we first investigated the nondiffractive and self-reconstructing properties of Bessel beam propagation. In order to better observe these properties, an objective having a numerical aperture of 0.3 and a magnification ratio of 10 was used to achieve a long depth of focus. A 100 μm glass bead was placed as an obstacle near the center of the optical axis and behind the focal point of the objective. We found that, in the absence of scatters, the Bessel beam has good nondiffractive properties, whereas the Gaussian beam gradually diverges along the propagation pathway. Under the condition of the scattering obstacle, the focusing state of the Gaussian beam is immediately destroyed and is unable to focus in the following propagation [Fig. 3(g)]; on the contrary, the Bessel beam is completely restored after propagating a distance in the form of a ring beam [Fig. 3(h)]. The simulation results therefore confirmed the nondiffractive and self-reconstructing properties of Bessel beam propagation.
1. Influence of Bead Size on the SRS Signal Generation
In order to simulate the influence of the scatter size on the SRS signal generation, a glass bead with a different radius was added to the central path of beam propagation. The bead position was recorded as (0, 0, 25) μm. The schematic diagram showing the position and size of the added bead is displayed in Fig. 2(c). Figures 4(a) and 4(b) show the longitudinal and cross-sectional distributions, respectively, of the generated SRS signals without adding the bead and with adding a bead of 0.5, 1, 2, and 6 μm in radius. The corresponding intensity profiles along the direction are plotted in Figs. 4(c) and 4(d), in order to better appreciate the recovery effect along the longitudinal direction. The intensity distribution of the SRS signal is clearly influenced by the bead size. Indeed, when the bead radius is 0.5 μm, the distribution of the generated SRS signal is almost the same as that without adding the bead, except for a small peak behind the bead [see the red curve in Fig. 4(c)]. When the radius increases to 1 μm, the added bead would affect the distribution of the generated SRS signal to a higher extent [see the blue curve in Fig. 4(c)]. The effect is even more pronounced as the radius increases to 2 and 6 μm [Fig. 4(d)]. From Figs. 4(c) and 4(d), it can be observed that periodic peaks are present along the longitudinal direction after hitting the beads. The reason for these peaks is that the Bessel beam-based SRS signal itself has periodic peaks [see the black lines in Figs. 4(c) and 4(d)]. In particular, when the radius of the bead is 0.5 μm, the periodic curve behind the first large peak is the same as that without the scattering bead. Moreover, in all the evaluated cases, a large peak immediately after hitting the bead can be observed. The bigger the size of the bead, the larger the intensity of this peak, and the more backward the position of the first peak. As a consequence, as the radius of the added bead increased, the position of signal recovery after passing through the bead became more and more lagged. This peak can be ascribed to the self-reconstructing property of the Bessel beam, which relies on the energy transfer from the side rings to the central lobe. As a matter of fact, in order to realize self-reconstruction after encountering obstacles, most of the energy would be concentrated in the central lobe first, resulting in a sudden increase of the signal intensity just after the bead; then, it returns to the side rings [see the last row of Fig. 4(b)]. The periodic peaks that follow are less intense than the first peak, showing the same level as those without the scattering bead, as shown in Figs. 4(c) and 4(d). In summary, the simulation demonstrated that, when the radius of the added bead is larger than the lateral radius of the generated SRS signal, the bead will affect the intensity distribution of the SRS signal. The larger the radius of the added bead, the greater the impact on the generation and recovery of the SRS signal.
Figure 4.Simulation of the influence of the bead size on the SRS signal generation. (a) Longitudinal and (b) cross-sectional distributions of the SRS signal intensity without adding a bead and with adding a single bead at the center of the beam with a radius of 0.5, 1, 2, and 6 μm. The cross-sectional images were selected at different axial positions , 48, 54, 60, 75, 82.5, 157.5, and 292.5 μm. The units of the coordinates are in micrometers. (c) and (d) Corresponding longitudinal profiles along the direction of the SRS signal intensity without and with adding a bead. Inset is a magnified view of the profiles plotted in (d).
2. Influence of Bead Position on SRS Signal Generation
The impact of the position of scatters on the SRS signal generation was investigated by adding a glass bead to different positions on the cross-sectional plane of the generated SRS signal, as schematically shown in Fig. 2(d). The effect of changing the radius of the moved bead was also evaluated. The selected positions were changed from 0 to 8 μm away from the center, along the lateral direction. Similarly to the previous simulation case, periodic peaks with a high first-peak appeared along the longitudinal direction after hitting beads. The effect is closely related to the position of the added bead, and, as previously demonstrated, with the increase of the bead size, the influence of the bead on the SRS signal generation is greater. When the radius of the bead is 0.5 and 1 μm, the bead has a substantial impact on the SRS signal generation only when it is placed on the central axis of the Bessel beam (Fig. 5). As the position of the added bead deviates from the beam central axis, especially when the bead size is too small to touch the central lobe, the effect on the SRS signal generation is negligible, as shown in Figs. 5(c) and 5(d).
Figure 5.Simulation results of the SRS signals affected by adding a single bead of 0.5 or 1 μm in radius at different positions on the cross-sectional plane. (a) and (b) Intensity maps of the longitudinal distribution of the SRS signals calculated by adding a bead with a radius of 0.5 and 1 μm, respectively, at positions of (0, 0, 25), (2, 0, 25), (4, 0, 25), and (8, 0, 25) μm. Intensity map without adding the bead is also reported in both figures. The units of the coordinates are in micrometers. (c) and (d) Longitudinal profiles (along the direction) of the SRS signals displayed in (a) and (b), respectively. Insets show an enlarged view of the reported profiles.
When the radius of the bead was increased to 2 μm, a greater effect on the generation of the SRS signal was observed, mainly occurring at the added positions of (0, 0, 25) and (2, 0, 25) μm, as displayed in Fig. 6(a). In particular, the closer the position of the added bead with respect to the beam central axis, the greater the impact on the signal intensity. In order to more clearly show this effect, we chose cross-sectional images at equal intervals along the beam propagation direction, thereby observing the generation and recovery of the SRS signals under the action of scatter. Some of the selected cross-sectional images are reported in Fig. 6(b). Moreover, we also found that the shape of the generated SRS signals was more affected by the addition of the bead when the latter’s position deviated from the beam central axis [e.g., see third row in Fig. 6(b)]. The longitudinal profiles of the SRS signals along the direction, extracted by the respective intensity maps, are plotted in Figs. 6(c) and 6(d). The added bead has a greater impact on the generation of SRS signals when the distance between the bead center and the beam central axis does not exceed the radius of the bead [see Fig. 6(c)]. Indeed, when the distance is exactly equal to the diameter of the added bead [i.e., position (4, 0, 25) μm], the latter still has some influence on the generation of the SRS signal [magenta line in Fig. 6(d)]. If the distance increases further, its influence can be ignored [olive line in Fig. 6(d)].
Figure 6.Simulation results of SRS signals affected by different positions of a single bead of 2 μm in radius. (a) Longitudinal and (b) cross-sectional distributions of the SRS signal intensity without adding a bead and with adding a bead at positions (0, 0, 25), (2, 0, 25), (4, 0, 25), and (8, 0, 25) μm. The cross-sectional images were selected at the planes of , 37.5, 45, 60, 75, 82.5, 157.5, and 292.5 μm. The units of the coordinates are in micrometers. (c) and (d) Longitudinal profiles (along the direction) of the SRS signals displayed in (a). Inset is an enlarged view of the reported profile of (c).
Figure 7 presents the simulation results of the generated SRS signals calculated by adding a single bead of 6 μm in radius at different positions. The longitudinal and cross-sectional distributions as well as the longitudinal profiles of the SRS signal intensity are reported in Figs. 7(a)–7(c), respectively. No matter where the bead was placed, the generated SRS signal was affected in all the evaluated cases. This is because, when the radius of the bead was 6 μm, the bead could interfere with the Bessel beam propagation in all the investigated positions, no matter where it was added. Interestingly, two noteworthy effects can be observed. First, with the position of the added bead away from the beam central axis, the position of the SRS signal recovery was moved forward, but the distance needed for recovery was increased [Fig. 7(a)]. Here, the position of the SRS signal recovery denotes the position of the high first-peak in the longitudinal direction, and the distance needed for recovery is the length of the SRS signal disappearance after the high first-peak. Second, when the added bead was far from the beam central axis [e.g., the positions (4, 0, 25) and (8, 0, 25) μm], the negative shift of the recovered SRS signal became relatively large [Fig. 7(d)]. On the whole, the presented simulations demonstrated that, only when the added bead simultaneously fell on both the central lobe and the side rings of Bessel beams, the SRS signal generation would be affected.
Figure 7.Simulation results of SRS signals affected by a single bead of 6 μm in radius placed at different positions. (a) Longitudinal and (b) cross-sectional distributions of the SRS signal intensity without adding the bead and with adding a bead at positions (0, 0, 25), (2, 0, 25), (4, 0, 25), and (8, 0, 25) μm. The cross-sectional images were selected at the planes of , 37.5, 45, 60, 75, 82.5, 157.5, and 292.5 μm. The units of the coordinates are in micrometers. (c) and (d) Longitudinal profiles (along the direction) of the SRS signals displayed in (a). Inset is an enlarged view of the reported profile of (c).
3. Influence of Bead Number and Distribution on SRS Signal Generation
The influence of the number and distribution of the added beads in a single-layered bead arrangement on the generation of the SRS signal was investigated. The number of beads was expressed in terms of the proportion of the maximum cross-sectional area of all beads to the cross-sectional area of the Bessel beams. The position and distribution of the added beads were as schematically depicted in Fig. 2(e). Figure 8 shows the longitudinal distributions and profiles of the SRS signals calculated by adding beads with a proportion of 0%, 10%, 30%, and 50%. In particular, the effect of single-layered beads of 1, 2, and 6 μm in radius was studied, whose respective results are displayed in Fig. 8. As it can be seen from Fig. 8, with the increase of the number of beads, the generation of the SRS signal was greatly affected, to a greater extent as the bead radius increases. From the longitudinal distribution maps, we found that, for 1 μm beads, the proportion of added beads had little effect on SRS signal generation. Indeed, only when the proportion reached 50%, there were some slightly obvious effects [Fig. 8(a)]. When the bead radius was 2 and 6 μm, the signal intensity of SRS generation decreased significantly [Figs. 8(b) and 8(c), respectively], especially when the proportion of beads was more than 30%. A more detailed analysis can be performed by means of the longitudinal profiles plotted in Figs. 8(d)–8(g). First, only when the size of the beads is small (e.g., 1 μm) and the proportion is high (i.e., 30% and 50%), the periodic peaks exhibit an appreciable high first-peak [see the blue and magenta lines in Figs. 8(d) and 8(e)]. This is because the Bessel beam had enough self-reconstructing ability only when both the radius and the proportion of the beads were small enough. However, if the proportion is too low, the small beads may not play an obstacle role. Second, periodic peaks along the longitudinal direction after hitting the beads can be clearly observed in the reported profiles relevant to the three sets of single-layered beads. However, such periodic peaks almost completely disappeared when the radius of the bead was 6 μm and the proportion was more than 10% [see blue and magenta lines in Fig. 8(g)]. The reason is that, when the size and the proportion of the beads are large, so is the energy loss of the Bessel beam, and the residual energy is not enough to achieve good self-reconstruction. More importantly, also for the case of a large number of beads distributed in a single layer, the beads only affected the strength of the generated SRS signal but not its shape distribution, as can be seen in Fig. 9, where the cross-sectional images of the generated SRS signals at different positions are presented for the 2 and 6 μm single-layered beads. These results demonstrated that the more densely distributed beads and the larger their radius, the greater the impact on the generation of the SRS signal. Interestingly, this effect was mainly reflected in the intensity distribution of the SRS signals along the beam propagation direction rather than in the shape distribution along the lateral direction.
Figure 8.Simulation results of the influence on the SRS signal generation of bead number and distribution in a single layered bead setup. (a), (b), and (c) Longitudinal distributions of the SRS signal intensity by adding beads with a radius of 1, 2, and 6 μm, respectively, at proportions of 0% (i.e., without adding beads), 10%, 30%, and 50%. The units of the coordinates are in micrometers. (d), (f), and (g) Respective longitudinal profiles of the SRS signal intensity distributions reported in (a)–(c). (e) Enlarged view of the reported profile of (d).
Figure 9.Simulation results of the influence on the SRS signal generation of bead number and distribution in a single layered bead setup. The cross-sectional images selected from the planes of , 37.5, 52.5, 67.5, 82.5, 97.5, 157.5, and 292.5 μm are presented for beads of (a) 2 μm, and (b) 6 μm in radius, and for proportions of 0% (i.e., no added beads), 10%, 30%, and 50%. The units of the coordinates are in micrometers.
4. Investigation of Multilayer Beads
The influence of multilayered beads, with a random distribution of both the radius and proportion, was also investigated. The experimental diagram is shown in Fig. 2(f). Figure 10 reports the corresponding results of adding different bead layers, namely, 0, 1, 2, 3, and 4 layers. Clearly, the more layers added, the greater the SRS signal generation was affected. Indeed, with each layer of beads added, the generated SRS signal intensity had a decrease [Figs. 10(a) and 10(b)]. In particular, the addition of the first two layers had the greatest influence on the SRS signal strength, resulting in a steep decrease, as quantitatively plotted in Fig. 10(c) and in its enlarged view in Fig. 10(d). From the third layer onward, the attenuation of the SRS signal strength became less pronounced. From Fig. 10(c), we also find that, in the case of four layers of beads, a large peak above normal level, behind the first layer of beads, can be observed. This is because, in the case of four-layered beads, the size and the proportion of the beads distributed in the first layer may be small, resulting in a relatively stronger self-reconstructing ability of the Bessel beam. Furthermore, with the increase of the number of bead layers, the periodic peaks of the SRS signals also disappeared, especially when the number of layers exceeded three. Presumably, the more the layers of the beads, the stronger the impact on the Bessel beams, leading to a weaker self-reconstructing ability. The situation of multilayered beads was similar to that of biological tissues, so these simulation results can effectively reproduce the generation of SRS signals in biological tissues to a certain extent.
Figure 10.Simulation results of the impact of multilayered beads on the SRS signal generation. (a) Longitudinal and (b) cross-sectional distributions of the SRS signal intensity by adding beads with 0 layer (i.e., no added beads), one layer, two layers, three layers, and four layers. The cross-sectional images were selected at the planes of , 31, 42, 55, 67.5, 82.5, 127.5, and 292.5 μm. In each layer, the beads were selected randomly with a radius from 1 μm to 6 μm, and a proportion from 10% to 50%. The units of the coordinates are in micrometers. (c) The respective longitudinal profiles of the SRS signal intensity distributions displayed in (a). (d) An enlarged view of the profiles plotted in (c).
Finally, in order to focus on the simulation of real SRS imaging experiments, the influence of multilayered beads on the SRS signals generated from sparsely distributed target chemicals was also evaluated. The simulation environment was designed to be composed of the propagation medium, scatters, and target chemicals. The whole cuboid simulation area was defined as the propagation medium. The multilayered beads played the role of scatterers, whose radius and proportion were randomly distributed. Small circular regions were defined as the sparsely distributed target chemicals that could generate SRS signals. The experimental diagram is shown in Fig. 2(h), and the detailed simulation setup is described in the Materials and Methods section. In order to demonstrate the superiority of the Bessel beam-based SRS scheme, the SRS simulation based on Gaussian beams was also carried out for comparison purposes. Figure 11 reports the relevant results showing the influence of multilayered beads on the SRS signal generation as well as the comparison between the Bessel and Gaussian beam-based SRS schemes. The results without beads are reported for both simulation schemes as a reference. First, we found that, no matter if the Bessel or the Gaussian beam-based SRS scheme was used, the multilayered beads had an attenuation effect on the generation of the SRS signals, which is consistent with the conclusion of the previous simulation. The signal attenuation caused by the first bead layer was larger than 20% for both the Bessel and the Gaussian beam-based SRS schemes [Figs. 11(e) and 11(f)]. However, after adding three layers of beads, the Gaussian beam-based SRS frame could no longer generate an SRS signal, whereas the Bessel beam-based one still had a nearly 20% residual signal. Interestingly, in presence of the scattering medium, the Bessel beams stimulated the chemicals at a deeper depth than the Gaussian beam can. On the whole, these simulation results proved the self-reconstructing features of the Bessel beam-based SRS signal as well as the remarkable superiority of the Bessel beam-based SRS scheme compared with the Gaussian beam-based one in probing chemicals in a scattering medium.
Figure 11.Simulation results of the impact of multilayered beads on the SRS signals generated from sparsely distributed target chemicals. (a) and (b) Longitudinal and (c) and (d) cross-sectional distributions of the SRS signal intensity generated by (a) and (c) the Bessel beam-based SRS scheme and (b) and (d) the Gaussian beam-based SRS scheme. The cross-sectional images were selected at the planes of , 31, 55, and 79 μm. The positions of the layers were set as , 37, 49, and 61 μm, and the target chemicals were located at (0, 0, 31), (0, 0, 55), and (0, 0, 79) μm. The units of the coordinates are in micrometers. (e) and (f) Longitudinal profiles of the SRS signal intensity generated by the Bessel and Gaussian beam-based SRS schemes, respectively.
D. Preliminary Experimental Results
To experimentally demonstrate the SRS signal generation in scattering media when using self-reconstructing Bessel beams, we built an SRS microscope that can switch between Bessel and Gaussian arms. The microscope is updated on a classical SRS microscope and is realized by adding a Bessel beam generation module, as detailed in our previous work [24]. The Bessel beam is generated by a pair of axicons combined with an objective. In order to facilitate the comparison between a Gaussian and a Bessel beam-based SRS microscopes, an additional optical arm was added to allow the laser beams to bypass axicons. By using a home-made silica-based scattering phantom, we acquired a Bessel beam-based SRS image [Fig. 12(a)] as well as Gaussian beam-based SRS sectioning images at different heights, with one of them depicted in Fig. 12(b). Figure 12(c) shows the summation of the Gaussian-beam-based SRS sectioning images from different heights. In order to quantitatively compare the difference between adding and not adding scatters as well as that between the Bessel beam-based SRS image and the Gaussian beam-based SRS sectioning image, we calculated the average intensity in the region of interest for each image, and the resulting values are plotted in Fig. 12(d). We found that the Bessel beam-based SRS is less affected by scatters compared with the Gaussian beam-based one. In particular, the intensity of the Bessel beam-based SRS signal undergoes weak loss after adding scatters. Indeed, a 51.6% intensity attenuation for the selected Gaussian beam-based SRS sectioning image and a 54.8% loss for the summation of the Gaussian-beam-based SRS sectioning images from different heights were calculated. Instead, for the Bessel beam-based SRS image, the signal loss caused by the addition of scatters was only 19.6%. Moreover, a significant distortion was observed in the Gaussian beam-based sectioning image, including the bead shape and signal blocking. For example, when the scatters were added, large black holes appeared in the Gaussian beam-based SRS sectioning image, which is different from the small artifacts before the beads were added [Fig. 12(b)]. These small artifacts can be caused by the defects of the beads themselves during the manufacturing process, since the diameter of these beads is relatively large (100 μm). However, the addition of scatters has little distortion effect on the Bessel-beam-based SRS image. On the other hand, it is worth pointing out that the Gaussian beam-based SRS images seem to have better contrast and resolution than those generated by the Bessel beams. This can be ascribed to the two following reasons. First, the available power of Bessel beams that can generate an SRS signal is less than that of Gaussian beams, since only the central lobe of Bessel beams can stimulate the SRS signal. Actually, the total power of Bessel beams at the focus used in our experiment was equal to that of Gaussian beams. Second, in the Bessel beam-based SRS scheme, the probed SRS signal is the result of the SRS signals from the extended depth of field. Such a projection strategy could also lead to a decrease in contrast and resolution, which can be eliminated to the greatest extent by a tomographic imaging method [24]. These preliminary experimental results were consistent as a whole with the results of the multilayer beads-based simulation, which proved the potential of SRS signal generation in the scattering medium using self-reconstructing Bessel beams.
Figure 12.Preliminary experimental results for the SRS signal generation in a scattering medium by two Bessel beams. (a) Bessel beam-based SRS (bSRS) signal generation with and without scatters. (b) Gaussian beam-based SRS (gSRS) sectioning imaging with and without scatters. (c) Summation of multiheight Gaussian beam-based SRS (gSRS sum) sectioning images with and without scatters. (d) Quantitative evaluation. Red rectangles in the (a)–(c) panels indicate the regions of interest. Scale bars: 50 μm.
3. CONCLUSION
Bessel beam-based SRS microscopy may effectively overcome the scattering problems encountered in conventional microscopic imaging by making full use of its self-reconstructing properties. In this paper, we demonstrated the feasibility of probing the SRS signal from a scattering medium by means of a series of simulations based on the fractal propagation method as well as a preliminary experiment with a home-made silica-based scattering phantom. As for the former, the propagation of Bessel beams and the generation of SRS signals were simulated by adding glass beads with different parameters, including size, position, number, and distribution, along the beam propagation path to simulate scatters. When the center of the bead is maintained at the same position, the larger the size of the bead, the greater the impact on the results. If the size of the bead is smaller than the diameter of the central lobe of the Bessel beam, adding the glass bead would have minimal impact on the self-reconstructing process, and the SRS signal would rapidly self-reconstruct after the bead. On the contrary, when the size of the bead is large, there will always be more obvious effects. In particular, as the size of the bead increases, the fluctuation of the signal within a short distance increases. Since the Bessel beam has a self-healing ability, it gradually recovers. However, as the radius of the bead increases, the distance required for a full recovery becomes longer. When the size of the bead remains the same, the farther away the bead is from the Bessel beam central lobe, the smaller the effect on the results. If the boundary of the glass bead is located near the beam central axis, an opposite effect to the blocking is produced. Last, as for the simulation of multibeads or multilayered beads that statistically simulate the scattering properties of biological tissues, the resulting effect is mainly reflected in the strength attenuation of SRS signal intensity along the beam propagation direction. Despite the attenuation of signal intensity, the SRS signal can still be maintained over a long distance. The results on the whole proved that the SRS signals can be generated or recovered at a certain depth in scattering media, and that such signals are clearly affected to different extents by the parameters of the added glass beads. Note that the concept presented here and the relevant feasibility demonstration can also be applied to all of the pump–probe configurations [37,38]. Finally, it should be noted that the implemented Bessel beam-based SRS scheme probes the SRS signals by accumulating contributions along the extended depth of field. This leads to the loss of the axial resolving ability. Fortunately, such axial information can be retrieved by tomographic imaging combined with the deep network-based sparse reconstruction [39,40]. Our future work will focus on performing more systematic experiments to demonstrate the feasibility of the proposed approach as well as on the development of a deep reconstruction method to retrieve the axial-resolving ability.
4. MATERIALS AND METHODS
In all simulations, unless otherwise specified, a objective with a numerical aperture of 0.8 was assumed. The wavelengths for pump and Stokes beams were set to 800 and 1040 nm, respectively. According to our previous study [24], the lateral diameter was calculated to be 1.5 μm for the pump beam and 2 μm for the Stokes beam; the depth of the focus for both the pump and the Stokes beams was 646 μm. In all of the bead-based simulations, the refractive index of the glass beads was set to 1.40 and that of the target chemical or water was 1.33. Thus, the variation of the refractive index was 0.07.
In the simulation for investigating the influence of bead size, a single glass bead was placed at (0, 0, 25) μm, as shown in Fig. 2(c). The radius of the bead was set to 0, 0.5, 1, 2, and 6 μm. In studying the influence of bead position, for each bead size mentioned above, the corresponding central positions were set to (0, 0, 25), (2, 0, 25), (4, 0, 25), and (8, 0, 25) μm, as schematically reported in Fig. 2(d). In order to more intuitively compare the influence of different bead positions, cross-sectional images at equal intervals along the beam propagation direction were selected to observe the generation and the recovery of the SRS signals under the action of scatters. In Figs. 6(b) and 7(b) the cross-sectional images started at 1 μm and were selected at 7.5 μm intervals. For investigating the influence of bead number and distribution, the proportion of the maximum cross-sectional area of all added beads to the cross-sectional area of the Bessel beams was considered. In the simulations, the cross-sectional area of the Bessel beams was . The proportion was set to 0%, 10%, 30%, and 50% respectively. The glass beads were uniformly distributed on the Bessel plane that was perpendicular to the path of the propagation of the Bessel beam. When the radius of the beads was 1 μm, the proportions of 10%, 30%, and 50% correspond to the bead number of 318, 955, and 1592, respectively. When the radius of the bead was 2 μm, the proportions of 10%, 30%, and 50% correspond to the bead number of 80, 239, and 398, respectively. If the radius of the beads increased to 6 μm, the number of these beads was changed to 9, 27, and 44, respectively. Each simulation was run 100 times; then, we took the mean as the result of the simulation. The position and the distribution of the added beads are schematically displayed in Fig. 2(e).
In the simulation to study the influence of multilayer beads, the experiment was divided into five groups: without adding the beads and adding beads with one, two, three, and four layers. In each layer, the beads were randomly distributed with a random radius ranging from 1 to 6 μm and a random proportion from 10% to 50%. The position of the added layers was selected as the plane of , 37, 49, and 61 μm. Each layer was perpendicular to the path of the Bessel beam. A schematic diagram showing the location of the layers as well as the position and distribution of the beads in each layer is shown in Fig. 2(f). Each simulation was run 200 times; then, we took the mean as the result of the simulation.
In the final simulation to investigate the influence of multilayer beads on the SRS signals generated from sparsely distributed target chemicals, the simulation environment was designed to be composed of the propagation medium, scatters, and target chemicals, as schematically shown in Fig. 2(g). Four-layer beads played the role of scatters. As in the previous simulation, the beads were randomly distributed in each layer with a random radius from 1 to 6 μm and a random proportion from 10% to 50%, and the position of the layers was set to , 37, 49, and 61 μm. Three green, small circles with a radius of 4 μm represented the sparsely distributed target chemicals that could generate SRS signals. In the simulation, these target chemicals were located at (0, 0, 31), (0, 0, 55), and (0, 0, 79) μm. For a more realistic simulation of a real SRS imaging experiment, we set the power at the focus of the Gaussian beam equal to the total power of the Bessel beam. At the same time, the focus of the Gaussian beam was adjusted to the position of the first chemical, i.e., at (0, 0, 31) μm. In the post-processing of the simulation data, all the results were normalized for better presentation. In particular, the results of Bessel beam- and Gaussian beam-based SRS were normalized to the maximum values of the respective SRS signals calculated without adding the beads.
In the preliminary experimental study, 100 μm polystyrene (PS) beads were used as the imaging target that generated SRS signals, and 10 μm silica beads were selected as scatters. The scattering phantom was prepared as follows: first, the silica beads were diluted in a deuterium oxide solution; second, we dried the silica beads and the PS beads on two glass slides, respectively; and third, the two glass slides were combined together for imaging. The SRS microscope was equipped with a pulsed laser (InSight DeepSee, Spectral Physics) at an 80 MHz repetition rate, which generated two synchronized beams. One beam had a fixed wavelength at 1040 nm and was used as the Stokes beam; the other beam had a tunable wavelength from 680 to 1300 nm and was used as the pump beam. A water immersion objective (LUMPlan FLN , , Olympus) was used to generate the focused Bessel or Gaussian beams, and a water immersion objective (UPlanSApo , , Olympus) was used to collect the transmitted light. By means of flip mirrors, the microscope could quickly switch between the Bessel and the Gaussian SRS schemes. For the SRS imaging of the PS beads, the wavelength of the pump beam was tuned to 789 nm, thereby exciting a Raman shift at . The powers of the pump and Stokes beams on the sample were 15 and 50 mW, respectively (total powers for Bessel beams). The pixel dwell time was 10 μs, and the image size was pixels.
Acknowledgment
Acknowledgment. Xueli Chen thanks Dr. Karen M. von Deneen for correcting our English grammar.
References
[1] C. L. Evans, X. S. Xie. Coherent anti-Stokes Raman scattering microscopy: chemical imaging for biology and medicine. Annu. Rev. Anal. Chem., 1, 883-909(2008).
[2] C. H. Camp, Y. J. Lee, J. M. Heddleston, C. M. Hartshorn, A. R. H. Walker, J. N. Rich, J. D. Lathia, M. T. Cicerone. High-speed coherent Raman fingerprint imaging of biological tissues. Nat. Photonics, 8, 627-634(2014).
[3] C. Zhang, D. Zhang, J. X. Cheng. Coherent Raman scattering microscopy in biology and medicine. Annu. Rev. Biomed. Eng., 17, 415-445(2015).
[4] J. X. Cheng, X. S. Xie. Vibrational spectroscopic imaging of living systems: an emerging platform for biology and medicine. Science, 350, aaa8870(2015).
[5] C. S. Liao, P. Wang, C. Y. Huang, P. Lin, G. Eakins, R. T. Bentley, R. Liang, J. X. Cheng. In vivo and in situ spectroscopic imaging by a handheld stimulated Raman scattering microscope. ACS Photon., 5, 947-954(2018).
[6] C. W. Freudiger, W. Min, B. G. Saar, S. Lu, G. R. Holtom, C. He, J. C. Tsai, J. X. Kang, X. S. Xie. Label-free biomedical imaging with high sensitivity by stimulated Raman scattering microscopy. Science, 322, 1857-1861(2008).
[7] D. Zhang, P. Wang, M. N. Slipchenko, J. X. Cheng. Fast vibrational imaging of single cells and tissues by stimulated Raman scattering microscopy. Acc. Chem. Res., 47, 2282-2290(2014).
[8] Y. Wakisaka, Y. Suzuki, O. Iwata, A. Nakashima, T. Ito, M. Hirose, R. Domon, M. Sugawara, N. Tsumura, H. Watarai, T. Shimobaba, K. Suzuki, K. Goda, Y. Ozeki. Probing the metabolic heterogeneity of live Euglena gracilis with stimulated Raman scattering microscopy. Nat. Microbiol., 1, 16124(2016).
[9] C. H. Camp, M. T. Cicerone. Chemically sensitive bioimaging with coherent Raman scattering. Nat. Photonics, 9, 295-305(2015).
[10] S. Heuke, F. B. Legesse, D. Akimov, U. Hubner, J. Dellith, M. Schmitt, J. Popp. Bessel beam coherent anti-Stokes Raman scattering microscopy. J. Opt. Soc. Am. A, 32, 1773-1779(2015).
[11] S. Heuke, J. Zheng, D. Akimov, R. Heintzmann, M. Schmitt, J. Popp. Bessel beam CARS of axially structured samples. Sci. Rep., 5, 10991(2015).
[12] M. Wei, L. Shi, Y. Shen, Z. Zhao, A. Guzman, L. J. Kaufman, L. Wei, W. Min. Volumetric chemical imaging by clearing-enhanced stimulated Raman scattering microscopy. Proc. Natl. Acad. Sci. USA, 116, 6608-6617(2019).
[13] X. Xu, H. Liu, L. V. Wang. Time-reversed ultrasonically encoded optical focusing into scattering media. Nat. Photonics, 5, 154-157(2011).
[14] Y. M. Wang, B. Judkewitz, C. A. DiMarzio, C. Yang. Deep-tissue focal fluorescence imaging with digitally time-reversed ultrasound-encoded light. Nat. Commun., 3, 928(2012).
[15] Y. Liu, P. Lai, C. Ma, X. Xu, A. A. Grabar, L. V. Wang. Optical focusing deep inside dynamic scattering media with near-infrared time-reversed ultrasonically encoded (TRUE) light. Nat. Commun., 6, 5904(2015).
[16] P. Lai, L. Wang, J. W. Tay, L. V. Wang. Photoacoustically guided wavefront shaping for enhanced optical focusing in scattering media. Nat. Photonics, 9, 126-132(2015).
[17] F. Wang, H. Wan, Z. Ma, Y. Zhong, Q. Sun, Y. Tian, L. Qu, H. Du, M. Zhang, L. Li, H. Ma, J. Luo, Y. Liang, W. Li, G. Hong, L. Liu, H. Dai. Light-sheet microscopy in the near-infrared II window. Nat. Methods, 16, 545-552(2019).
[18] J. Yao, L. Wang, J. M. Yang, K. I. Maslov, T. T. W. Wong, L. Li, C. H. Huang, J. Zou, L. V. Wang. High-speed label-free functional photoacoustic microscopy of mouse brain in action. Nat. Methods, 12, 407-410(2015).
[19] G. Theriault, M. Cottet, A. Castonguay, N. McCarthy, Y. D. Koninck. Extended two-photon microscopy in live samples with Bessel beams: steadier focus, faster volume scans, and simpler stereoscopic imaging. Front. Cell. Neurosci., 8, 139(2014).
[20] T. A. Planchon, L. Gao, D. E. Milkie, M. W. Davidson, J. A. Galbraith, C. G. Galbraith, E. Betzig. Rapid three-dimensional isotropic imaging of living cells using Bessel beam plane illumination. Nat. Methods, 8, 417-423(2011).
[21] L. Gao, L. Shao, B. C. Chen, E. Betzig. 3D live fluorescence imaging of cellular dynamics using Bessel beam plane illumination microscopy. Nat. Protoc., 9, 1083-1101(2014).
[22] J. Shi, L. Wang, C. Noordam, L. V. Wang. Bessel-beam Grueneisen relaxation photoacoustic microscopy with extended depth of filed. J. Biomed. Opt., 20, 116002(2015).
[23] K. S. Lee, J. P. Rolland. Bessel beam spectral-domain high-resolution optical coherence tomography with micro-optic axicon providing extended focusing range. Opt. Lett., 33, 1696-1698(2008).
[24] X. Chen, C. Zhang, P. Lin, K. C. Huang, J. Liang, J. Tian, J. X. Cheng. Volumetric chemical imaging by stimulated Raman projection microscopy and tomography. Nat. Commun., 8, 15117(2017).
[25] F. O. Fahrbach, P. Simon, A. Rohrbach. Microscopy with self-reconstructing beams. Nat. Photonics, 4, 780-785(2010).
[26] F. O. Fahrbach, V. Gurchenkov, K. Alessandri, P. Nassoy, A. Rohrbach. Light-sheet microscopy in thick media using scanned Bessel beams and two-photon fluorescence excitation. Opt. Express, 21, 13824-13839(2013).
[27] Y. Chen, A. Glaser, J. T. C. Liu. Bessel-beam illumination in dual-axis confocal microscopy mitigates resolution degradation caused by refractive heterogeneities. J. Biophoton., 10, 68-74(2017).
[28] A. K. Glaser, Y. Chen, J. T. C. Liu. Fractal propagation method enables realistic optical microscopy simulations in biological tissues. Optica, 3, 861-869(2016).
[29] M. Duocastella, C. B. Arnold. Bessel and annular beams for materials processing. Laser Photon. Rev., 6, 607-621(2012).
[30] S. Ren, X. Chen, H. Wang, X. Qu, G. Wang, J. Liang, J. Tian. Molecular optical simulation environment (MOSE): a platform for the simulation of light propagation in turbid media. PLoS ONE, 8, e61304(2013).
[31] A. D. Klose. The forward and inverse problem in tissue optics based on the radiative transfer equation: a brief review. J. Quant. Spectrosco. Radiat. Transfer, 111, 1852-1853(2010).
[32] L. Han, Y. Han, J. Wang, Z. Cui. Internal and near-surface electromagnetic fields for a dielectric spheroid illuminated by a zero-order Bessel beam. J. Opt. Soc. Am. A, 31, 1946-1955(2014).
[33] I. L. Katsev, A. S. Prikhack, N. S. Kazak, M. Kroening. Peculiarities of propagation of quasi-diffraction-free light beams in strongly scattering absorbing media. Quantum Electron., 36, 357-362(2006).
[34] A. Boniface, M. Mounaix, B. Blochet, R. Piestun, S. Gigan. Transmission-matrix-based point-spread-function engineering through a complex medium. Optica, 4, 54-59(2017).
[35] J. Zheng, B. Yao, Y. Yang, M. Lei, P. Gao, R. Li, S. Yan, D. Dan, T. Ye. Investigation of Bessel beam propagation in scattering media with scalar diffraction method. Chin. Opt. Lett., 11, 112601(2013).
[36] F. O. Fahrbach, A. Rohrbach. Propagation stability of self-reconstructing Bessel beams enables contrast-enhanced imaging in thick media. Nat. Commun., 3, 632(2012).
[37] J. Chen, X. Yuan, J. Li, P. Dong, I. Hamza, J. X. Cheng. Label-free imaging of Heme dynamics in living organisms by transient absorption microscopy. Anal. Chem., 90, 3395-3401(2018).
[38] F. E. Robles, S. Deb, J. W. Wilson, C. S. Gainey, M. A. Selim, P. J. Mosca, D. S. Tyler, M. C. Fischer, W. S. Warren. Pump-probe imaging of pigmented cutaneous melanoma primary lesions gives insight into metastatic potential. Biomed. Opt. Express, 6, 3631-3645(2015).
[39] X. Chen, S. Zhu, H. Wang, C. Bao, D. Yang, C. Zhang, P. Lin, J. X. Cheng, Y. Zhan, J. Liang, J. Tian. Accelerated stimulated Raman projection tomography by sparse reconstruction from sparse-view data. IEEE Trans. Biomed. Eng., 67, 1293-1302(2020).
[40] X. Dong, S. Vekhande, G. Gao. Sinogram interpolation for sparse-view micro-CT with deep learning neural network. Proc. SPIE, 10948, 109482O(2019).


