• Acta Optica Sinica
  • Vol. 39, Issue 1, 0126009 (2019)
Chonglei Zhang*, Ziqiang Xin, Changjun Min, and Xiaocong Yuan*
Author Affiliations
  • Nanophotonics Research Center, Shenzhen Key Laboratory of Micro-Scale Optical Information Technology, Shenzhen University, Shenzhen, Guangdong 518060, China
  • show less
    DOI: 10.3788/AOS201939.0126009 Cite this Article Set citation alerts
    Chonglei Zhang, Ziqiang Xin, Changjun Min, Xiaocong Yuan. Refractive Index Sensing Imaging Technology Based on Optical Surface Wave[J]. Acta Optica Sinica, 2019, 39(1): 0126009 Copy Citation Text show less
    Dispersion relationship curves of light propagating in free space, dielectric and SPs
    Fig. 1. Dispersion relationship curves of light propagating in free space, dielectric and SPs
    Schematic of intensity detection mechanism based on optical surface wave
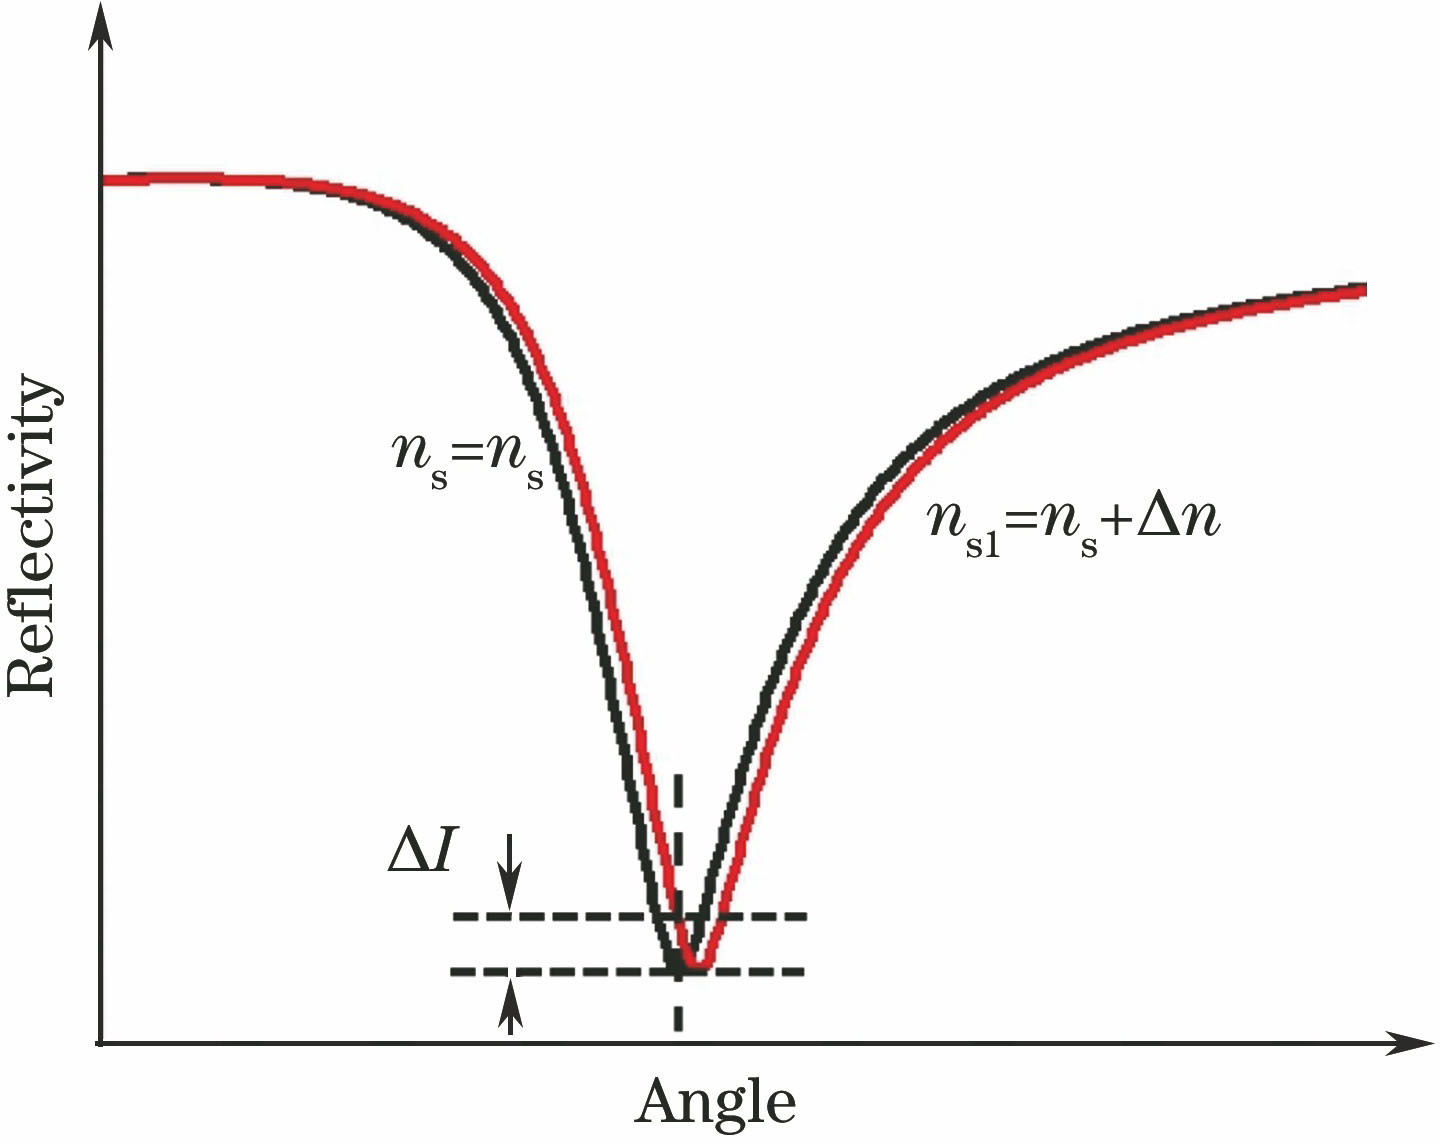
    Fig. 2. Schematic of intensity detection mechanism based on optical surface wave
    Schematic of angle detection mechanism based on optical surface wave
    Fig. 3. Schematic of angle detection mechanism based on optical surface wave
    Schematic of wavelength detection mechanism based on optical surface wave
    Fig. 4. Schematic of wavelength detection mechanism based on optical surface wave
    Contrast schematic of angle detection mechanism and phase detection mechanism based on optical surface wave
    Fig. 5. Contrast schematic of angle detection mechanism and phase detection mechanism based on optical surface wave
    Propagation direction of SPR surface waves excited by different SPR. (a) Kretschmann structure or Otto structure; (b) focusing structure of high numerical aperture objective lens
    Fig. 6. Propagation direction of SPR surface waves excited by different SPR. (a) Kretschmann structure or Otto structure; (b) focusing structure of high numerical aperture objective lens
    Images of epidermal cells[46]. (a) Images obtained by ordinary optical microscopy; (b) images obtained by SPRI; (c) stereoscopic images of refractive index distribution obtained by SPRI
    Fig. 7. Images of epidermal cells[46]. (a) Images obtained by ordinary optical microscopy; (b) images obtained by SPRI; (c) stereoscopic images of refractive index distribution obtained by SPRI
    SPR imaging of single cell[112]. (a) Schematic; (b) SPR image and phase contrast image; (c) line scanning map of SPR images
    Fig. 8. SPR imaging of single cell[112]. (a) Schematic; (b) SPR image and phase contrast image; (c) line scanning map of SPR images
    Acoustic signal detection system based on SPR sensing[113]. (a) Schematic of detection system; (b) contrast curves of bandwidth between designed system and different ultrasonic transducers; (c) photoacoustic image of melanoma cells; (d) relation diagram between refractive index response and sound pressure signal based on SPR
    Fig. 9. Acoustic signal detection system based on SPR sensing[113]. (a) Schematic of detection system; (b) contrast curves of bandwidth between designed system and different ultrasonic transducers; (c) photoacoustic image of melanoma cells; (d) relation diagram between refractive index response and sound pressure signal based on SPR
    Gas flow velocity measurement system based on graphene surface wave[119]. (a) Schematic of measurement system; (b) flow direction diagram; (c) time-resolved voltage signals for gas flow direction
    Fig. 10. Gas flow velocity measurement system based on graphene surface wave[119]. (a) Schematic of measurement system; (b) flow direction diagram; (c) time-resolved voltage signals for gas flow direction
    Schematic of NO2 content measurement based on graphene surface wave structure adsorption[120]. (a) Principle diagram of optical gas sensor; (b) schematic of gas control and sensor unit measurement system for NO2 sensing; (c) detection results of different NO2 contents; (d) slop curves of different concentrations in different periods
    Fig. 11. Schematic of NO2 content measurement based on graphene surface wave structure adsorption[120]. (a) Principle diagram of optical gas sensor; (b) schematic of gas control and sensor unit measurement system for NO2 sensing; (c) detection results of different NO2 contents; (d) slop curves of different concentrations in different periods
    System for measuring the refractive index of cell surface based on graphene surface wave[125]. (a) Schematic of the system structure; (b) schematic of polarization analysis; (c0)-(c4) mitosis process of cells
    Fig. 12. System for measuring the refractive index of cell surface based on graphene surface wave[125]. (a) Schematic of the system structure; (b) schematic of polarization analysis; (c0)-(c4) mitosis process of cells
    Microscopic system for measuring acoustic signals based on graphene surface wave[127]. (a) Principle diagram of photoacoustic attenuated total reflection sensing based on graphene; (b) spectral profiles of the photoacoustic pressure system; (c) relationship curve between imaging signal-to noise ratio and penetration depth; (d) angiograms of mouse ear
    Fig. 13. Microscopic system for measuring acoustic signals based on graphene surface wave[127]. (a) Principle diagram of photoacoustic attenuated total reflection sensing based on graphene; (b) spectral profiles of the photoacoustic pressure system; (c) relationship curve between imaging signal-to noise ratio and penetration depth; (d) angiograms of mouse ear
    StructureMeasurement parameterResponse unitMultidata noise restraintMinimum discernible signalRefractive resolution /RIUDynamic range /RIUBig flux measurements capacity
    IntensityReflection luminous intensityNo10-50.05Excellent
    AngleAngular depression position2×102(°) /RIUYes10-4°5×10-70.1Medium
    SpectraWave crest depression location104 nm /RIUYes10-2 nm10-6>0.1Medium
    Angular spectral bindingAngular spectrum depressionYes<10-50.1Excellent
    PhasePhase change~105(°) /RIUYes10-3°~10-80.0005-0.05Excellent
    Table 1. Comparison of sensor measurement parameters based on different detection mechanisms[77]
    ReferenceExperimental factorResolution
    Metal layerWavelengthSample
    Ref.[105]56 nm Ag633 nmDielectric25 μm
    Ref.[85]50 nm Ag633 nmCadA multilayerFew microns
    Ref.[106]5.5 nm Cr/41 nmAg633 nmLipid monolayer5 μm
    Ref.[107]50 nm AgWhite lightCuPc filmFew microns
    Ref.[103]45 nm AuWhite lightProtein array54 μm
    Ref.[108]53 nm Ag633 nmBiological cells40 μm
    Table 2. SPR imaging resolutions based on total internal reflection structure
    Chonglei Zhang, Ziqiang Xin, Changjun Min, Xiaocong Yuan. Refractive Index Sensing Imaging Technology Based on Optical Surface Wave[J]. Acta Optica Sinica, 2019, 39(1): 0126009
    Download Citation