
Zhou Zheng, Zhengying Li, Xuelei Fu, Xin Gui. Coherent-detection-based distributed acoustic impedance sensing enabled by a chirped fiber Bragg grating array[J]. Photonics Research, 2022, 10(6): 1325
- Photonics Research
- Vol. 10, Issue 6, 1325 (2022)
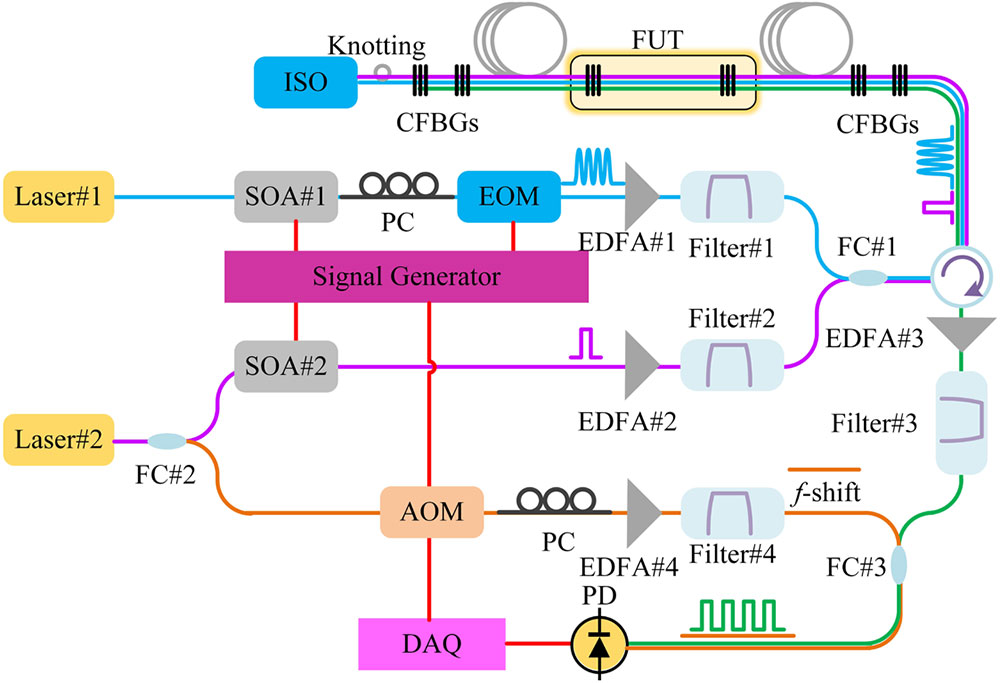
Fig. 1. Experimental setup of the coherent-detection-based distributed acoustic impedance sensing system enabled by a grating array. SOA, semiconductor optical amplifier; EOM, electro-optic modulator; EDFA, erbium-doped optical fiber amplifier; FC, fiber coupler; CFBGs, chirped fiber Bragg gratings; FUT, fiber under test; ISO, isolator; AOM, acousto-optic modulator; PC, polarization controller; PD, photodetector; DAQ, data acquisition card.
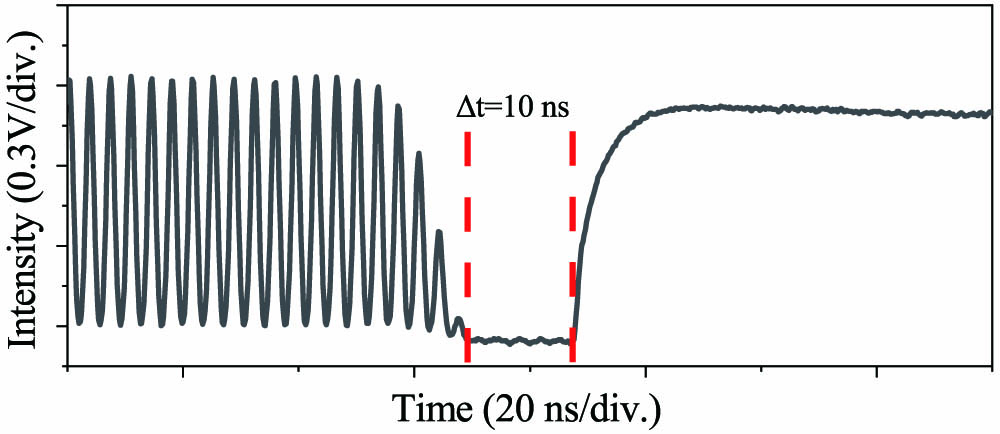
Fig. 2. Partial temporal waveform of the excitation and probe pulses, presenting 10-ns guard interval.
Fig. 3. (a) Beat signal segment and (b) normalized spectrum corresponding to a sensing fiber section between two CFBGs, when the excitation pulse is turned off.
Fig. 4. (a) Beat signal segment and (b) normalized spectrum corresponding to a sensing fiber section between two CFBGs, when the excitation pulse is turned on.
Fig. 5. (a) Beat signal of Rayleigh scattering as the excitation pulse is turned on and (b) frequency-domain diagram. (c) Part of the beat signal and (d) its corresponding frequency-domain diagram.
Fig. 6. Beat pulses generated by the entire sensing fiber.
Fig. 7. Spectra of beat pulses from the entire sensing fiber.
Fig. 8. Evolution of amplitudes of frequency components at p Ω F − ω LO ( p = 0,1,2 )
Fig. 9. (a) Averaged additional phase factor ξ ( z r ) Δ ξ ( z r )
Fig. 10. Distributed FSBS spectra when the stripped fiber section is placed in (a) air, (b) anhydrous ethanol, and (c) water.
Fig. 11. FSBS spectra of the stripped fiber section when it is placed in (a) air, (b) anhydrous ethanol, and (c) water.
| ||||||||||||||||||||||||||||||||||||
Table 1. Beat Frequencies Corresponding to p = 0 , ± 1 , 2 f LO = 200 MHza

Set citation alerts for the article
Please enter your email address
© Copyright 2018-2021 | Chinese Laser Press. All Rights Reserved 沪ICP备15018463号-20