• Photonics Research
  • Vol. 10, Issue 6, 1325 (2022)
Zhou Zheng1, Zhengying Li1、2、3、*, Xuelei Fu1, and Xin Gui2
Author Affiliations
  • 1Hubei Key Laboratory of Broadband Wireless Communication and Sensor Networks, School of Information Engineering, Wuhan University of Technology, Wuhan 430070, China
  • 2National Engineering Laboratory for Fiber Optic Sensing Technology, Wuhan University of Technology, Wuhan 430070, China
  • 3State Key Laboratory of Silicate Materials for Architectures, Wuhan University of Technology, Wuhan 430070, China
  • show less
    DOI: 10.1364/PRJ.450127 Cite this Article Set citation alerts
    Zhou Zheng, Zhengying Li, Xuelei Fu, Xin Gui. Coherent-detection-based distributed acoustic impedance sensing enabled by a chirped fiber Bragg grating array[J]. Photonics Research, 2022, 10(6): 1325 Copy Citation Text show less

    Abstract

    Distributed optical fiber sensing exploring forward stimulated Brillouin scattering (FSBS) has received wide attention, as it indicates a new sensing method to measure the liquid property surrounding an optical fiber. In the existing techniques, backward stimulated Brillouin scattering is adopted for detection of the sensing signal, which requires time-consuming signal acquisition and post-processing. In this work, an approach that distributedly measures FSBS spectra is proposed and demonstrated based on coherent detection. While an excitation pulse with single-frequency amplitude modulation is used to induce a guided acoustic mode in the fiber, a following pulse is adopted to probe the induced phase modulation. Using a chirped fiber Bragg grating array, an enhanced-backward-propagating sensing signal is generated from the probe pulse. Heterodyne coherent-detection-based phase demodulation is then realized by mixing the sensing signal with a local oscillator. The FSBS spectra can then be reconstructed from the beat signals with only one round of frequency sweeping. With significantly accelerated signal acquisition and simplified post-processing, the proposed distributed acoustic sensing system has achieved spatial resolution of 5 m over a 500-m sensing range.

    1. INTRODUCTION

    Distributed optical fiber sensing has been investigated extensively for various engineering applications due to its unique advantages, such as immunity to electromagnetic interference, small size, and the capability of long-term monitoring [13]. Traditional distributed optical fiber sensors are commonly realized by exploring Raman scattering [3], Rayleigh backscattering [4], or backward stimulated Brillouin scattering (BSBS) [5] in optical fibers. In such distributed sensors, light does not interact with the environment directly, and sensing is achieved because the environment affects the fiber property, which modifies the characteristics of the scattering effects. Consequently, the physical quantities that can be measured are limited to temperature, strain, and vibration, and the parameters derived from them. Direct interaction between light and the environment can be realized using fiber tapers or D-shaped fibers. By facilitating refractive index, chemical, and biomedical sensing, these sensors can be applied in the petrochemical industry or to guarantee food safety [68]. However, the compromised mechanical strength, large insertion loss, and complicated structure make large-scale multiplexing of the sensors difficult.

    In recent years, a novel optical fiber sensing method has been proposed by exploring forward stimulated Brillouin scattering (FSBS) [9]. In this nonlinear scattering process, radial and torsional-radial acoustic modes are induced optically. These acoustic modes lead to refractive index modulation of the optical fiber due to photo-elasticity, resulting in phase and/or polarization modulation on the forward-propagating light. As radial and torsional-radial modes are sensitive to the acoustic property of the surrounding liquid, the acoustic impedance of the liquid can be obtained from the FSBS spectrum of a specific acoustic mode by demodulating the induced phase or polarization modulation [10,11].

    Apart from no longer requiring complicated sensor structure design, FSBS-based acoustic impedance sensing is promising for the realization of sensor multiplexing or even distributed sensing. Several techniques have been developed based on different FSBS excitation and detection schemes. With continuous-wave (CW) light excitation, a multi-point sensor is realized with a frequency-division multiplexing (FDM) scheme based on spontaneous forward Brillouin scattering, reporting spatial resolution of 0.8 m with limited multiplexing capacity [12]. By injecting a set of dual-frequency pulses with a frequency difference matching a specific acoustic mode, continuous energy transfer between the two pulses can be facilitated through FSBS. Distributed FSBS measurement can thus be realized by exploring opto-mechanical time-domain reflectometry (OM-TDR) [13,14] or OM time-domain analysis (OM-TDA) [1517], achieving spatial resolution of up to 0.8 m. However, due to the small frequency interval between the two pulses, for each data point of the FSBS spectrum, the BSBS spectrum has to be constructed first to measure each component separately in virtue of its narrowband filtering and amplification capability. Consequently, two round frequency sweeps are required for the reconstruction of FSBS and BSBS spectra, making sensing signal acquisition and processing very time consuming. Using an excitation pulse with amplitude modulation at a specific frequency, the intensity of FSBS can be obtained via the evolution of refractive index modulation depth or probe pulse central frequency shift along the fiber [18,19], achieving a spatial resolution up to 0.8 m based on Brillouin optical-fiber TDA (BOTDA). However, the reconstruction of BSBS and FSBS spectra is also necessary. The sensing system based on Brillouin optical TDR (BOTDR) has achieved 8-m spatial resolution [19] with only one round of frequency sweep to reconstruct the FSBS spectrum. Nonetheless, excessive reliance on a bandpass filter to obtain each component’s intensity limits its practical application.

    By coherently detecting the Rayleigh backscattering signal generated from an optical pulse under FSBS influence, it seems possible to obtain the refractive index modulation depth. In that case, the additional frequency sweep required for BSBS-based detection becomes unnecessary. However, due to the weak and random nature of Rayleigh backscattering in standard single-mode fibers (SMFs), the sensing signal level is too low to achieve the signal-to-noise ratio (SNR) required for acoustic impedance measurement, even with coherent detection.

    In this work, we propose and demonstrate a distributed acoustic impedance sensing technique based on coherent detection, by generating an enhanced backward-propagating sensing signal using an identical chirped fiber Bragg grating (CFBG) array. The excitation method proposed by Chow et al. [18,19] is applied for FSBS excitation, in which a long excitation pulse with single-frequency amplitude modulation is adopted to selectively invoke a specific radial mode. A short probe pulse, whose wavelength matches the reflection band of the CFBGs, is used to generate the enhanced distributed sensing signal, while it is phase modulated by the induced radial mode as it propagates in the fiber. By mixing the sensing signal with a phase-locked local oscillator, heterodyne coherent detection is achieved. From the beat signals, the amplitudes of the phase modulation peaks are obtained, which are used to calculate the distributed refractive index modulation depth. With the proposed technique, only one round of frequency sweep is required for the reconstruction of FSBS spectra, leading to significantly accelerated sensing signal acquisition and simplified post-processing. Distributed sensing with 5-m spatial resolution and 500-m sensing distance is experimentally demonstrated.

    2. PRINCIPLE

    In this work, FSBS is invoked using an optical pulse with single-frequency amplitude modulation near the resonance frequency of a radial mode. For clarity, the radial mode is denoted by R0,m, where m corresponds to the order of the acoustic mode. As this excitation pulse propagates in the sensing fiber, distributed refractive index modulation is induced, as given by [18] Δn(vF,z,t)=αRI(vF,z)cos(2πvFt),where vF is the frequency of amplitude modulation, and z is the position. αRI(vF,z) represents the refractive index modulation depth, which can be obtained by demodulating the distributed phase modulation experienced by a probe pulse. The electric field of the probe pulse can then be expressed as [18] E0(vF,zr,t)=A0(zr,t)exp[j(kzzrω0t+φ0)]{p=+Jp[ξ(vF,zr)]exp[j(pΩFt+Δφ)]}=A0(zr,t)exp[j(kzzr+φ0)]{p=+Jp[ξ(vF,zr)]exp{j[(pΩFω0)t+Δφ]}},where Δφ=pπ/2, φ0 represents the initial phase, ξ(vF,zz) is the additional phase factor caused by the FSBS, A(zr,t) is the spatiotemporal envelope, ω0 is the optical frequency, kz is the axial optical wave vector, and zr is the position of the probe pulse in the fiber. As indicated by Eq. (2), sidebands with orders denoted by p and separated by vF are generated around the optical carrier frequency due to phase modulation. By recovering the distributed evolution of the amplitudes of the sidebands, the phase modulation depth along the fiber can be obtained [18]. In this work, this is done by heterodyne coherent detection. A frequency-shifted local oscillator is combined with the sensing signal, whose electrical field is given by E1(zr,t)=A1(zr,t)exp[j(kzzrω1t+φ1)].

    In Eq. (3), kz is the axial optical wave vector of the local oscillator. φ1 represents the initial phase, and ω1=ω0ωLO and ωLO=2πfLO, where fLO is the frequency difference between the probe pulse and local oscillator. After being detected by an alternate-current-coupled photodetector (PD), the beat signal can be obtained, with the corresponding sideband amplitudes given by Ir=q·p=+Ir(p)=2qA0A1+Jp[ξ(vF,zr)]cos[(pΩFωLO)t+Δφ+Δφ],where q=σ(zr)R, σ(zr) is the transmission loss in the sensing fiber, R is the reflectivity of the CFBG, and Δφ=kzzr+φ0(kzzr+φ1).

    Equation (4) implies that the sideband intensities, determined by Jp[ξ(vF,zr)], can be obtained by applying fast Fourier transform (FFT) on the acquired time-domain beat signal. The phase factor can then be calculated based on the Bessel recurrence relation [18] ξ(vF,zr)=2{J1[ξ(vF,zr)]J0[ξ(vF,zr)]+J2[ξ(vF,zr)]}=2(K1K0+K2),where K0,K1, and K2 are the amplitudes of the beat frequency components at fLO, |vFfLO|, and |2vFfLO|, which correspond to phase modulation peaks with p=0,1,2, respectively. The amplitude of refractive index modulation can then be calculated using [18] αRI(vF,zr)=λ2πξ(vF,zr)ξ(vF,zrΔz)Δz,where Δz is the grating spacing between the adjacent CFBGs and represents the spatial resolution of the sensing system. ξ(vF,zr) indicates the averaging process of ξ(vF,zr).

    3. EXPERIMENTAL SETUP AND RESULTS

    The experimental setup depicted by Fig. 1 is adopted to demonstrate the coherent-detection-based distributed acoustic impedance sensing technique. To generate the excitation pulse, the output of laser#1 is first modulated using a semiconductor optical amplifier (SOA#1) in a rectangular pulse with 250-ns pulse width. An electro-optic modulator (EOM) is then applied to incorporate single-frequency amplitude modulation at vF. The output pulse is amplified by an erbium-doped fiber amplifier (EDFA#1), and an optical bandpass filter (filter#1) is used to reject the amplified spontaneous emission (ASE) noise. The strong excitation pulse is directed to the acoustic impedance sensing fiber through the 90% port of a fiber coupler (FC#1) and an optical circulator. The sensing fiber is a 500-m CFBG array, which contains 100 CFBGs separated by 5 m. The CFBGs are inscribed serially using the phase-mask method, while the fiber is fabricated by a drawing tower [20,21]. All the CFBGs are identical, presenting 1-cm grating length, 1550-nm center wavelength, 4-nm reflection bandwidth, and 37-dB reflectivity. The power loss induced by the CFBGs is 0.18  dB/km, which is comparable to the attenuation coefficient of a commercial SMF. The center wavelength of laser#1 is set at 1559.79 nm, so that the excitation pulse experiences negligible reflection at the CFBGs. By tuning vF to the resonance frequency of a specific R0,m mode, efficient FSBS can be facilitated as the excitation pulse propagates in the sensing fiber. To prevent the influence from the reflection at the fiber end, a small knot is made to introduce large bending loss, and an optical isolator is used to further reduce the strength of backreflection. To obtain the distributed refractive index modulation depth in the sensing fiber, a probe pulse with 42-ns pulse width is generated from the 10% output of laser#2 using SOA#2. The center wavelength of laser#2 is set at 1550.12 nm, matching the reflection band of the CFBGs. After optical amplification by EDFA#2 and ASE filtering by filter#2, the probe pulse is directed to the sensing fiber through the 10% port of FC#1 and the optical circulator. As the probe pulse propagates in the sensing fiber, it experiences phase modulation caused by the excited R0,m mode. To eliminate the influence of cross-phase modulation, a guard time interval Δt=10  ns is introduced between the excitation and probe pulses [18], as shown in Fig. 2. The position-resolved phase modulation information is then carried by the sensing signal generated by the reflections of the probe pulse at the CFBGs. Before heterodyne coherent detection, the sensing signal is amplified by EDFA#3, and filter#3 is used to reject both the ASE noise and residual excitation pulse. The local oscillator for heterodyne coherent detection is generated from the other 90% output of laser#2, which is frequency shifted by fLO using an acousto-optic modulator (AOM), amplified by EDFA#4, and filtered by filter#4. After combining using FC#3, the beat signal of the local oscillator and the sensing signal is obtained using a PD and acquired by a digital acquisition card (DAQ). For clarity, the optical paths of the excitation pulse, probe pulse, sensing signal, and local oscillator are indicated by the blue, purple, green, and orange lines in Fig. 1, respectively.

    Experimental setup of the coherent-detection-based distributed acoustic impedance sensing system enabled by a grating array. SOA, semiconductor optical amplifier; EOM, electro-optic modulator; EDFA, erbium-doped optical fiber amplifier; FC, fiber coupler; CFBGs, chirped fiber Bragg gratings; FUT, fiber under test; ISO, isolator; AOM, acousto-optic modulator; PC, polarization controller; PD, photodetector; DAQ, data acquisition card.

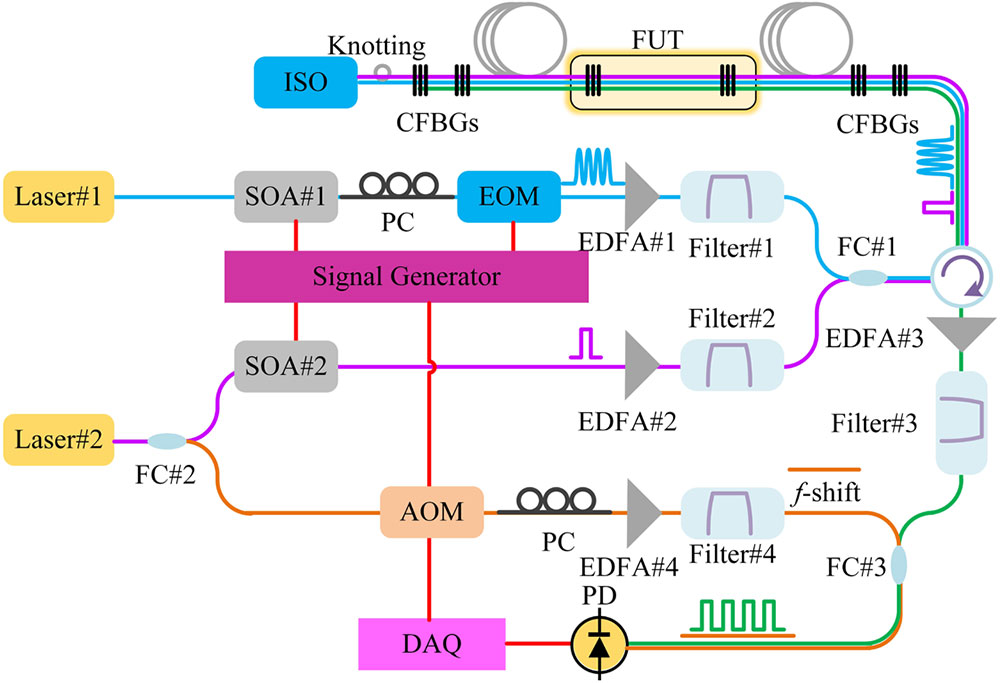
    Figure 1.Experimental setup of the coherent-detection-based distributed acoustic impedance sensing system enabled by a grating array. SOA, semiconductor optical amplifier; EOM, electro-optic modulator; EDFA, erbium-doped optical fiber amplifier; FC, fiber coupler; CFBGs, chirped fiber Bragg gratings; FUT, fiber under test; ISO, isolator; AOM, acousto-optic modulator; PC, polarization controller; PD, photodetector; DAQ, data acquisition card.

    Partial temporal waveform of the excitation and probe pulses, presenting 10-ns guard interval.

    Figure 2.Partial temporal waveform of the excitation and probe pulses, presenting 10-ns guard interval.

    To recover the distributed refractive index modulation depth, the amplitudes of at least three spectral peaks corresponding to p=0, p=1, and p=2 need to be obtained by performing FFT on the acquired time-domain beat signal. Table 1 lists the beat frequencies corresponding to p=0,±1,2 for R0,m modes with orders from 9 to 13, when the frequency shift at the AOM is set at fLO=200  MHz. In SMFs, the excitation efficiency of an acoustic mode depends on the spatial overlap between the fundamental optical mode field and the acoustic mode field [22]. In the SMF we use, R0,m modes with mode orders from 9 to 13 present relatively high excitation efficiency. By using a mode with larger intervals between beat frequency components, it would be easier to differentiate them and measure the amplitudes with less influence from neighboring components. Comparing the beat frequency components of each R0,m, those of R0,12 present the largest intervals, considering the 1-GHz bandwidth of DAQ.

    Beat Frequencies Corresponding to p=0,±1,2 for R0,9 to R0,13 Modes with fLO = 200 MHza

    Sideband OrderBeat Frequency (MHz)
    pR0,9R0,10R0,11R0,12R0,13
    0200.00200.00200.00200.00200.00
    1218.02265.88313.72361.56409.40
    -1618.02665.88713.72761.56809.40
    2636.04731.76827.44923.12

    The resonance frequencies of the R0,m modes with orders from 9 to 13 are 418.02 MHz, 465.88 MHz, 513.72 MHz, 561.56 MHz, and 609.40 MHz, respectively.

    With vF and fLO set at 561.56 MHz and 200 MHz, respectively, Fig. 3 shows the waveform and normalized spectrum of a beat signal segment corresponding to the sensing signal generated by one CFBG. The signal segment lasts for 50 ns, which is in accordance with the 5-m CFBG spacing. The average powers of the excitation pulse and probe pulse are set at 10 dBm and 15  dBm, respectively. The average power of the sensing signal at the input of the PD is 0 dBm. As shown in Figs. 3(a) and 3(b), when the excitation pulse is turned off, the beat signal contains only a 200-MHz frequency component, which is determined by the frequency shift fLO and corresponds to p=0. When the excitation pulse is turned on, the waveform in Fig. 4(a) clearly exhibits new frequencies generated by FSBS. In the spectrum in Fig. 4(b), the beat frequency components at 351.56 MHz, 761.56 MHz, and 923.12 MHz are identified, which correspond to p=±1,2.

    (a) Beat signal segment and (b) normalized spectrum corresponding to a sensing fiber section between two CFBGs, when the excitation pulse is turned off.

    Figure 3.(a) Beat signal segment and (b) normalized spectrum corresponding to a sensing fiber section between two CFBGs, when the excitation pulse is turned off.

    (a) Beat signal segment and (b) normalized spectrum corresponding to a sensing fiber section between two CFBGs, when the excitation pulse is turned on.

    Figure 4.(a) Beat signal segment and (b) normalized spectrum corresponding to a sensing fiber section between two CFBGs, when the excitation pulse is turned on.

    For comparison, a 600-m standard SMF is used to obtain the Rayleigh backscattering of the probe signal. To create a region with different environmental acoustic impedance, the coating of the fiber section between 317 m and 341 m is stripped. The sensing system is the same as that depicted by Fig. 1, except that the settings of the EDFAs are reconfigured to provide higher output power, so that the Rayleigh backscattering signal is strong enough for the detection. The average powers of the excitation and probe pulses are set at 10 dBm and 1  dBm, respectively. Theoretically, the phase modulation induced by FSBS also exists in the Rayleigh backscattering. However, as shown in Fig. 5(a), the SNR of the sensing signal is much lower as compared to that generated by CFBG reflection, which is attributed to the weak and random nature of Rayleigh backscattering. Due to the use of a coherent probe pulse, coherent noise is introduced into the sensing system, and the measurement of local power levels becomes unreliable. To weaken the influence of coherent noise, some methods are proposed, such as averaging the traces collected by probe pulses with varying frequencies [13]. However, it complicates the measurement setup and increases the time required for acquisition and processing of the sensing signal. In contrast, the weak CFBG array provides stable reflection points with constant and enhanced reflectivity, eliminating the requirement for a large number of repeated measurements.

    (a) Beat signal of Rayleigh scattering as the excitation pulse is turned on and (b) frequency-domain diagram. (c) Part of the beat signal and (d) its corresponding frequency-domain diagram.

    Figure 5.(a) Beat signal of Rayleigh scattering as the excitation pulse is turned on and (b) frequency-domain diagram. (c) Part of the beat signal and (d) its corresponding frequency-domain diagram.

    Figure 5(b) shows the FFT result of the time-domain signal corresponding to the entire sensing fiber. The beat frequency components at 351.56 MHz, 761.56 MHz, and 923.12 MHz can also be identified, but with severely degraded quality. Furthermore, if we look at the FFT of a signal segment corresponding to a 5-m fiber section, as shown in Figs. 5(c) and 5(d), even the frequency components corresponding to p=±1 do not present similar amplitudes, indicating that any quantitative analysis based on the Rayleigh backscattering signal would be impossible.

    Figure 6 shows the waveform of the beat signal generated by the sensing signal from the entire CFBG array. To facilitate the subsequent signal processing, the beat signal is divided into 100 segments, each containing a single beat pulse from a CFBG, as indicated by the different colors. It is observed that the amplitudes of the beat pulses are not uniform, which is attributed to the polarization fading effect along the fiber. Since the calculation of additional phase factor ξ(vF,zr) is performed based on the relative amplitudes of three spectral peaks corresponding to p=0,1,2, the variation of the pulse amplitudes does not affect the recovery of the distributed phase modulation depth.

    Beat pulses generated by the entire sensing fiber.

    Figure 6.Beat pulses generated by the entire sensing fiber.

    To validate the capability of the CFBG-array-enabled distributed acoustic impedance sensing, the coating of the fiber section between 310 m and 315 m is stripped. As the acoustic impedance mismatch between silica and air is much larger than that between silica and the polymer coating, the induced acoustic mode would be stronger, leading to more intense phase modulation at this fiber section, which should be revealed in the evolution of additional phase factor ξ(vF,zr). Figure 7 shows the FFT results of the beat pulses. ξ(vF,zr) can then be calculated by extracting the amplitudes of the frequency components at 200 MHz, 361.56 MHz, and 923.12 MHz, which correspond to p=0,1,2, respectively. Figure 8 shows the evolution of amplitudes of frequency components versus fiber length, which are proportional to J0[ξ(vF,zr)], J1[ξ(vF,zr)], and J2[ξ(vF,zr)]. The trends of the three curves loosely follow those of the Bessel functions of orders 0, 1, 2. Large variations are observed due to polarization fading in the sensing fiber. Nevertheless, the calculation of ξ(vF,zr) relies only on the relative amplitudes of K0, K1, and K2. The noise can be further suppressed after 200 times of averaging, and the phase jump at the fiber section between 310 m and 315 m is clearly revealed, as shown in Fig. 9(a). By taking the difference of additional phase factor Δξ(zr)=ξ(vF,zr)ξ(vF,zrΔz) with respect to the grating spacing Δz of 5 m, a phase jump is identified at the fiber section from 310 m to 315 m, as shown in Fig. 9(b). It is confirmed that locating abnormal acoustic impedance can be achieved in the proposed distributed sensing system.

    Spectra of beat pulses from the entire sensing fiber.

    Figure 7.Spectra of beat pulses from the entire sensing fiber.

    Evolution of amplitudes of frequency components at pΩF−ωLO(p=0,1,2) along the fiber.

    Figure 8.Evolution of amplitudes of frequency components at pΩFωLO(p=0,1,2) along the fiber.

    (a) Averaged additional phase factor ξ(zr) and (b) difference of additional phase factor Δξ(zr) along the fiber.

    Figure 9.(a) Averaged additional phase factor ξ(zr) and (b) difference of additional phase factor Δξ(zr) along the fiber.

    Distributed measurement of the environmental acoustic impedance is then demonstrated by sweeping the modulation frequency vF and reconstructing the FSBS spectra. According to Eq. (6), the refractive index modulation depth αRI can be calculated from Δξ(zr). By taking the values of αRI at different modulation frequencies, the FSBS spectrum of the sensing fiber between two adjacent CFBGs can be reconstructed. Therefore, the distributed FSBS spectra of the sensing fiber can be obtained using the CFBG array. Figure 10(a) presents the evolution of FSBS spectra along the sensing fiber when it is placed in air. In accordance with the previous analysis, the acoustic mode at the stripped fiber section from 310 m to 315 m is much stronger than that in the coated fiber. The corresponding FSBS spectrum is plotted in Fig. 11(a), presenting a full-width-at-half-maximum (FWHM) spectral width of νFWHM,a=3.87  MHz, by fitting to a Lorentzian shape. The value is much larger than that obtained with CW light [12], which is attributed to insufficient acoustic mode excitation due to the use of a short pulse [23]. The actual spectral width can be calculated by the excitation pulse width and the measured νFWHM,a [23], and the corrected value is νa=0.56  MHz. Taking this spectral width as a reference, the acoustic reflectivity coefficient |r| at the cladding–surrounding interface can be calculated from νm=νa+Vdπdln1|r|,where νm is the spectral width measured with the fiber section immersed in the liquid under test, Vd is the velocity of the longitudinal acoustic wave in silica, and d is the fiber diameter. From |r|, the environmental acoustic impedance can be obtained using |r|=|ZfZoZf+Zo|,where Zf and Zo are the acoustic impedance of the fiber material and the surrounding, respectively.

    Distributed FSBS spectra when the stripped fiber section is placed in (a) air, (b) anhydrous ethanol, and (c) water.

    Figure 10.Distributed FSBS spectra when the stripped fiber section is placed in (a) air, (b) anhydrous ethanol, and (c) water.

    FSBS spectra of the stripped fiber section when it is placed in (a) air, (b) anhydrous ethanol, and (c) water.

    Figure 11.FSBS spectra of the stripped fiber section when it is placed in (a) air, (b) anhydrous ethanol, and (c) water.

    Immersing the stripped fiber section in anhydrous ethanol, the distributed FSBS spectra are reconstructed and plotted in Fig. 10(b), and the FSBS spectrum at the corresponding location is plotted in Fig. 11(b). By fitting to a Lorentzian shape, the FWHM spectral width is found to be νFWHM,e=5.01  MHz, and the corrected value is νm,e=2.63  MHz. By substituting the values into Eq. (7) and Eq. (8) together with Vd=5996  m/s, d=125  μm, νa=0.56  MHz, and Zf=13.1×10⁶  kg·m2·s1, the acoustic impedance of anhydrous ethanol is calculated to be 0.89×10⁶  kg·m2·s1. Replacing the anhydrous ethanol with water, the distributed FSBS spectra are reconstructed and plotted in Fig. 10(c), and the FSBS spectrum at the corresponding location is plotted in Fig. 11(c). The FWHM spectral width becomes νFWHM,w=6.05  MHz, and the corrected value is νm,w=4.03  MHz. The acoustic impedance of water is thus calculated to be 1.48×10⁶kg·m2·s1. Neither result deviates much from the reference values [18], which are 0.93×10⁶  kg·m2·s1 and 1.483×10⁶  kg·m2·s1, respectively.

    4. CONCLUSION AND DISCUSSION

    In this work, a distributed acoustic impedance sensing system is demonstrated based on FSBS and coherent detection. By adopting a CFBG array, a backward-propagating sensing signal with notably improved SNR is generated, enabling the measurement of phase modulation depth and thus the refractive index modulation depth along the sensing fiber, which is induced by a specifically excited R0,m mode. By reconstructing the distributed FSBS spectra, the environmental acoustic impedance along the fiber is obtained. Due to the use of coherent detection instead of BSBS-based detection, only one round of frequency sweep is required, leading to significantly accelerated signal acquisition and simplified post-processing. The proposed distributed sensor has experimentally achieved 5-m spatial resolution over 500-m sensing distance.

    Since the time-domain sensing signals are transformed into frequency-domain signals for processing, the spectral resolution needs to be small enough so that the different spectral peaks can be differentiated. Therefore, the pulse width of the probe cannot be too short, which limits the spatial resolution of the system. In other words, even though in practice, the grating spacing corresponds to the spatial resolution of the sensing system, it is not what restricts the spatial resolution. To improve spatial resolution, wavelength-division multiplexed CFBGs can be incorporated into the time-division multiplexed array [24], facilitating a hybridly multiplexed sensing system.

    In a CFBG array, the signal crosstalk generated by multiple reflections scales up as the number of gratings increases. Such crosstalk will eventually affect the SNR of the sensing signal, especially that at the end of the fiber. However, due to the low reflectivity of the CFBGs (37  dB), the crosstalk is as low as 60  dB even when 560 CFBGs are multiplexed [25]. Considering 5-m grating spacing, it would be fair to state that sensing distance of 2800 m can be achieved with negligible signal crosstalk.

    Currently, the inscription of FBGs in SMFs has been demonstrated using the phase-mask method [26] and point-by-point fabrication using femtosecond lasers [27]. However, this specialty fiber is still almost commercially unavailable, which could be a demerit of the proposed method.

    References

    [1] X. Bao, L. Chen. Recent progress in distributed fiber optic sensors. Sensors, 12, 8601-8639(2012).

    [2] A. H. Hartog. An Introduction to Distributed Optical Fibre Sensors(2017).

    [3] P. Lu, N. Lalam, M. Badar, B. Liu, B. T. Chorpening, M. P. Buric, P. R. Ohodnicki. Distributed optical fiber sensing: review and perspective. Appl. Phys. Rev., 6, 041302(2019).

    [4] X. Bao, Y. Wang. Recent advancements in Rayleigh scattering-based distributed fiber sensors. Adv. Devices Instrum., 2021, 8696571(2021).

    [5] X. Bao, Z. Zhou, Y. Wang. Review: distributed time-domain sensors based on Brillouin scattering and FWM enhanced SBS for temperature, strain and acoustic wave detection. PhotoniX, 2, 14(2021).

    [6] Z. Ding, K. Sun, K. Liu, J. Jiang, D. Yang, Z. Yu, J. Li, T. Liu. Distributed refractive index sensing based on tapered fibers in optical frequency domain reflectometry. Opt. Express, 26, 13042-13054(2018).

    [7] P. Xu, X. Yu, Z. Chen, L. Sheng, J. Liu, S. Zhou, K. Wen, O. Xu, X. Dong, J. Yang, Y. Qin. Distributed refractive index sensing based on bending-induced multimodal interference and Rayleigh backscattering spectrum. Opt. Express, 29, 21530-21538(2021).

    [8] C. Gong, Y. Gong, X. Zhao, Y. Luo, Q. Chen, X. Tan, Y. Wu, X. Fan, G. D. Peng, Y. J. Rao. Distributed fibre optofluidic laser for chip-scale arrayed biochemical sensing. Lab Chip, 18, 2741-2748(2018).

    [9] Y. Antman, A. Clain, Y. London, A. Zadok. Optomechanical sensing of liquids outside standard fibers using forward stimulated Brillouin scattering. Optica, 3, 510-516(2016).

    [10] N. Hayashi, Y. Mizuno, K. Nakamura, S. Y. Set, S. Yamashita. Experimental study on depolarized GAWBS spectrum for optomechanical sensing of liquids outside standard fibers. Opt. Express, 25, 2239-2244(2017).

    [11] D. M. Chow, L. Thévenaz. Forward Brillouin scattering acoustic impedance sensor using thin polyimide-coated fiber. Opt. Lett., 43, 5467-5470(2018).

    [12] Z. Zheng, Z. Li, X. Fu, L. Wang, H. Wang. Multipoint acoustic impedance sensing based on frequency-division multiplexed forward stimulated Brillouin scattering. Opt. Lett., 45, 4523-4526(2020).

    [13] G. Bashan, H. H. Diamandi, Y. London, E. Preter, A. Zadok. Optomechanical time-domain reflectometry. Nat. Commun., 9, 2991(2018).

    [14] H. H. Diamandi, Y. London, G. Bashan, A. Zadok. Distributed opto-mechanical analysis of liquids outside standard fibers coated with polyimide. APL Photon., 4, 016105(2019).

    [15] C. Pang, Z. Hua, D. Zhou, H. Zhang, L. Chen, X. Bao, Y. Dong. Opto-mechanical time-domain analysis based on coherent forward stimulated Brillouin scattering probing. Optica, 7, 176-184(2020).

    [16] Z. Hua, D. Ba, D. Zhou, Y. Li, Y. Wang, X. Bao, Y. Dong. Non-destructive and distributed measurement of optical fiber diameter with nanometer resolution based on coherent forward stimulated Brillouin scattering. Light Adv. Manuf., 2, 25(2021).

    [17] Y. K. Dong, Z. Hua, D. Ba, Y. Li. Polarization separation assisted opto-mechanical time-domain analysis with sub-meter resolution. Opt. Lett., 46, 5886-5889(2021).

    [18] D. M. Chow, Z. Yang, M. A. Soto, L. Thevenaz. Distributed forward Brillouin sensor based on local light phase recovery. Nat. Commun., 9, 2990(2018).

    [19] S. Zaslawski, Z. Yang, S. Wang, L. Thévenaz. Distributed forward stimulated Brillouin scattering measurement using broadband BOTDR. Proc. SPIE, 11199, 1119923(2019).

    [20] X. Fu, J. Wu, Z. Li, Y. Tong, X. Gui, H. Wang. Fiber-based large dynamic range vibration sensing with dual-wavelength phase unwrapping. J. Lightwave Technol., 37, 6090-6096(2019).

    [21] J. Wang, Z. Li, X. Fu, X. Gui, J. Zhan, H. Wang, D. Jiang. High-sensing-resolution distributed hot spot detection system implemented by a relaxed pulsewidth. Opt. Express, 28, 16045-16056(2020).

    [22] R. M. Shelby, M. D. Levenson, P. W. Bayer. Guided acoustic-wave Brillouin scattering. Phys. Rev. B, 31, 5244-5252(1985).

    [23] M. Alem, M. A. Soto, M. Tur, L. Thévenaz. Analytical expression and experimental validation of the Brillouin gain spectral broadening at any sensing spatial resolution. 25th Optical Fiber Sensors Conference (OFS), 1-4(2017).

    [24] Y. Ou, C. Zhou, L. Qian, D. Fan, C. Cheng, H. Guo, Z. Xiong. Large WDM FBG sensor network based on frequency-shifted interferometry. IEEE Photon. Technol. Lett., 29, 535-538(2017).

    [25] J. Wu, Z. Li, X. Fu, M. Fan, X. Gui, H. Wang. High dynamic range distributed acoustic sensing based on dual-wavelength fiber Bragg grating pairs. Opt. Lett., 46, 4402-4405(2021).

    [26] H. Guo, J. Tang, X. Li, Y. Zheng, H. Yu, H. Yu. On-line writing identical and weak fiber Bragg grating arrays. Chin. Opt. Lett., 11, 030602(2013).

    [27] B. Xu, J. He, B. Du, X. Xiao, X. Xu, C. Fu, J. He, C. Liao, Y. Wang. Femtosecond laser point-by-point inscription of an ultra-weak fiber Bragg grating array for distributed high-temperature sensing. Opt. Express, 29, 32615-32626(2021).

    Zhou Zheng, Zhengying Li, Xuelei Fu, Xin Gui. Coherent-detection-based distributed acoustic impedance sensing enabled by a chirped fiber Bragg grating array[J]. Photonics Research, 2022, 10(6): 1325
    Download Citation