
Lin Wang, Xi Xiao, Lu Xu, Yifan Liu, Yu Chen, Yuan Yu, Xinliang Zhang. On-chip tunable parity‐time symmetric optoelectronic oscillator[J]. Advanced Photonics Nexus, 2023, 2(1): 016004
- Advanced Photonics Nexus
- Vol. 2, Issue 1, 016004 (2023)
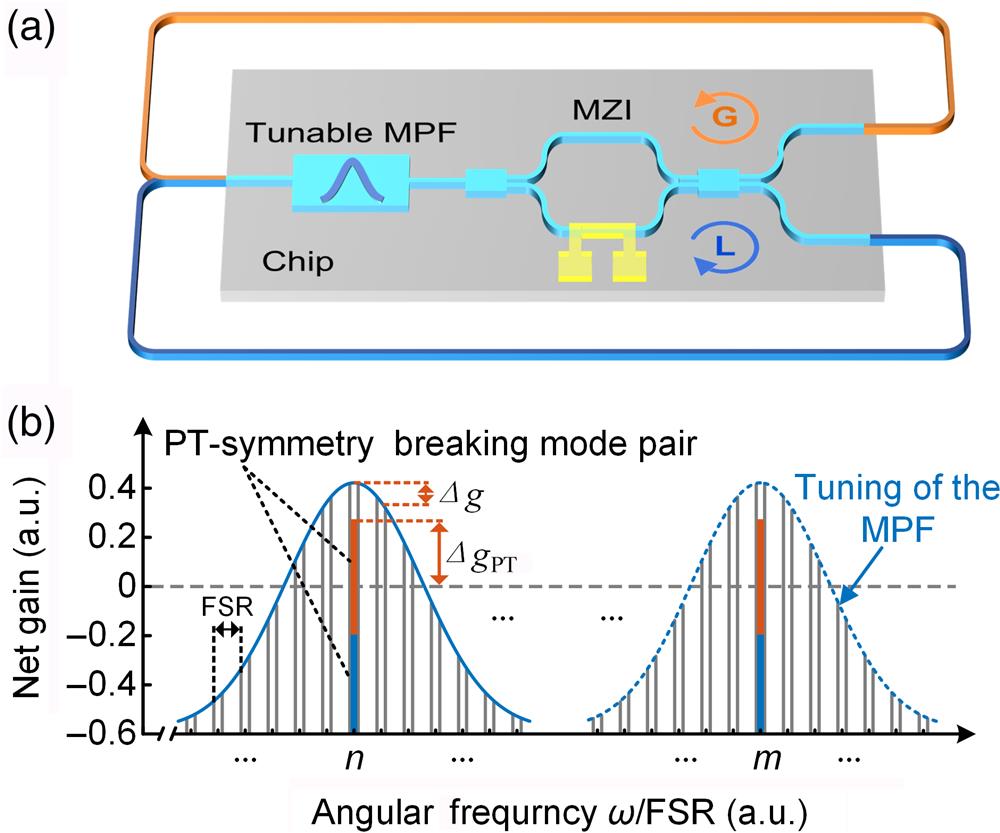
Fig. 1. (a) Schematic diagram and (b) mode selection principle of the on-chip tunable PT‐symmetric OEO. MPF, microwave photonic filter; MZI, Mach–Zehnder interferometer; FSR, free spectral range.
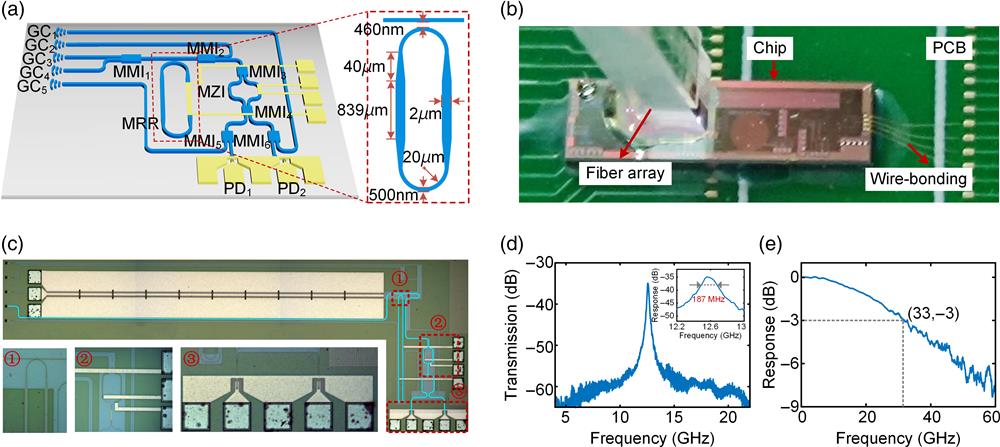
Fig. 2. Tunable PT-symmetric OEO chip. (a) Schematic diagrams of the designed Si photonic chip and MRR; (b) image of the packaged chip; (c) micrograph of the fabricated chip with false color. The inset is a zoomed-in view of key components: ① coupling region of the MRR, ② MZI, and ③ two PDs. (d) Measured amplitude frequency response of the MRR-based MPF. The inset is the zoomed-in view of the microwave passband. (e) Measured frequency response of the PD. GC, grating coupler; MMI, multimode interferometer; MRR, microring resonator; PD, photodetector; PCB, printed circuit board.
Fig. 3. (a) Experimental setup of the tunable PT‐symmetric OEO; (b) measured open‐loop amplitude frequency response of the tunable PT‐symmetric OEO. The inset shows the comparison between the zoomed‐in views of the open‐loop gain spectrum (blue solid curve) and the gain spectrum under PT-symmetry breaking (red dashed curve). (c) When only the MPF is applied to the OEO, the measured electrical spectrum has a span of 1 GHz and an RBW of 3 MHz. The inset shows a zoomed‐in view of the electrical spectrum with a span of 20 MHz and an RBW of 50 kHz. (d) When the MPF and PT-symmetry breaking are combined to be used in the OEO, the measured electrical spectrum has a span of 1 GHz and an RBW of 3 MHz. The inset shows a zoomed‐in view of the electrical spectrum with a span of 100 MHz and an RBW of 300 kHz. (e) The electrical spectra of single‐mode oscillation (blue solid curve) and multimode oscillation (red dashed curve) with a span of 10 MHz and an RBW of 50 kHz. TLS, tunable laser source; PC, polarization controller; PM, phase modulator; EDFA, erbium doped fiber amplifier; DUT, device under test; EC, electrical combiner; EA, electrical amplifier; PS, power splitter; ESA, electrical spectrum analyzer.
Fig. 4. (a) Frequency tunability of the proposed PT-symmetric OEO; (b) measured phase noises when the oscillation frequencies are 4.97 GHz (red dashed curve) and 13.67 GHz (blue solid curve), respectively; (c) measured frequency drift within 1 min at an oscillation frequency of 3.52 GHz.
|
Table 1. Comparison of OEOs based on different architectures.

Set citation alerts for the article
Please enter your email address
© Copyright 2018-2021 | Chinese Laser Press. All Rights Reserved 沪ICP备15018463号-20