
Hua Li, Zhengyi Hao, Jiangfeng Huang, Tingting Lu, Qian Liu, Ling Fu. 500 μm field-of-view probe-based confocal microendoscope for large-area visualization in the gastrointestinal tract[J]. Photonics Research, 2021, 9(9): 1829
- Photonics Research
- Vol. 9, Issue 9, 1829 (2021)
Abstract
1. INTRODUCTION
The invention of the microscope provided us with the possibility of studying matter more precisely. Optical microscopes with micrometer-level resolution have become indispensable tools in the field of life sciences. For digestive tract cancers with high incidence and mortality, endoscopic imaging at cell resolution improves the early detection rate of cancer, increasing the five-year survival rate. Confocal microendoscopy (CM) can provide high-magnification and high-resolution images of the mucosal layer of the gastrointestinal tract—that is, it presents
Probe-based confocal microendoscopy (pCM) achieves proximal scanning using a flexible fiber bundle for light guidance [1], providing real-time cellular images that are widely used in the detection of Barrett’s esophagus [2], gastrointestinal metaplasia [3], ulcerated colitis [4], and other diseases [5,6]. However, the pCM systems currently in use generally have a field-of-view (FOV) of only 240–300 μm at a resolution of 1–2 μm [7,8]. The tissue information shown in a single frame is limited, making it a time-consuming process and impractical for medical inspections of larger lesion areas. Imaging of limited lesion areas can easily result in a false-negative diagnosis. Although systems with a larger FOV have been used for basic research [9,10], the unclear cell observation caused by low resolution remains a challenge. Conversely, sub-millimeter FOV cellular resolution imaging helps to quickly locate diseased areas and improves the accuracy of targeted biopsies.
Generally, for a given optical imaging system, based on the Lagrange–Helmholtz invariant , the product of the refractive index , aperture angle , and object height is constant [11]. Here, and determine the numerical aperture (NA) of the system; that is, , which determines its resolution. The object height determines the system’s FOV. Consequently, there is a trade-off between the resolution and FOV of an optical imaging system, and it is challenging to enhance the FOV while maintaining cell resolution. In recent years, several methods have been explored to bridge the gap between single cells and large tissue regions. Image stitching is a method of reconstructing large-area images from multiple high-resolution images with small FOVs [12,13]. Regardless of the time required, an FOV of tens or even hundreds of millimeters can be obtained using this method. However, it is not suitable for real-time imaging owing to its hard registration and low speed. Fourier ptychographic microscopy (FPM) can obtain high-resolution images through Fourier-domain post-processing using multiple low-resolution images with large FOVs [14,15]. Angle-varied illumination from a light-emitting diode (LED) array is required for Fourier spectrum scanning of an object in the spatial frequency domain and static samples are required in FPM, but this cannot be achieved for
Sign up for Photonics Research TOC. Get the latest issue of Photonics Research delivered right to you!Sign up now
As endoscopic imaging uses fibers or fiber bundles for light transmission, none of the preceding methods are appropriate ways of increasing the FOV. In pCM, a possible solution is to expand the field stop of the fiber-optic imaging probe, which is either a fiber bundle with a millimeter image circle diameter or a miniature objective lens. In this study, we developed for the first time, to our knowledge, a confocal microendoscope with an FOV diameter of over 500 μm that is comparable to the imaging FOV of the NA objective lens of the Zeiss Axio Observer, a resolution of 1.95 μm that is high enough to resolve a single cell in tissues, and a 2.6 mm outer diameter fiber-optic probe that is compatible with conventional endoscopic biopsy channels. Compared with conventional pCM, our confocal microendoscope increased the FOV by a factor of 4, showing more tissue information at a cellular level in a single view. This is beneficial for obtaining a complete view through mosaicking, and provides a potentially powerful clinical tool for rapid and accurate assessment of gastrointestinal tract lesions. An increased field stop and a custom-designed optical system were used to significantly enhance the FOV at cellular resolution. In this study, an optical design software was used to simulate and optimize the relay system to correct system aberration. In addition, a miniature objective lens with a magnification of was designed and fabricated to achieve cellular resolution over the full FOV. Finally, we discuss the performance of the system in detail, both theoretically and experimentally, and demonstrate its practicability by
2. OPTICAL DESIGN
A. Optical Design of the Relay System
In pCM, increasing the field stop is an effective way to increase the imaging FOV. The clear aperture of a miniature objective lens is usually larger than that of the fiber bundle, which is equivalent to the field stop of the system. Increasing the image circle diameter of the fiber bundle can increase the field stop. Usually, the diffraction limit resolution value of the miniature objective lens is less than the core distance of the fiber bundle to ensure the cellular resolution. Thus, the FOV and sampling resolution of the system are not only affected by the fiber bundle diameter and core distance, but also by the magnification of the miniature objective lens. This is shown by
Consequently, the pCM FOV and resolution are mutually restricted when the field stop is determined. To distinguish cells clearly, the imaging resolution should be 1–2 μm. Thus, increasing the image circle diameter of the fiber bundle is feasible for large-FOV imaging.
As the imaging FOV increases, the scanning FOV of the coupling objective lens before the fibers must be increased, resulting in severe off-axis aberration and poor image quality. The magnitude of the wave aberration can be used to evaluate image formation. For a given rotationally symmetrical optical imaging system, the wave aberration function caused by five primary aberrations depends on the image height and pupil coordinates . This is shown as [19]
The scanning FOV is determined by the focal length of the objective lens and the scanning angle at the back aperture of the objective lens [20] is
The simulation and optimization of a relay system based on available commercial lenses were performed using Zemax. The relay lens system, composed of two identical doublet lenses, is simple in structure and easy to implement, the symmetrical structure being helpful for aberration correction. In our system, the relay lens system is a symmetrical structure composed of two doublet achromatic lenses (#49285 INK, Edmund) with a diameter of 50 mm and a focal length of 150 mm. The coupling objective lens was replaced by a paraxial lens with a focal length of 9 mm. The optical schematic diagram refers to Appendix A. The optimization was performed with half the maximum scanning angle of 8.6° before the relay lens system, and a Gaussian beam diameter of 5 mm at 488 nm. To achieve diffraction-limited performance, the RMS spot sizes of the relay system should be smaller than the Airy disk spot size. The modulation transfer function (MTF) values should be greater than 0.5, when the spatial frequency of the fiber space is 132 lp/mm [22,23]. In addition, the maximum values of field curvature, astigmatism, and distortion should be within an acceptable range to ensure that the image surface is flat without significant distortion.
The performance analysis of the relay system is shown in Fig. 1. The RMS spot radii of the full FOV were smaller than the Airy spot radius and 2 μm single fiber radius, as shown in Fig. 1(a). Figure 1(b) shows the MTF curves in the tangential and sagittal planes for four different image positions along the radial direction: on axis, 0.5 field, 0.707 field, and full field. Even the worst value, the MTF value of the tangential plane of the full field, was greater than 0.6 at 132 lp/mm, which fully meets the design requirements of the MTF values. Figure 1(c) shows the field curvature plots in the image space. The maximum field curvature and astigmatism at the edge of the field are 11 and 6.6 μm, respectively. The maximum distortion at the edge of the field was 0.02%, as shown in Fig. 1(d), which is acceptable to the human eye. These results show that the relay system can effectively correct the lens aberrations.
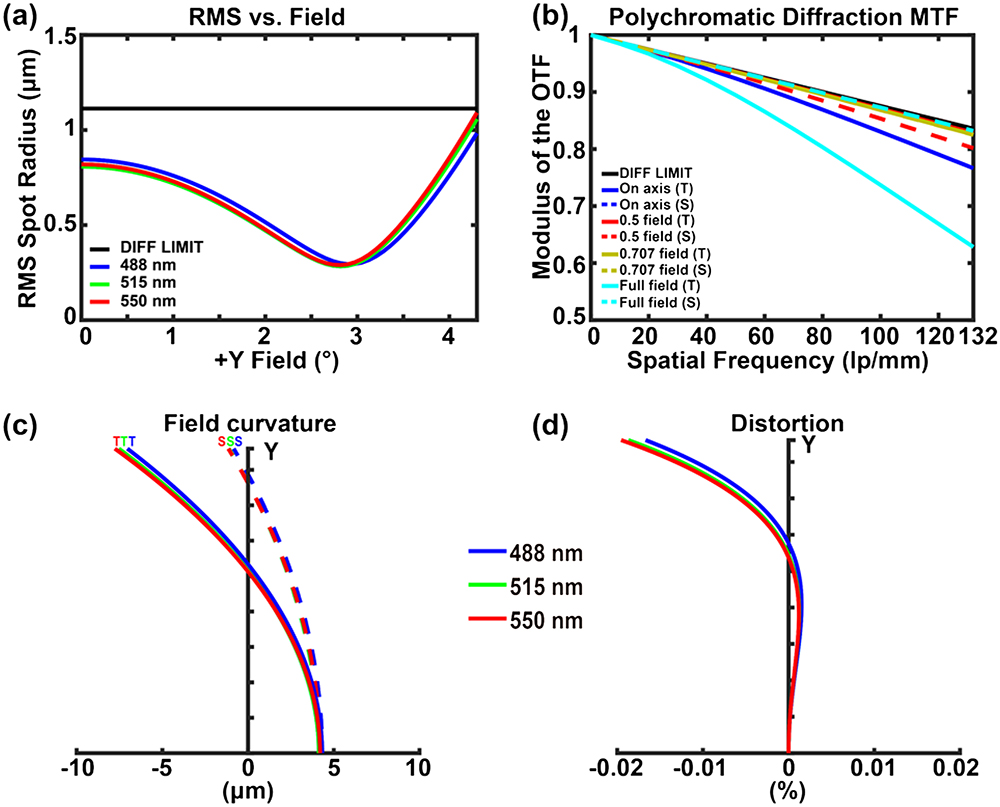
Figure 1.Relay system performance analysis. (a) RMS spot radius as a function of field (incident degree). The black line indicates the diffraction limit. (b) MTF plot in image space. (c) and (d) Predicted field curvature and distortion plots in image space, respectively. T, tangential plane; S, sagittal plane.
B. Large-FOV Miniature Objective Lens
A miniature objective lens at the end of the fiber probe can focus the incident laser from the fiber onto the tissue while allowing the fluorescence signal to be collected by the same fiber. The effective clear aperture of the miniature objective lens should not be less than that of the fiber bundle to ensure that the FOV of the system is not limited by the lens. According to Eq. (2), a miniature objective lens with appropriate magnification is essential to ensure a resolution of 1–2 μm in the system, and because the system resolution is limited by the distance between the neighboring fiber cores, the NA of the miniature objective lens in the object space should be . Considering that the refractive index of tissue is similar to that of water, the object space of the miniature objective lens should be set to be that of water immersion. Additionally, as the miniature objective lens is connected to the relay system through the fiber bundle, its NA in the image space should match the 0.25–0.3 NA of the illumination and collection fibers [24]. Similarly, the RMS spot size and MTF value in the image space of the miniature objective lens must be consistent with those of the relay system.
The clear aperture of the miniature objective lens was 1.8 mm, which met the requirement that the FOV of the pCM be limited only to the image circle diameter of the fiber bundle. The NA in the object space was 0.52, which ensured the FOV and resolution of the system. For more details of the design requirements and lens parameters, please refer to Appendix B. The layout of the large-FOV miniature objective lens with six elements is shown in Fig. 2. To realize the effective reduction of the RMS spot size, a plano-convex lens using a high-refractive-index material (H-LAF50B) was used as the first lens of the miniature objective lens to directly contact the tissues. Element 2 is a convex lens made of glass H-LAK3, which works with Element 1 to limit the light beam to the effective clear aperture of the miniature objective lens. Element 3 is a doublet lens that is used to correct chromatic aberration. The remaining three lenses were used to correct residual aberrations. The last element was designed as an aspheric lens, which could be used to correct global spherical aberration.
![]()
Figure 2.Schematic diagram of the large-FOV miniature objective lens.
The performance analysis of the large-FOV miniature objective lens is shown in Figs. 3–5. Figure 3 shows the spot diagrams with a diffraction-limited Airy disk for six radial image positions. The RMS spot radii were close to the Airy disk spot radius of 1.272 μm, and the maximum RMS spot radius of 1.778 μm was less than 2 μm.
![]()
Figure 3.Spot diagrams with diffraction-limited Airy disks for six radial image positions. The Airy disk spot radius is 1.272 μm.
![]()
Figure 4.(a) Polychromatic diffraction MTFs plot and (b) chromatic focal shift in fiber bundle space of the large-FOV miniature objective lens. DIFF LIMIT, diffraction limit; T, tangential plane; S, sagittal plane.
![]()
Figure 5.Predicted (a) field curvature and (b) distortion plots in fiber bundle space of the large-FOV miniature objective lens.
Figure 4(a) presents the MTF curves for four different positions. The MTF values at 132 lp/mm were greater than 0.6 for the eight MTF curves, indicating the high contrast of the large-FOV miniature objective lens. Figure 4(b) shows the chromatic focal shift in the fiber bundle space. The maximum focal shift is 14.52 μm, which is slightly greater than the diffraction-limited range of 8.45 μm. Based on the correspondence between object space and image space [25], the maximum focal shift of the object space was calculated to be 3.99 μm, which was less than the axial resolution of the confocal microendoscope [24]. Therefore, the chromatic focal shift of the miniature objective lens would not affect the imaging capability of the confocal microendoscope. Figure 5 presents the field curvature and distortion plots in the fiber bundle space. The maximum field curvature and astigmatism in Fig. 5(a) are 9.03 and 10.53 μm, respectively, which are 2.48 and 2.89 μm in object space. The maximum distortion in Fig. 5(b) is 1.25%, which is less than the distortion range that can be distinguished by the human eye. For more performance evaluation results, please refer to Appendix C.
The performance analysis results show that the large-FOV miniature objective lens effectively corrected these three aberrations to meet the design requirements. We also performed tolerance and Monte Carlo analyses for the design (see Appendix D). The outer diameters of all lenses were 2.2 mm to facilitate assembly. Based on this design, a miniature objective lens with a magnification of , outer diameter of 2.6 mm, and length of 11.2 mm was manufactured and assembled, which is flexible enough to get through a working channel of a commercial gastrointestinal endoscope. Figure 6(a) shows an image of a large-FOV miniature objective lens placed next to a 50-cent coin. A standard 1951 United States Air Force (USAF) target was used for lateral resolution testing, as shown in Fig. 6(b). The large-FOV miniature objective lens could resolve features separated by 0.775 μm, as shown in the enlarged red box. The vertical and horizontal MTF curves were calculated using the slanted-edge method and the MATLAB program [21,26], and compared with the diffraction limit MTF curve shown in Fig. 6(c), which showed that the MTF at 132 lp/mm was greater than 0.5, again meeting the design requirements.
![]()
Figure 6.Photographs of the large-FOV miniature objective lens and testing results. (a) Large-FOV miniature objective lens placed next to a Chinese 50-cent coin for perspective. (b) Testing results of resolution. (c) Calculated MTF curves from (b).
3. LARGE-FOV pCM AND IMAGING PERFORMANCE
A. Large-FOV pCM Setup
The schematic of the large-FOV pCM system is similar to that of our previous visible pCM system [8,21,27] (see Appendix E). The excitation light of wavelength 488 nm (OBIS 488 LX, Coherent) passed through the beam expander and was then reflected using a dichroic mirror (DM, Di03-R488-t1-, Semrock). A two-dimensional scanner (CRS, Cambridge, 6215 H, Cambridge) was used to scan the beam, which was then relayed into the back aperture of the objective lens (UMPLANFL N , Olympus) to focus on the end face of the fiber bundle. A miniature objective lens at the distal end of the fiber bundle focused the beam onto the tissues while collecting the fluorescent signal. The fluorescence returned along the same path and passed through a dichroic mirror and filter (FF02-525/40-25, Semrock). Finally, the fluorescence was focused using a condenser through a pinhole and collected by a PMT (R3896, Hamamatsu). In image processing, based on the blind calibration algorithm [28], the honeycomb structure caused by the fiber bundle was eliminated by Delaunay triangulations to obtain a good visualization. The imaging speed of the system is 4.3 fps (frames per second), fast enough for real-time imaging. Before the experiments, a new fiber-optic probe consisting of a millimeter-diameter fiber bundle and a large-FOV miniature objective lens was used for imaging. The packaged large-FOV pCM system and fiber-optic probe are shown in Fig. 7(a).
![]()
Figure 7.(a) Packaged large-FOV pCM system with a fiber-optic probe. Measurement results of the (b) FOV and (c) lateral resolution with line profile analysis result for the vertical features in Group 8 Element 1. The red arrow in (c) points to the smallest resolved details. The scale bars in (b) and the enlarged red box in (c) are 50 and 20 μm, respectively.
B. FOV and Lateral Resolution
We tested the FOV by imaging a grating (80 lines/mm, Edmund), which was dripped with sodium fluorescein solution and was in contact with the distal end of the fiber-optic probe. Here, 41 stripes could be distinguished clearly, as shown in Fig. 7(b), indicating an FOV diameter of 512.5 μm. In addition, the lateral resolution of the large-FOV pCM was tested using a 1951 USAF target. The smallest distinguishable features of the system were the Group 8 Element 1 bars, as shown by the red arrow in the enlarged red box of Fig. 7(c), corresponding to a spatial frequency of 256 lp/mm or a bar width of 1.95 μm. The cross section through the Group 8 Element 1 vertical features in Fig. 7(c) demonstrates that they show the expected sinusoidal pattern. Both the measured FOV and resolution were consistent with theoretical estimations.
To evaluate the lateral resolution uniformity, we tested the resolution in multiple fields and directions. We divided the 512.5 μm diameter of the FOV in the radial direction into four fields: field center, 0.5 field, 0.707 field, and full field. Each field was further evenly divided in eight directions, setting the orientation 1 to 0° and number clockwise with a 45° difference between the two adjacent orientations. We moved the Group 8 Element 1 bars to different locations and tested the resolution. The clarity of the features determines the consistency of the resolution between these locations and the field center. Owing to the symmetry of the FOV, we selected the resolution test results of the 0.5, 0.707, and full fields with orientations 1, 2, 3, and 4, as shown in Fig. 8. The red arrows indicate the different orientations and point to the smallest resolved details. In Figs. 8(a)–8(c), the Group 8 Element 1 bars can be clearly distinguished in the three fields of orientation 1. Thus, there was no difference in resolution between the different fields of orientation 1. The resolutions of the orientations 2, 3, and 4 were also independent of the fields, as shown in Figs. 8(d)–8(l). Cross sections in Figs. 8(m)–8(o) show that the Group 8 Element 1 bars can be resolved in different fields. However, for the same field, the smallest distinguishable features of the different orientations were the Group 8 Element 1 bars. Therefore, the large-FOV pCM can maintain a 1.95 μm line width visualization across the full FOV of 512.5 μm diameter.
![]()
Figure 8.Resolution measurement results. (a)–(c) Resolution measured in three fields of orientation 1. (d)–(f) Resolution measured in three fields of orientation 2. (g)–(i) Resolution measured in three fields of orientation 3. (j)–(l) Resolution measured in three fields of orientation 4. (m)–(o) Line profile analysis results for the vertical features in Group 8 Element 1 in three fields of orientation 4. Red arrows indicate different orientations and point to the smallest resolved details. All positions can clearly distinguish the Group 8 Element 1 bars, corresponding to a bar width of 1.95 μm. Scale bar: 50 μm.
4. TISSUE IMAGING
A. Animal Preparation
We tested the performance of the system by imaging the gastrointestinal tract tissues of male Sprague Dawley (SD) rats weighing approximately 200 g. SD rats were purchased from the Zhongnan Hospital of Wuhan University (Wuhan, China) and fed adaptively for one week before the experiments. All rats fasted for 24 h before the experiment and had free access to water to reduce the possibility of food residues and residual excreta. All experiments were approved by the animal experiment guidelines of the Animal Experimentation Ethics Committee of Huazhong University of Science and Technology (HUST, Wuhan, China).
The gastric ulcer model in restrained cold-water stressed rats is an acute stress gastric ulcer model, similar to human stress ulcers. The characteristics of gastric mucosal lesions are acute hemorrhagic superficial gastritis, with little difference in interindividual pathology. Thus, water-immersion-restraint stress gastric ulcers in rats are the first choice for various stress ulcer models, as they provide convenient modeling and high modeling rates [29–32], and they are widely used in basic biological research [33–35].
The experimental group was starved for 24 h prior to the experiments but was allowed free access to water. After mild anesthesia with chloral hydrate, the rats were restrained on a mouse rack and immersed up to a depth of the xiphoid process in a water bath of temperature 23°C for 12 h. The dextran sulfate sodium (DSS)-induced ulcerative colitis model is one of the most widely used chemically induced colitis models for biological research [36–39], so DSS (6%, w/v) was administered orally via drinking water for seven days to establish an ulcerative colitis model.
All rats were anesthetized using an intraperitoneal injection of urethane and chloral hydrate mixed solution (60 μL/10 g), and then 33 mg/kg injection of sodium fluorescein was administered intravenously. Subsequently, the gastrointestinal tract tissues were removed, exposing the inner surface with stroke-physiological saline solution dripped to prepare for imaging. During imaging, the laser power was maintained at 0.4 mW at the tissue surface.
B. Healthy Rat Stomach
Large-area tissue imaging can help reduce the observation time and improve the accuracy of targeted biopsies, improving the detection rate. To characterize the imaging capability of a large-FOV pCM system, we imaged the gastrointestinal tract tissues of healthy SD rats. A homemade large-FOV pCM and a conventional pCM (FOV diameter: 269 μm, CLE-1000, Endovision Medical Technology Co., Ltd, China) were used to image the same gastric tissues at the same laser intensity, the results of which are shown in Figs. 9(a) and 9(c), respectively, at the same scale. Both pCMs were able to observe the typical structure of gastric pits and clearly distinguish the finer epithelial cells. The shape, arrangement, and size of gastric pits are the basis for diagnosis by clinicians. In the imaging results, regular-shaped and distributed gastric pits (blue arrows) and epithelial cells (red arrows) could be clearly observed, consistent with the hematoxylin–eosin (HE) staining results shown in Fig. 9(b).
![]()
Figure 9.Comparison of healthy gastric tissue images using a large-FOV pCM and conventional pCM. (a) Image of healthy stomach using the large-FOV pCM. (b) Corresponding histologic specimens. (c) Image of healthy gastric tissues using the conventional pCM. (d) Statistics regarding the number of gastric pits observed in the two pCMs. The
The imaging area of the large-FOV pCM was significantly larger than that of the conventional pCM, which was comparable to the imaging FOV of the NA objective lens of the Zeiss Axio Observer. Consequently, the number of gastric pits observed using the large-FOV pCM was much greater than that observed using the conventional pCM. The gastric pits that could be observed per FOV by the two systems were quantitatively analyzed, as shown in Fig. 9(d). The average numbers of gastric pits in the conventional and large-FOV pCMs were 53.32 and 154.60, respectively. Differences between the conventional and large-FOV pCMs were analyzed using -tests. The differences in the gastric pit numbers between the two pCMs were highly significant (). Furthermore, compared with the conventional pCM, the average number of gastric pits observed using the large-FOV pCM increased by a factor of 2.90—that is, close to the ratio of the theoretical FOVs of the two systems of 3.63. The difference between the statistical and theoretical values in the FOV may have been due to the stroma of gastric pits and the non-uniformity of the gastric pit size.
C. Healthy Rat Colon
We used the same method to image healthy rat colon tissues, verifying the system’s ability to image the lower gastrointestinal tract tissues. The large-FOV pCM clearly showed the typical structure of the colon and had the ability to show the area of the lower gastrointestinal tissue at a cellular level, approximately four times that of the conventional pCM. Figures 10(a) and 10(c) show the results of the large-FOV and conventional pCMs, respectively. The arrangement and morphology of the colon crypts and the presence or absence of goblet cells are the basis for diagnosis by clinicians. From the imaging results, the healthy colon shows a hexagonal, honeycomb appearance with a regular ordered network of capillaries demarcating the luminal crypt orifice (green arrowheads). Columnar epithelial cells (red arrows) are clearly arranged in an orderly manner in a radial mode surrounding the regular-shaped and distributed crypts. The boundaries between the crypts are distinct, and darker goblet cells (blue arrows) can be seen in both figures. The size ratio exhibited by the two images signifies the size ratio of the actual FOV. The statistical results of the colon crypts visible in a single-frame image are shown in Fig. 10(d). The average numbers of crypts in single-frame images from the conventional and large-FOV pCMs were 13.42 and 37.84, respectively. The difference in the crypt number was statistically significant (), consistent with the difference in the FOV of the two systems.
![]()
Figure 10.Healthy colon tissue images obtained using large-FOV and conventional pCMs. (a) Image of healthy colon obtained using the large-FOV pCM. (b) Corresponding histologic specimens. (c) Image of healthy colon obtained using the conventional pCM. (d) Statistics regarding the number of colon crypts observed in the two pCMs. The
D. Gastric Ulcer
The ability to distinguish between healthy and diseased tissues is necessary for a large-FOV pCM. Thus, we imaged the gastric tissues of one rat from the water-immersion-restraint stress gastric ulcer model to demonstrate the ability of the system to assess the diseased tissues of the upper gastrointestinal tract. The results are shown in Fig. 11(b). We compared the results to those for the gastric tissues of the control group without gastric ulcers, as shown in Fig. 11(a). In the case of the gastric ulcers, epithelial cells of normal size and morphology—which are similar to those of the healthy gastric tissues—are clearly visible. The epithelial cells are surrounded by white circles in the gastric ulcers, as indicated by the red arrow in Fig. 11(b). In contrast to the healthy gastric tissues, the gastric ulcers show distorted gastric pits and dilated openings, as indicated by the blue arrow in Fig. 11(b). In addition, the gastric ulcer shows destroyed epithelium with fluorescein sodium leakage (yellow arrow). The large-FOV pCM’s wide view enables visualization of the differences between healthy and ulcerated gastric tissues, corresponding well with histopathological findings [Fig. 11(c)]. This demonstrates that the large-FOV pCM system has the potential for rapid and accurate diagnosis of upper gastrointestinal tract diseases.
![]()
Figure 11.Images of healthy and ulcerated gastric tissues. (a) Image of healthy gastric tissue. The mucosa shows regularly distributed superficial epithelial cells (red arrow) and gastric pits (blue arrow) and is free of fluorescein sodium leakage. (b) Image of gastric ulcer. Epithelial cells surrounded by a white circle (red arrow) of normal size and morphology are visible. The gastric ulcer shows distorted gastric pits with dilated openings (blue arrow) and destroyed epithelium with fluorescein sodium leakage (yellow arrow). (c) Histopathological analysis of gastric ulcer tissues. In (c), the red arrow shows epithelial cells, the blue arrow shows gastric pits, and the green arrow shows hemorrhage. Scale bars: 50 μm.
E. Ulcerative Colitis
Although a wide view of 500 μm at cellular resolution has been obtained, clinicians generally want to obtain a complete view of gastrointestinal tract tissues for faster screening and surveillance during diagnosis. Mosaicking is a method used to obtain large-area imaging. Consequently, we attempted to stitch large-FOV pCM images together to obtain wider views of healthy colon and DSS-induced colitis tissues. Figures 12(a) and 12(c) are mosaic images of seven frames of healthy colon and eight frames of colitis tissues, respectively. The red and blue boxes in the two mosaic images are shown in Figs. 12(b) and 12(d), respectively. Screening of ulcerative colitis tissues revealed that epithelial cells (red arrows) and reduced quantities of goblet cells (blue arrows) could be identified. The image of the colonic mucosa of SD rats with ulcerative colitis shows irregular alignment of crypts with dilated openings (white arrows), crypt distortion and fusion (green arrows), and irregular fluorescein sodium leakage (yellow arrows). The imaging results for ulcerative colitis are highly consistent with the HE staining results shown in Fig. 12(f). Healthy colon and colitis tissues show clearly different characteristics, indicating that the large-FOV pCM has the ability to detect lower digestive tract diseases.
![]()
Figure 12.Images of the colon tissue. (a) A mosaic image of healthy colon tissues includes seven frames obtained using the large-FOV pCM. (b) Enlarged details of the red rectangle in (a). (c) A mosaic image of ulcerative colitis tissues includes eight frames obtained using the large-FOV pCM. (d) Enlarged details of the blue rectangle in (c). (e) A mosaic image of the same ulcerative colitis tissues includes 12 frames obtained using the conventional pCM. (f) Corresponding histological specimens of ulcerative colitis tissues. (g) Crypt numbers observed in the three mosaic images. Red arrows, columnar epithelial cells; blue arrows, goblet cells; yellow arrows, fluorescein sodium leakage; green arrows, crypt fusion; white arrows, dilated openings. In (a), (c), (e), and (f) the scale bars are 100 μm. In (b) and (d), the scale bars are 50 μm.
![]()
Figure 13.Relay system layout. The blue arrow indicates the coupling objective lens. The red arrow indicates the image surface at which the aberrations were calculated. The total optical length of the relay lens system is 608.918 mm.
The stitching algorithm used in this study consisted of two parts: a registration method based on feature points and a seam-guide stitching scheme. The feature points were detected using a scale-invariant feature transform, which stitched images to an acceptable visual standard, without obvious seams or artifacts. To ensure the robustness of the stitching procedure, the overlap rate of two adjacent single-frame images should be greater than 50%. Based on our statistics, the overlap rates in Figs. 12(a) and 12(c) were 58.8% and 62.5%, respectively, as shown in Table 1. The views were greatly increased by mosaicking, reaching approximately and , respectively. Wider-view images show more tissue information. The quantities of colon crypts visible in the two mosaic images were 105 and 142, respectively, as indicated by the light and deep red bars in Fig. 12(g). The stitching area of the colitis tissues was smaller than that of the healthy colon tissues, but displayed more crypts. A possible reason for this is that the crypts in the colitis tissues were locally clustered, and of different sizes and irregular arrangement. Mosaic Image Data Overlap Colon Fig. 7 58.8% 105 Fig. 8 62.5% 142 Fig. 12 66.0% 52
Conventional pCM results can also achieve a wider view by stitching. We imaged the same ulcerative colitis tissues and obtained a mosaic result, including twelve single-frame images, as shown in Fig. 12(e). The overlap rate was 66.0%, and the FOV was approximately . The typical characteristics of ulcerative colitis lesions with sodium fluorescein leakage and crypt fusion were also observed, similarly to those shown in Fig. 12(c). However, the mosaic image area of the conventional pCM was much smaller than that of the large-FOV pCM. Only 52 colon crypts were visible in Fig. 12(e), denoted by dark blue bars in Fig. 12(g). The large-FOV pCM could obtain a larger area by mosaicking fewer images. Meanwhile, a single image with a wider view also includes more tissue information from which feature points to implement mosaicking can be obtained.
5. CONCLUSION AND DISCUSSION
In this study, we developed a large-FOV pCM for the cellular imaging of gastrointestinal tract tissues with a wide view. To our knowledge, this is the first study to demonstrate that a large-FOV pCM could image gastrointestinal tract tissues with an FOV diameter over 500 μm and a resolution of up to 1.95 μm using a probe of diameter 2.6 mm. Here, we improved the FOV of the system by increasing the image circle diameter of the fiber bundle, known as the field stop. Moreover, the scanning relay and coupling system was optimized and assembled to effectively correct the field curvature, astigmatism, and distortion, which increased rapidly as the FOV increased. Gradient index (GRIN) lenses with small outer diameter are commonly used in endoscopic imaging [40–42], but they are not suitable for large-FOV confocal mircroendoscopy owing to severe aberration. A custom-designed miniature objective lens composed of just seven lenses was manufactured, with a volume ratio of approximately 1:700 to that of a commercial microscope objective lens to achieve cellular resolution as the FOV increased. Compared with other custom-designed miniature objective lenses (see Appendix F), our objective lens was designed to operate over the FOV diameter of 512.5 μm and be compatible with the biopsy channel of conventional gastroscopes. The performance test results showed that the system had a uniformly high resolution in the submillimeter FOV. Compared with a conventional pCM, the gastrointestinal tissue images of SD rats showed that the large-FOV pCM improved the FOV approximately fourfold while maintaining cellular resolution. Imaging of diseased tissues demonstrated that the large-FOV pCM could be used to detect diseases of the upper and lower gastrointestinal tract. In addition, mosaicked large-FOV images were conducive to obtaining more comprehensive tissue information, a beneficial outcome for clinical applications.
At present, only superficial large-area imaging of tissues can be performed; however, deep imaging is also important for clinical diagnosis and basic biomedical research [43,44]. Future research will focus on deep-tissue large-FOV imaging for the classification of tumor invasion [45] and further treatment [6]. Moreover, optimization of the scanning relay system is based on commercial lenses, resulting in a limited choice of lenses when considering both system size and aberration correction. Lenses custom-designed for the scanning relay system requirements could maintain diffraction-limit performance in a more compact configuration.
Acknowledgment
Acknowledgment. The authors thank Prof. Xiaohua Hou, Prof. Rong Lin, and Dr. Mengke Fan from the Wuhan Union Hospital, HUST, for histological specimen diagnosis. The authors also thank the Animal Experimentation Ethics Committee of HUST and the Analytical and Testing Center of HUST for the experimental measurements.
APPENDIX A
The relay system consists of a relay lens system and a coupling objective lens, as shown in Fig.
APPENDIX B
The design requirements of the miniature objective lens are listed in Table Design Requirements for the Miniature Objective LensSpecification Value 0.52 (water immersion) Magnification 2.2 Working distance 80 μm Field of view (FOV) 570 μm Telecentricity Image space Wavelength 488–550 nm Outer diameter 2.6 mm Clear aperture 1.8 mm Root mean square (RMS) radius at fiber MTF at 132 lp/mm at fiber
The lens parameters including surface radius, thickness, materials, and lens diameters are listed in Table Lens Descriptions of the Miniature Objective Lens Aspheric surface.Surface Comment Radius (mm) Thickness (mm) Glass Diameter (mm) OBJ Tissue –10.064 0.084 SEAWATER 0.570 1 Lens 1 Infinity 2 H-LAF50B 2.200 2 –1.622 0.146 2.200 3 Lens 2 –14.353 0.804 H-LAK3 2.200 4 –3.380 0.100 2.200 5* Lens 3 4.657 0.600 H-ZF72A 1.800 6 Lens 4 1.383 1.133 H-ZLAF89L 1.800 7 –13.25 0.186 2.200 8 Lens 5 2.389 0.600 H-LAK4L 2.200 9 4.759 0.801 1.800 10 Lens 6 –1.951 1.943 H-ZF39 1.800 11 –4.969 0.228 2.200 12 Lens 7 1.086 0.786 D-ZLAF67 1.800 13 0.845 0.318 1.400 IMA Fiber bundle Infinity 1.240 OBJ 98.113 25.432 –435.297 2950.302 –3566.585 –3642.758 12 –0.546 – – – – – 13 –1.370 1.153 4.715 –23.443 67.774 –70.961
APPENDIX C
We analyzed the RMS wavefront error and RMS spot radius, as shown in Fig.
![]()
Figure 14.(a) RMS wavefront error as a function of field with respect to the diffraction-limited value. (b) RMS spot radius as a function of field with respect to the single fiber radius.
![]()
Figure 15.Schematic of the large-FOV pCM system. DM, dichroic mirrors; OD, outer diameter; FL, focal length; NA, numerical aperture;
APPENDIX D
The fabrication tolerance parameters used during the optimization are presented in Table Tolerances for the Miniature Objective LensTolerance Value Radius (fringes) Thickness (mm) Surface decenter (mm) Surface tilt (°) Surface irreg (fringes) Element decenter (mm) Element tilt (°) Index Abbe
Table Monte Carlo Analysis ResultsProbability RMS Spot Radius (μm) 90% 3.49 80% 2.39 50% 1.67 20% 1.36 10% 1.24
APPENDIX E
The large-FOV pCM system consists of a laser, beam expander, scanner, relay system, fiber-optic probe, fluorescence signal collection system, control module, and computer, as shown in Fig.
APPENDIX F
Miniature objective lenses designed based on different requirements such as size, cost, and imaging performance are widely used in confocal microendoscopy. Table Comparison of the Miniature Objective Lens from Different GroupsParameters Rouse Chidley Kyrish Jeon Our Design Number of lenses 9 5 6 5 7 Outer diameter (mm) 3 7 2.1 2.4 2.6 Length (mm) 13 17.5 10 13.8 11.2 FOV (μm) 450 250 360 290 570 Resolution (μm) 1.8 0.65 2.2 2 0.78 Wavelength (nm) 480–660 1064 452–623 515–570 488–550
References
[1] A. F. Gmitro, D. Aziz. Confocal microscopy through a fiber-optic imaging bundle. Opt. Lett., 18, 565-567(1993).
[2] R. A. Sutton, P. Sharma. Imaging for Barrett’s esophagus: state of the art. Curr. Opin. Gastroen., 35, 395-400(2019).
[3] Z. Li, X. Zuo, T. Yu, X. Gu, C. Zhou, C. Li, R. Ji, Y. Li. Confocal laser endomicroscopy for
[4] Y. Tian, Y. Zheng, G. Teng, J. Li, H. Wang. Imbalanced mucosal microcirculation in the remission stage of ulcerative colitis using probe-based confocal laser endomicroscopy. BMC Gastroenterol., 19, 114-122(2019).
[5] H. Li, X. Hou, R. Lin, M. Fan, S. Pang, L. Jiang, Q. Liu, L. Fu. Advanced endoscopic methods in gastrointestinal diseases: a systematic review. Quant. Imag. Med. Surg., 9, 905-920(2019).
[6] O. Pech, T. Rabenstein, H. Manner, M. C. Petrone, J. Pohl, M. Vieth, M. Stolte, C. Ell. Confocal laser endomicroscopy for
[7] B. Viellerobe, A. Osdoit, C. Cavé, F. Lacombe, S. Loiseau, B. Abrat. Mauna Kea technologies’ F400 prototype: a new tool for
[8] J. Wang, M. Yang, L. Yang, Y. Zhang, J. Yuan, Q. Liu, X. Hou, L. Fu. A confocal endoscope for cellular imaging. Engineering, 1, 351-360(2015).
[9] G. Perrod, G. Rahmi, L. Pidial, S. Camilleri, A. Bellucci, A. Casanova, T. Viel, B. Tavitian, C. Cellier, O. Clement. Cell sheet transplantation for esophageal stricture prevention after endoscopic submucosal dissection in a porcine model. PLOS ONE, 11, e0148249(2016).
[10] T. Hassan, L. Thiberville, C. Hermant, S. Lachkar, N. Piton, F. Guisier, M. Salaun. Assessing the feasibility of confocal laser endomicroscopy in solitary pulmonary nodules for different part of the lungs, using either 0.6 or 1.4 mm probes. PLOS ONE, 12, e0189846(2017).
[11] M. Born, E. Wolf. Principles of Optics: Electromagnetic Theory of Propagation, Interference and Diffraction of Light(2013).
[12] S. W. Oh, J. A. Harris, L. Ng, B. Winslow, N. Cain, S. Mihalas, Q. Wang, C. Lau, L. Kuan, A. M. Henry, M. T. Mortrud, B. Ouellette, T. N. Nguyen, S. A. Sorensen, C. R. Slaughterbeck, W. Wakeman, Y. Li, D. Feng, A. Ho, E. Nicholas, K. E. Hirokawa, P. Bohn, K. M. Joines, H. Peng, M. J. Hawrylycz, J. W. Phillips, J. G. Hohmann, P. Wohnoutka, C. R. Gerfen, C. Koch, A. Bernard, C. Dang, A. R. Jones, H. Zeng. A mesoscale connectome of the mouse brain. Nature, 508, 207-214(2014).
[13] M. N. Economo, N. G. Clack, L. D. Lavis, C. R. Gerfen, K. Svoboda, E. W. Myers, J. Chandrashekar. A platform for brain-wide imaging and reconstruction of individual neurons. eLife, 5, e10566(2016).
[14] G. Zheng, R. Horstmeyer, C. Yang. Wide-field, high-resolution Fourier ptychographic microscopy. Nat. Photonics, 7, 739-745(2013).
[15] A. Pan, C. Zuo, B. Yao. High-resolution and large field-of-view Fourier ptychographic microscopy and its applications in biomedicine. Rep. Prog. Phys., 83, 096101(2020).
[16] C. A. Werley, M. P. Chien, A. E. Cohen. Ultrawidefield microscope for high-speed fluorescence imaging and targeted optogenetic stimulation. Biomed. Opt. Express, 8, 5794-5813(2017).
[17] G. Mcconnell, J. Trägårdh, R. Amor, J. Dempster, E. Reid, W. B. Amos. A novel optical microscope for imaging large embryos and tissue volumes with sub-cellular resolution throughout. eLife, 5, e18659(2016).
[18] N. J. Sofroniew, D. Flickinger, J. King, K. Svoboda. A large field of view two-photon mesoscope with subcellular resolution for
[19] V. N. Mahajan. Optical Imaging and Aberrations: Part I. Ray Geometrical Optics, 141-242(1998).
[20] N. Ji, J. Freeman, S. L. Smith. Technologies for imaging neural activity in large volumes. Nat. Neurosci., 19, 1154-1164(2016).
[21] L. Yang, J. Wang, G. Tian, J. Yuan, Q. Liu, L. Fu. Five-lens, easy-to-implement miniature objective for a fluorescence confocal microendoscope. Opt. Express, 24, 473-484(2016).
[22] R. Drougard. Optical transfer properties of fiber bundles. J. Opt. Soc. Am., 54, 907-914(1964).
[23] J. Lv, B. Xue, T. Li, Y. H. He, X. L. Ma, X. T. Yan. Optical system design of subminiature endoscope with imaging fiber bundle. Proc. SPIE, 10153, 101530L(2016).
[24] Y. S. Sabharwal, A. R. Rouse, L. Donaldson, M. F. Hopkins, A. F. Gmitro. Slit-scanning confocal microendoscope for high-resolution
[25] A. R. Rouse. Multispectral confocal microendoscope for in-vivo imaging(2004).
[26] P. Burns. Slanted-edge MTF for digital camera and scanner analysis. Is and Ts Pics Conference, 135-138(2000).
[27] J. Wang, H. Li, R. Xu, Q. Liu, L. Fu. A confocal endomicroscopy for cellular imaging. International Conference on Photonics and Imaging in Biology and Medicine, W3A.29(2017).
[28] N. Savoire, B. André, T. Vercauteren. Online blind calibration of non-uniform photodetectors: application to endomicroscopy. Med. Image Comput. Comput. Assist. Interv., 15, 639-646(2012).
[29] Y. Ohta, T. Kobayashi, K. Nishida, M. Nagata, I. Ishiguro. Therapeutic effect of Oren-Gedoku-To extract on stress-induced acute gastric mucosal lesions in rats. Phytother. Res., 13, 588-592(1999).
[30] H. Kitagawa, M. Fujiwara, Y. Osumi. Effects of water-immersion stress on gastric secretion and mucosal blood flow in rats. Gastroenterology, 77, 298-302(1979).
[31] T. Fujikawa, A. Yamaguchi, I. Morita, H. Takeda, S. Nishibe. Protective effects of Acanthopanax senticosus HARMS from Hokkaido and its components on gastric ulcer in restrained cold water stressed rats. Biol. Pharm. Bull., 19, 1227-1230(1996).
[32] K. Takagi, Y. Kasuya, K. Watanabe. Studies on the drugs for peptic ulcer. A reliable method for producing stress ulcer in rats. Chem. Pharm. Bull., 12, 465-472(1964).
[33] T. Ishihara, T. Takada, Y. Shoji, Y. Uedono, N. Takeyama, T. Tanaka. Hyperammonemia reduces water immersion-restraint stress gastric ulcers in rats. Gen. Pharmacol., 31, 87-91(1998).
[34] A. R. A. Moutaery. Effect of centrophenoxine on water-immersion restraint stress- and chemically-induced gastric ulcers in rats. Res. Commun. Mol. Pathol. Pharmacol., 113-114, 39-56(2003).
[35] Z. R. Zhou, P. Huang, G. H. Song, Z. Zhang, W. Ding. Comparative proteomic analysis of rats subjected to water immersion and restraint stress as an insight into gastric ulcers. Mol. Med. Rep., 16, 5425-5433(2017).
[36] S. N. S. Murthy, H. S. Cooper, H. Shim, R. S. Shah, S. A. Ibrahim, D. J. Sedergran. Treatment of dextran sulfate sodium-induced murine colitis by intracolonic cyclosporin. Digest. Dis. Sci., 38, 1722-1734(1993).
[37] D. N. Seril, J. Liao, G.-Y. Yang, C. S. Yang. Oxidative stress and ulcerative colitis-associated carcinogenesis: studies in humans and animal models. Carcinogenesis, 24, 353-362(2003).
[38] J. Wang, H. Li, G. Tian, Y. Deng, Q. Liu, L. Fu. Near-infrared probe-based confocal microendoscope for deep-tissue imaging. Biomed. Opt. Express, 9, 5011-5025(2018).
[39] L. A. Dieleman, M. J. Palmen, H. Akol, E. Bloemena, A. S. Peña, S. G. Meuwissen, E. P. Van Rees. Chronic experimental colitis induced by dextran sulphate sodium (DSS) is characterized by Th1 and Th2 cytokines. Clin. Exp. Immunol., 114, 385-391(1998).
[40] J. Knittel, L. Schnieder, G. Buess, B. Messerschmidt, T. Possner. Endoscope-compatible confocal microscope using a gradient index-lens system. Opt. Commun., 188, 267-273(2001).
[41] P. M. Lane, S. Lam, A. McWilliams, J. C. Leriche, M. W. Anderson, C. E. Macaulay. Confocal fluorescence microendoscopy of bronchial epithelium. J. Biomed. Opt., 14, 024008(2009).
[42] D. M. Huland, C. M. Brown, S. S. Howard, D. G. Ouzounov, I. Pavlova, K. Wang, D. R. Rivera, W. W. Webb, C. Xu.
[43] N. Dong, J. Cui, J. Xu. Variable-spot-size optical system for a dual-wavelength laser therapy device. J. Innov. Opt. Heal. Sci., 13, 2050018(2020).
[44] J. Li, M. Wilson, A. Bower, M. Marjanovic, J. Chaney, R. Barkalifa, S. Boppart. Video-rate multimodal multiphoton imaging and three-dimensional characterization of cellular dynamics in wounded skin. J. Innov. Opt. Heal. Sci., 13, 2050007(2020).
[45] C. Katada, M. Muto, K. Momma, M. Arima, H. Tajiri, C. Kanamaru, H. Ooyanagi, H. Endo, T. Michida, N. Hasuike, I. Oda, T. Fujii, D. Saito. Clinical outcome after endoscopic mucosal resection for esophageal squamous cell carcinoma invading the muscularis mucosae—a multicenter retrospective cohort study. Endoscopy, 39, 779-783(2007).
[46] A. R. Rouse, A. Kano, J. A. Udovich, S. M. Kroto, A. F. Gmitro. Design and demonstration of a miniature catheter for a confocal microendoscope. Appl. Opt., 43, 5763-5771(2004).
[47] M. D. Chidley, K. D. Carlson, R. R. Richards-Kortum, M. R. Descour. Design, assembly, and optical bench testing of a high-numerical-aperture miniature injection-molded objective for fiber-optic confocal reflectance microscopy. Appl. Opt., 45, 2545-2554(2006).
[48] M. Kyrish, J. Dobbs, S. Jain, X. Wang, D. Yu, R. Richards-Kortum, T. S. Tkaczyk. Needle-based fluorescence endomicroscopy via structured illumination with a plastic, achromatic objective. J. Biomed. Opt., 18, 096003(2013).
[49] H. Jeon, M. Pawlowski, T. Tkaczyk. High-resolution endomicroscopy with a spectrally encoded miniature objective. Biomed. Opt. Express, 10, 1432-1445(2019).

Set citation alerts for the article
Please enter your email address
© Copyright 2018-2021 | Chinese Laser Press. All Rights Reserved 沪ICP备15018463号-20