• Photonics Research
  • Vol. 10, Issue 1, 230 (2022)
Jiaqi Yuan1、2, Xuemei Cheng1、2、3、*, Xing Wang2, Tengfei Jiao1, and Zhaoyu Ren1、4、*
Author Affiliations
  • 1State Key Laboratory of Photon-Technology in Western China Energy, International Collaborative Center on Photoelectric Technology and Nano Functional Materials, Institute of Photonics & Photon-Technology, Northwest University, Xi’an 710069, China
  • 2State Key Laboratory of Transient Optics and Photonics, Chinese Academy of Sciences, Xi’an 710119, China
  • 3e-mail: xmcheng@nwu.edu.cn
  • 4e-mail: rzy@nwu.edu.cn
  • show less
    DOI: 10.1364/PRJ.423799 Cite this Article Set citation alerts
    Jiaqi Yuan, Xuemei Cheng, Xing Wang, Tengfei Jiao, Zhaoyu Ren. Single-scan polarization-resolved degenerate four-wave mixing spectroscopy using a vector optical field[J]. Photonics Research, 2022, 10(1): 230 Copy Citation Text show less
    (a) Scheme of the experimental setup. Ti:S, Ti:sapphire laser; VR, vortex retarder; HR, high reflection mirror; PBS, polarization beam splitter; and HWP, half-wave plate. (b) Phase-matching configuration of forward four-wave mixing geometry. (c) The related energy level structures of Rb87.
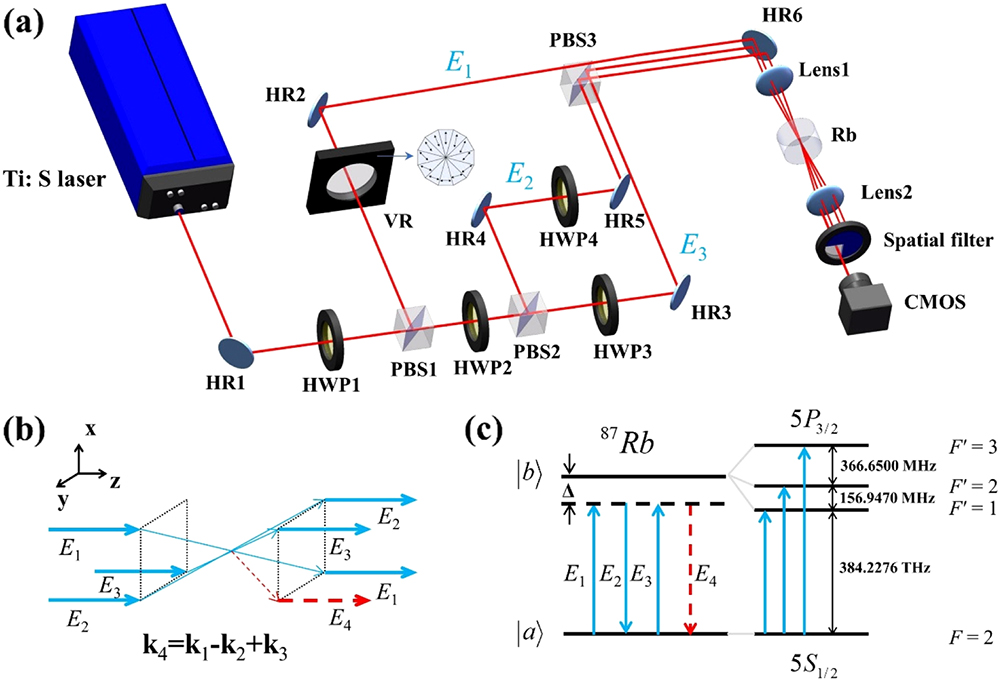
    Fig. 1. (a) Scheme of the experimental setup. Ti:S, Ti:sapphire laser; VR, vortex retarder; HR, high reflection mirror; PBS, polarization beam splitter; and HWP, half-wave plate. (b) Phase-matching configuration of forward four-wave mixing geometry. (c) The related energy level structures of Rb87.
    Possible transition paths at different polarization configurations from |5S1/2,F=2⟩ to |5P3/2,F′=1⟩ in the D2 line of Rb87 when the probe beam is (a) x-polarized, (b) σ+, and (c) σ−. F is the total angular momentum quantum number, and mF is the corresponding projection value. Ωjkl are the corresponding Rabi frequencies of the transitions, which are Ω11π=Ω21π=Ω31π=Ω41π=Ω13π=Ω23π=Ω33π=Ω43π=Ω11σ+=Ω41σ+=Ω13σ−=Ω43σ−=∼146 MHz, Ω12π=Ω22π=Ω32π=Ω42π=∼169 MHz, Ω12σ+=Ω42σ+=Ω12σ−=Ω42σ−=∼103 MHz, and Ω13σ+=Ω43σ+=Ω11σ−=Ω41σ−=∼60 MHz.
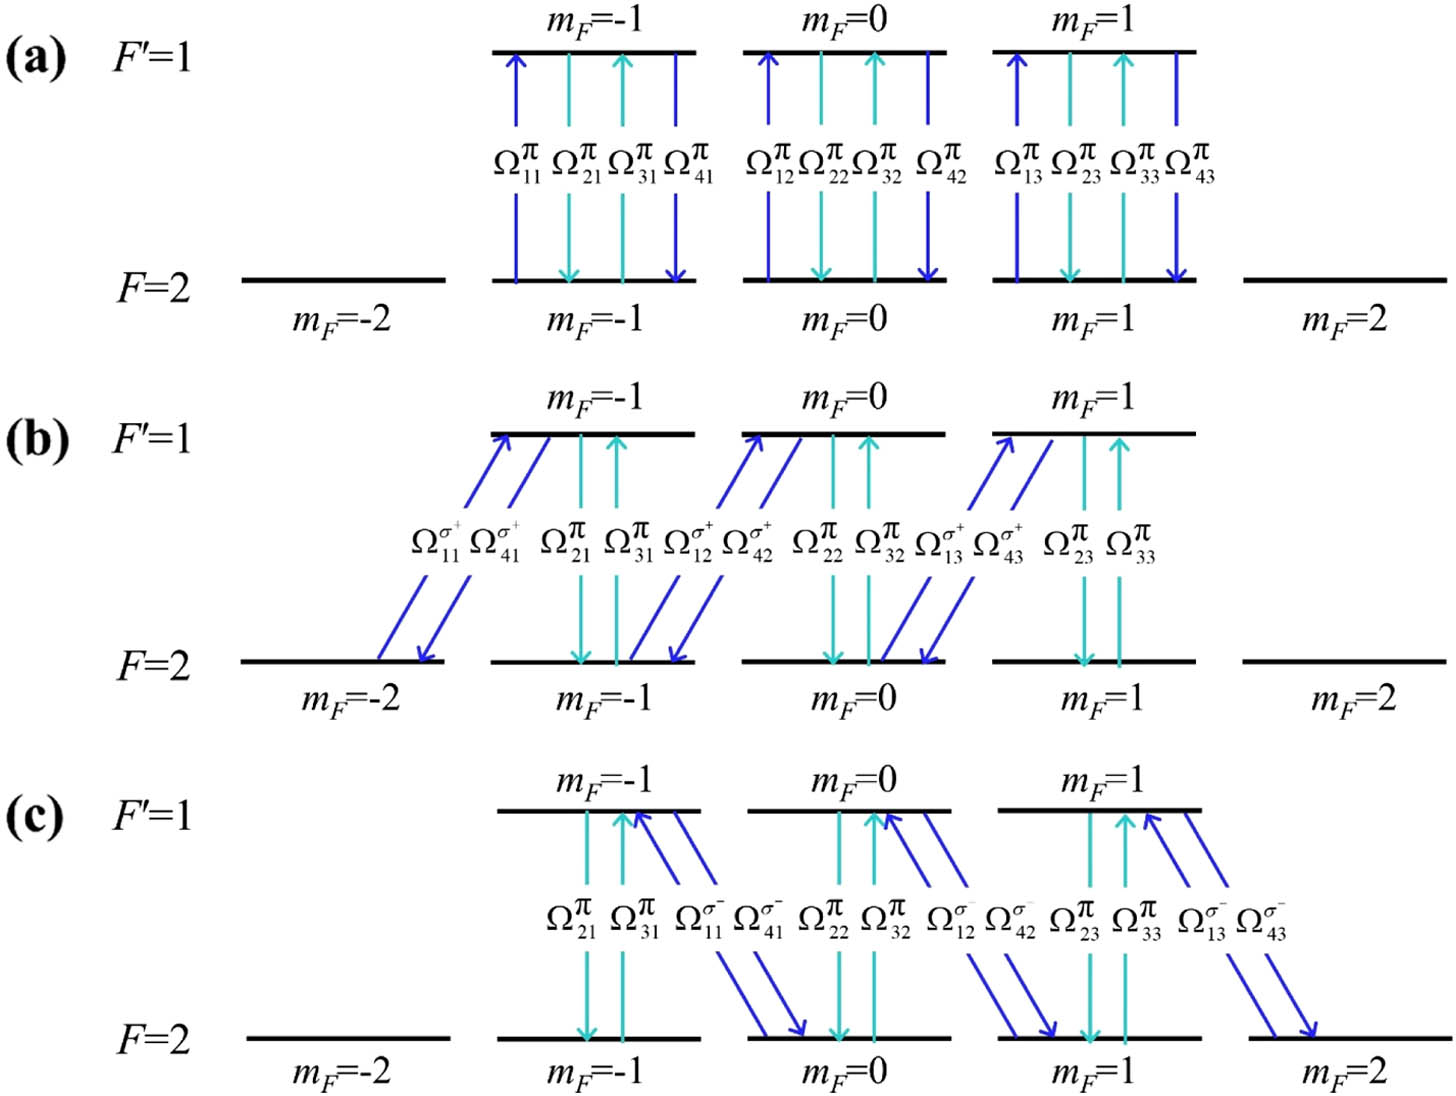
    Fig. 2. Possible transition paths at different polarization configurations from |5S1/2,F=2 to |5P3/2,F=1 in the D2 line of Rb87 when the probe beam is (a) x-polarized, (b) σ+, and (c) σ. F is the total angular momentum quantum number, and mF is the corresponding projection value. Ωjkl are the corresponding Rabi frequencies of the transitions, which are Ω11π=Ω21π=Ω31π=Ω41π=Ω13π=Ω23π=Ω33π=Ω43π=Ω11σ+=Ω41σ+=Ω13σ=Ω43σ=146  MHz, Ω12π=Ω22π=Ω32π=Ω42π=169  MHz, Ω12σ+=Ω42σ+=Ω12σ=Ω42σ=103  MHz, and Ω13σ+=Ω43σ+=Ω11σ=Ω41σ=60  MHz.
    Normalized DFWM signal intensity with respect to the rotation angle of the HWP varying the polarization of E1. The pump beams E2 and E3 are kept x-polarized. The red dots are the experimental data, and the black line is the theoretical curve.
    Fig. 3. Normalized DFWM signal intensity with respect to the rotation angle of the HWP varying the polarization of E1. The pump beams E2 and E3 are kept x-polarized. The red dots are the experimental data, and the black line is the theoretical curve.
    Polarization distribution of the single-scan DFWM signal. (a) Beam images of the vector optical field and its corresponding images after the analyzer. (b) Single-scan DFWM signal image when E1 is the vector optical field.
    Fig. 4. Polarization distribution of the single-scan DFWM signal. (a) Beam images of the vector optical field and its corresponding images after the analyzer. (b) Single-scan DFWM signal image when E1 is the vector optical field.
    DFWM signal images after a polarization analyzer: (a) E1 is the radial vector optical field, and (b) E1 is the angular vector optical field.
    Fig. 5. DFWM signal images after a polarization analyzer: (a) E1 is the radial vector optical field, and (b) E1 is the angular vector optical field.
    Polarization distribution across the DFWM images, and the polarization-resolved spectra retrieved from the single DFWM signal when (a) and (b) E1 is the radial vector optical field, and (c) and (d) E1 is the angular vector optical field. The black solid lines are the theoretical curves.
    Fig. 6. Polarization distribution across the DFWM images, and the polarization-resolved spectra retrieved from the single DFWM signal when (a) and (b) E1 is the radial vector optical field, and (c) and (d) E1 is the angular vector optical field. The black solid lines are the theoretical curves.
    Jiaqi Yuan, Xuemei Cheng, Xing Wang, Tengfei Jiao, Zhaoyu Ren. Single-scan polarization-resolved degenerate four-wave mixing spectroscopy using a vector optical field[J]. Photonics Research, 2022, 10(1): 230
    Download Citation