
Jie Zhang, Shixin Hou, Renjie Li, Bingbing Chen, Fuhua Hou, Xinghua Cui, Jingjing Liu, Qi Wang, Pengyang Wang, Dekun Zhang, Ying Zhao, Xiaodan Zhang. I/P interface modification for stable and efficient perovskite solar cells[J]. Journal of Semiconductors, 2020, 41(5): 052202
- Journal of Semiconductors
- Vol. 41, Issue 5, 052202 (2020)
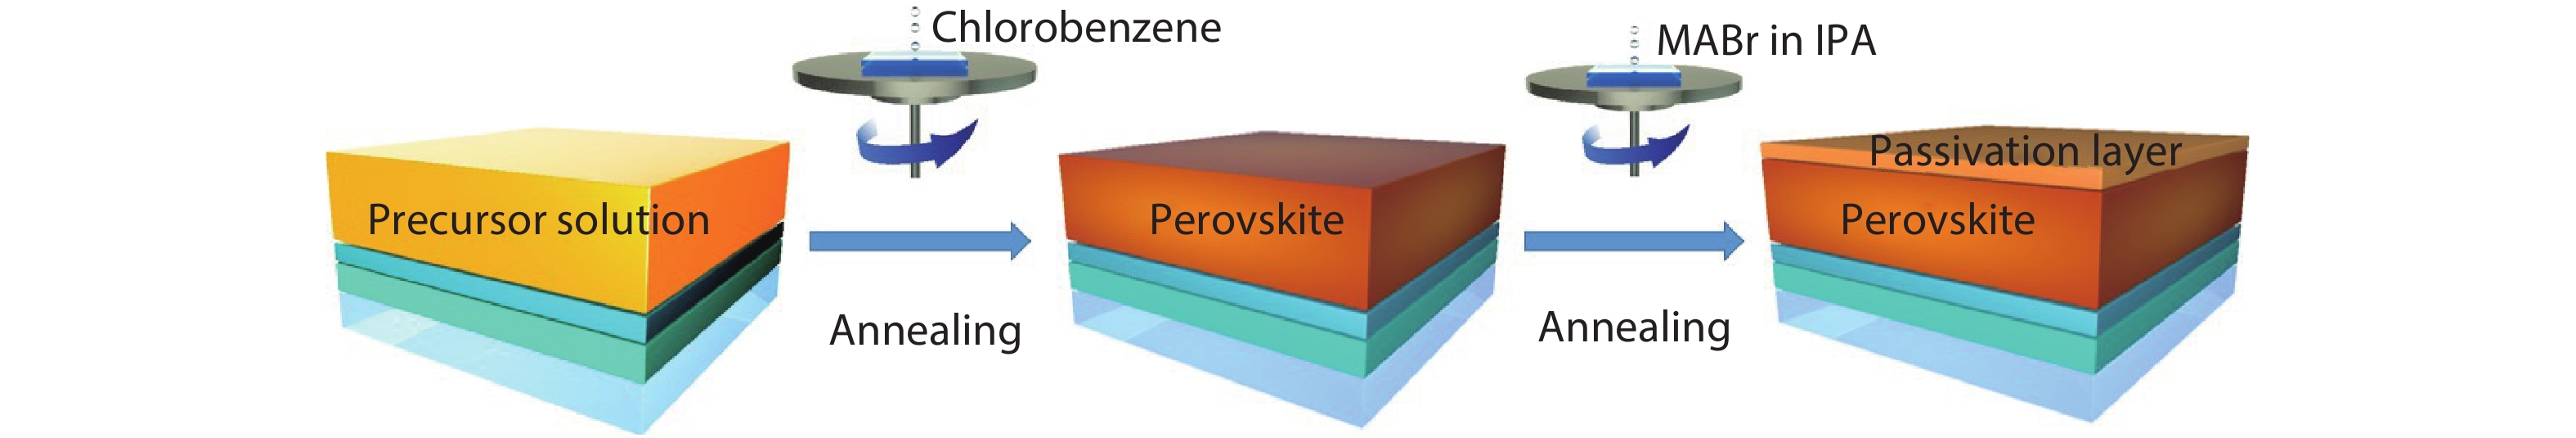
Fig. 1. (Color online) Schematic diagram of the formation of passivation layer.
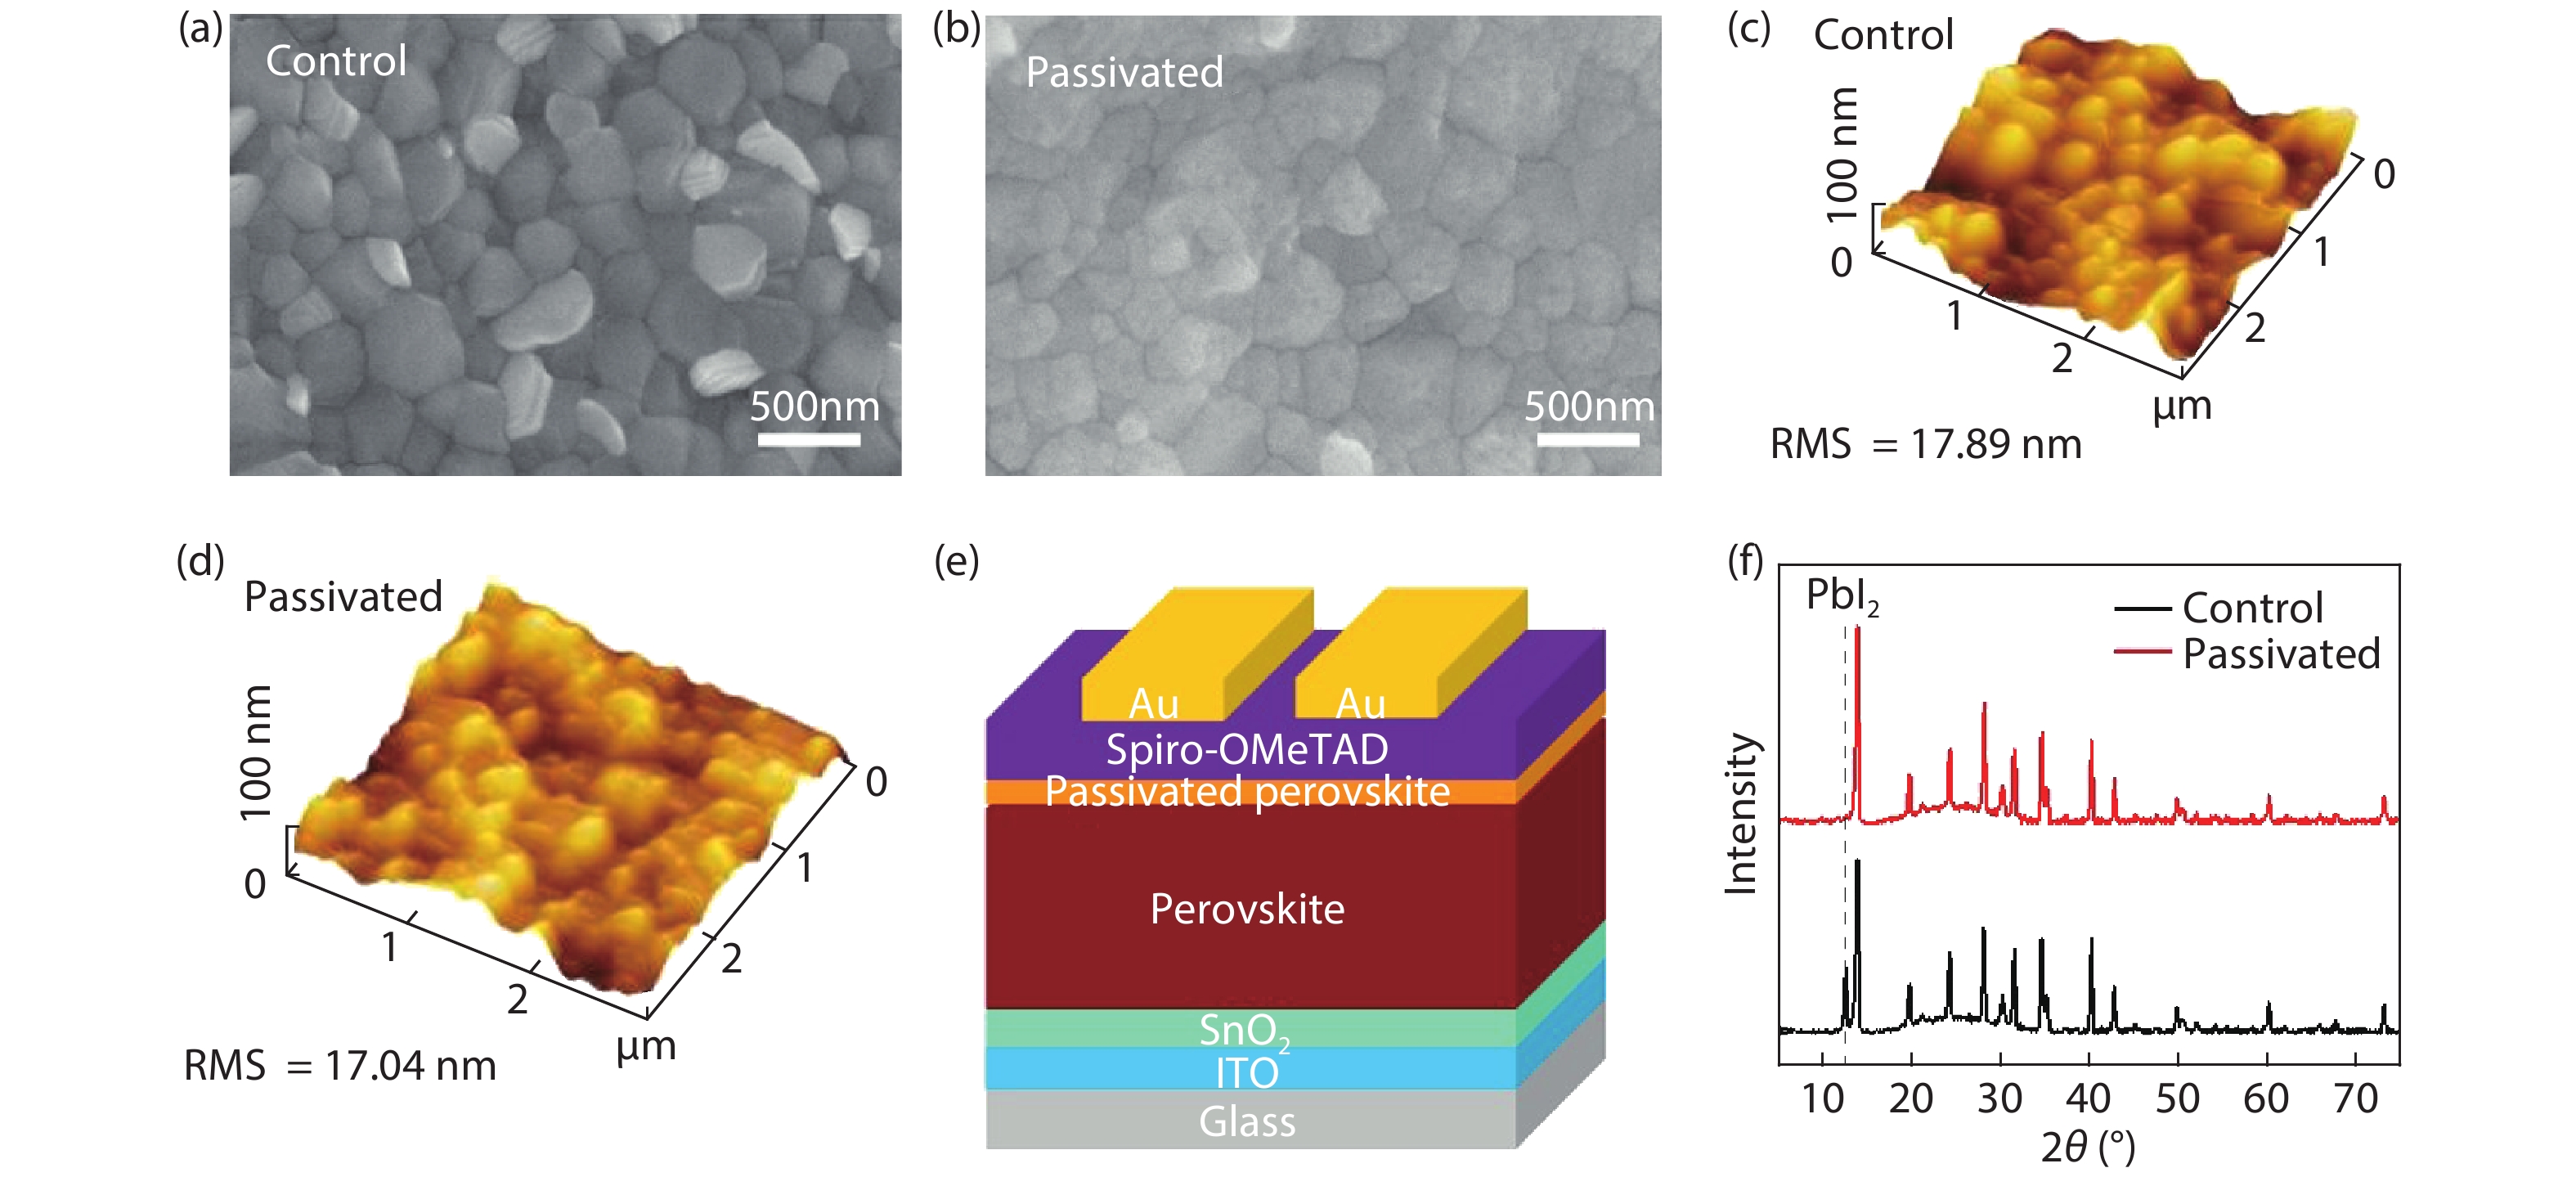
Fig. 2. (Color online) SEM and AFM images of (a, c) control and (b, d) passivated perovskite films on ITO/SnO2 substrates. (e) Device structure of the passivated perovskite solar cells. (f) XRD patterns of passivated and control perovskite films.
Fig. 3. (Color online) (a) J–V curves of the control and passivated perovskite solar cells. (b) External quantum efficiency (EQE) spectra for the passivated and control devices.
Fig. 4. (Color online) (a) Spectra of ultraviolet photoelectron spectroscopy (UPS). (b) Secondary electron cutoff and (c) valence band region near EF of the perovskite film without (control) and with MABr (2 mg/mL) deposited on ITO substrate. (d) The energy level diagram of PSCs. (e) Steady-state photoluminescence (PL) and (f) time-resolved PL (TRPL) spectra of the passivated and control perovskite film.
Fig. 5. (Color online) I−V curves with the device structure of ITO/perovskite/Au, where the perovskite (a) without (control) and (b) with the passivation measured in the dark. (c) Steady-state photoluminescence (PL) and (d) time-resolved PL (TRPL) spectra of the passivated and control perovskite film. (e) The dark I−V characteristics of the perovskite devices with and without the MABr.
Fig. 6. (Color online) (a) Histogram distribution of the PCE for devices with control (40 cells) and passivated perovskite films (40 cells). (b) J−V curves and (c) EQE spectra with integrated J SC of the best passivated perovskite devices. (d) Current density measured for 300 s at the steady power output (SPO) with a fixed maximum voltage (0.97 V).
Fig. 7. (Color online) (a) PCEs evolution of devices in ambient air with the room temperature of 25–30 °C, and the humidity of 20%–30%. (b) Devices kept at 65 °C in ambient air with encapsulation for 400 h.
Fig. 8. (Color online) XRD patterns of (a) control and (b) passivated perovskite films after in humid air (with RH: 20%−30%) for 0, 100, 400, 700, and 1000 h.
|
Table 1. Summary of the device performance with different concentrations of MABr treatment.
|
Table 2. Summary of fitted results of TRPL of the passivated and control devices.

Set citation alerts for the article
Please enter your email address
© Copyright 2018-2021 | Chinese Laser Press. All Rights Reserved 沪ICP备15018463号-20