• Laser & Optoelectronics Progress
  • Vol. 59, Issue 6, 0617006 (2022)
Zhe Li1、2、3、*, Jinchao Feng1、2、3、**, and Kebin Jia1、2、3、***
Author Affiliations
  • 1Faculty of Information Technology, Beijing University of Technology, Beijing 100124, China
  • 2Beijing Laboratory of Advanced Information Networks, Beijing 100124, China
  • 3Beijing Key Laboratory of Computational Intelligence and Intelligent System, Beijing University of Technology, Beijing 100124, China
  • show less
    DOI: 10.3788/LOP202259.0617006 Cite this Article Set citation alerts
    Zhe Li, Jinchao Feng, Kebin Jia. Diffusion Correlation Spectroscopy for Tissue Blood Flow Monitoring and Its Clinical Applications[J]. Laser & Optoelectronics Progress, 2022, 59(6): 0617006 Copy Citation Text show less
    Schematic of diffusion correlation spectroscopy
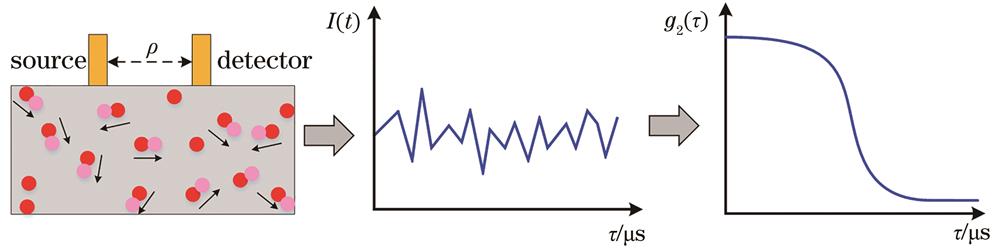
    Fig. 1. Schematic of diffusion correlation spectroscopy
    Comparison between tissue blood flow monitoring using fast DCS and traditional DCS[27]. (a) Normalized intensity autocorrelation function; (b) blood flow index
    Fig. 2. Comparison between tissue blood flow monitoring using fast DCS and traditional DCS[27]. (a) Normalized intensity autocorrelation function; (b) blood flow index
    Schematic of noncontact DCT system with rotational scanning probe[33]
    Fig. 3. Schematic of noncontact DCT system with rotational scanning probe[33]
    Calibration method of BFI in skeletal muscle[23]. (a) Experimental protocol; (b) total hemoglobin concentration change; (c) BFI change
    Fig. 4. Calibration method of BFI in skeletal muscle[23]. (a) Experimental protocol; (b) total hemoglobin concentration change; (c) BFI change
    Experimental protocol of the cerebral BFI calibration method[37]
    Fig. 5. Experimental protocol of the cerebral BFI calibration method[37]
    Network architecture of the BFI quantification method based on LSTM[46]
    Fig. 6. Network architecture of the BFI quantification method based on LSTM[46]
    Changes of cerebral blood flow (CBF) and cerebrovascular resistance (CVR) in 11 healthy subjects during cerebral autoregulation evaluation[47]
    Fig. 7. Changes of cerebral blood flow (CBF) and cerebrovascular resistance (CVR) in 11 healthy subjects during cerebral autoregulation evaluation[47]
    Changes of cerebral blood flow, mean arterial pressure, intracranial pressure, and cerebral oxygen tension during impaired cerebral autoregulation and intact cerebral autoregulation[48]
    Fig. 8. Changes of cerebral blood flow, mean arterial pressure, intracranial pressure, and cerebral oxygen tension during impaired cerebral autoregulation and intact cerebral autoregulation[48]
    Cerebral blood flow images before and after mechanical thrombectomy and cerebral blood flow monitoring before, during, and after internal carotid artery recanalization[49]
    Fig. 9. Cerebral blood flow images before and after mechanical thrombectomy and cerebral blood flow monitoring before, during, and after internal carotid artery recanalization[49]
    Time series diagrams of cerebral blood flow under the change of intrathoracic pressure[50]
    Fig. 10. Time series diagrams of cerebral blood flow under the change of intrathoracic pressure[50]
    Blood flow changes of gastrocnemius muscle tissue obtained by DCS optical probe[17]. (a)-(c) MRI images of gastrocnemius muscle; (d) diagram of DCS optical probe distance; (e) changes of blood flow in gastrocnemius muscle during cuff compression
    Fig. 11. Blood flow changes of gastrocnemius muscle tissue obtained by DCS optical probe[17]. (a)-(c) MRI images of gastrocnemius muscle; (d) diagram of DCS optical probe distance; (e) changes of blood flow in gastrocnemius muscle during cuff compression
    Typical muscle hemodynamic responses during bi-femoral artery bypass graft in a patient with peripheral arterial disease(PAD)[51]. (a) rBF in left calf muscle; (b) rBF in right calf muscle
    Fig. 12. Typical muscle hemodynamic responses during bi-femoral artery bypass graft in a patient with peripheral arterial disease(PAD)[51]. (a) rBF in left calf muscle; (b) rBF in right calf muscle
    Comparison results in a PAD patient before and after 3-month exercise training[52]. (a) Changes of tissue blood flow three months ago; (b) changes of tissue blood flow under treadmill exercise load test after three months; (c) box diagram of tissue blood flow changes in exercise group and control group before and after three months
    Fig. 13. Comparison results in a PAD patient before and after 3-month exercise training[52]. (a) Changes of tissue blood flow three months ago; (b) changes of tissue blood flow under treadmill exercise load test after three months; (c) box diagram of tissue blood flow changes in exercise group and control group before and after three months
    Changes of gastrocnemius parameters in exercise group and control group of a PAD patient before and after three months[53]. (a) Metabolic rate of oxygen (rMRO2); (b) relative blood flow (rF); (c) tissue oxygen saturation (rStO2)
    Fig. 14. Changes of gastrocnemius parameters in exercise group and control group of a PAD patient before and after three months[53]. (a) Metabolic rate of oxygen (rMRO2); (b) relative blood flow (rF); (c) tissue oxygen saturation (rStO2)
    Changes of muscle BFI and StO2 during the cycling exercise[54]. (a) Schematic of riding; (b) muscle BFI and StO2 for a representative subject during the cycling exercise
    Fig. 15. Changes of muscle BFI and StO2 during the cycling exercise[54]. (a) Schematic of riding; (b) muscle BFI and StO2 for a representative subject during the cycling exercise
    Tissue blood flow monitoring of neck/head tumor[55-56]. (a) Position diagram of hand-held detection probe; (b) average tumor rBF changes in patients with head and neck cancer after radiotherapy
    Fig. 16. Tissue blood flow monitoring of neck/head tumor[55-56]. (a) Position diagram of hand-held detection probe; (b) average tumor rBF changes in patients with head and neck cancer after radiotherapy
    Box diagrams of breast tissue blood flow index changes during the neoadjuvant chemotherapy (NAC) treatment[57]. (a) Healthy breast; (b) tumor breast
    Fig. 17. Box diagrams of breast tissue blood flow index changes during the neoadjuvant chemotherapy (NAC) treatment[57]. (a) Healthy breast; (b) tumor breast
    ItemPETSPECTXeCTCT-PDSC-MRIASL-MRIDUDCS
    Age rangeA,CA,CA,CA,CA,CA,C,NA,C,NA,C,N
    BedsideNoSometimesNoNoNoNoYesYes
    Contrast agentYesYesYesYesYesNoNoNo
    RadiationYesYesYesYesNoNoNoNo
    Acquision time5-9 min10-15 min10 min40 s1 min5-10 min1-20 min0.5-6 s
    ParametersCBFCBFCBFMTTMTTCBFBFVCBF
    Large vesselOkOkOkProblemProblemOkONLYMicrovascular
    QuantitativeYesSometimesYesYesN/AYesN/ARelative
    Brain coverageWholeWhole6 cm thick5 cm thickWholeWhole~3/hemisphere~Few/hemisphere
    Spatial resolution~5 mm~5 mm~5 mm~1.5 mm~2 mm~2 mmN/A~10 mm
    Intrascan time10 min10 min20 min10 min25 min0 min0 min0 min
    Emergency settingNoSometimesYesYesYesYesYesYes
    Instrument costHighHighModerateModerateHighHighLowLow
    Table 1. Comparison of tissue blood flow monitoring methods[65]
    Zhe Li, Jinchao Feng, Kebin Jia. Diffusion Correlation Spectroscopy for Tissue Blood Flow Monitoring and Its Clinical Applications[J]. Laser & Optoelectronics Progress, 2022, 59(6): 0617006
    Download Citation