• Journal of Semiconductors
  • Vol. 41, Issue 12, 122501 (2020)
Zhiguo Sun1, Bo Cai1, Xi Chen1, Wenxian Wei2, Xiaoming Li1, Dandan Yang1, Cuifang Meng1, Ye Wu1, and Haibo Zeng1
Author Affiliations
  • 1MIIT Key Laboratory of Advanced Display Materials and Devices, Institute of Optoelectronics & Nanomaterials, College of Materials Science and Engineering, Nanjing University of Science and Technology, Nanjing 210094, China
  • 2Testing Center, Yangzhou University, Yangzhou 225009, China
  • show less
    DOI: 10.1088/1674-4926/41/12/122501 Cite this Article
    Zhiguo Sun, Bo Cai, Xi Chen, Wenxian Wei, Xiaoming Li, Dandan Yang, Cuifang Meng, Ye Wu, Haibo Zeng. Prediction and observation of defect-induced room-temperature ferromagnetism in halide perovskites[J]. Journal of Semiconductors, 2020, 41(12): 122501 Copy Citation Text show less
    (Color online) Crystal and electronic structure characterizations. High-resolution TEM images of CsPb1–xNixBr3 nanocrystals with (a) x = 0 and (b) x = 0.31%. The insets show corresponding low-resolution TEM images. (c) XRD patterns of CsPb1–xNixBr3 nanocrystals with variant x values. The bottom blue vertical lines index the XRD patterns of CsPbBr3 with a cubic-phase structure (PDF#54-0752). The enlarged view of the XRD spectra near 2θ = 21.5º is also shown. (d) X-ray photoelectron spectroscopy of the Ni 2p level in CsPb1–xNixBr3 with x = 0.31%. (e) Photoluminescence spectra of RT-synthesized CsPb1–xNixBr3 nanocrystals with different x, measured at 300 K. (f) The ESR spectra of CsPb1–xNixBr3 nanocrystals with x = 0 and 0.31%, measured at 300 K. 1 Oe = 0.1 mT. All samples used here were RT-synthesized.
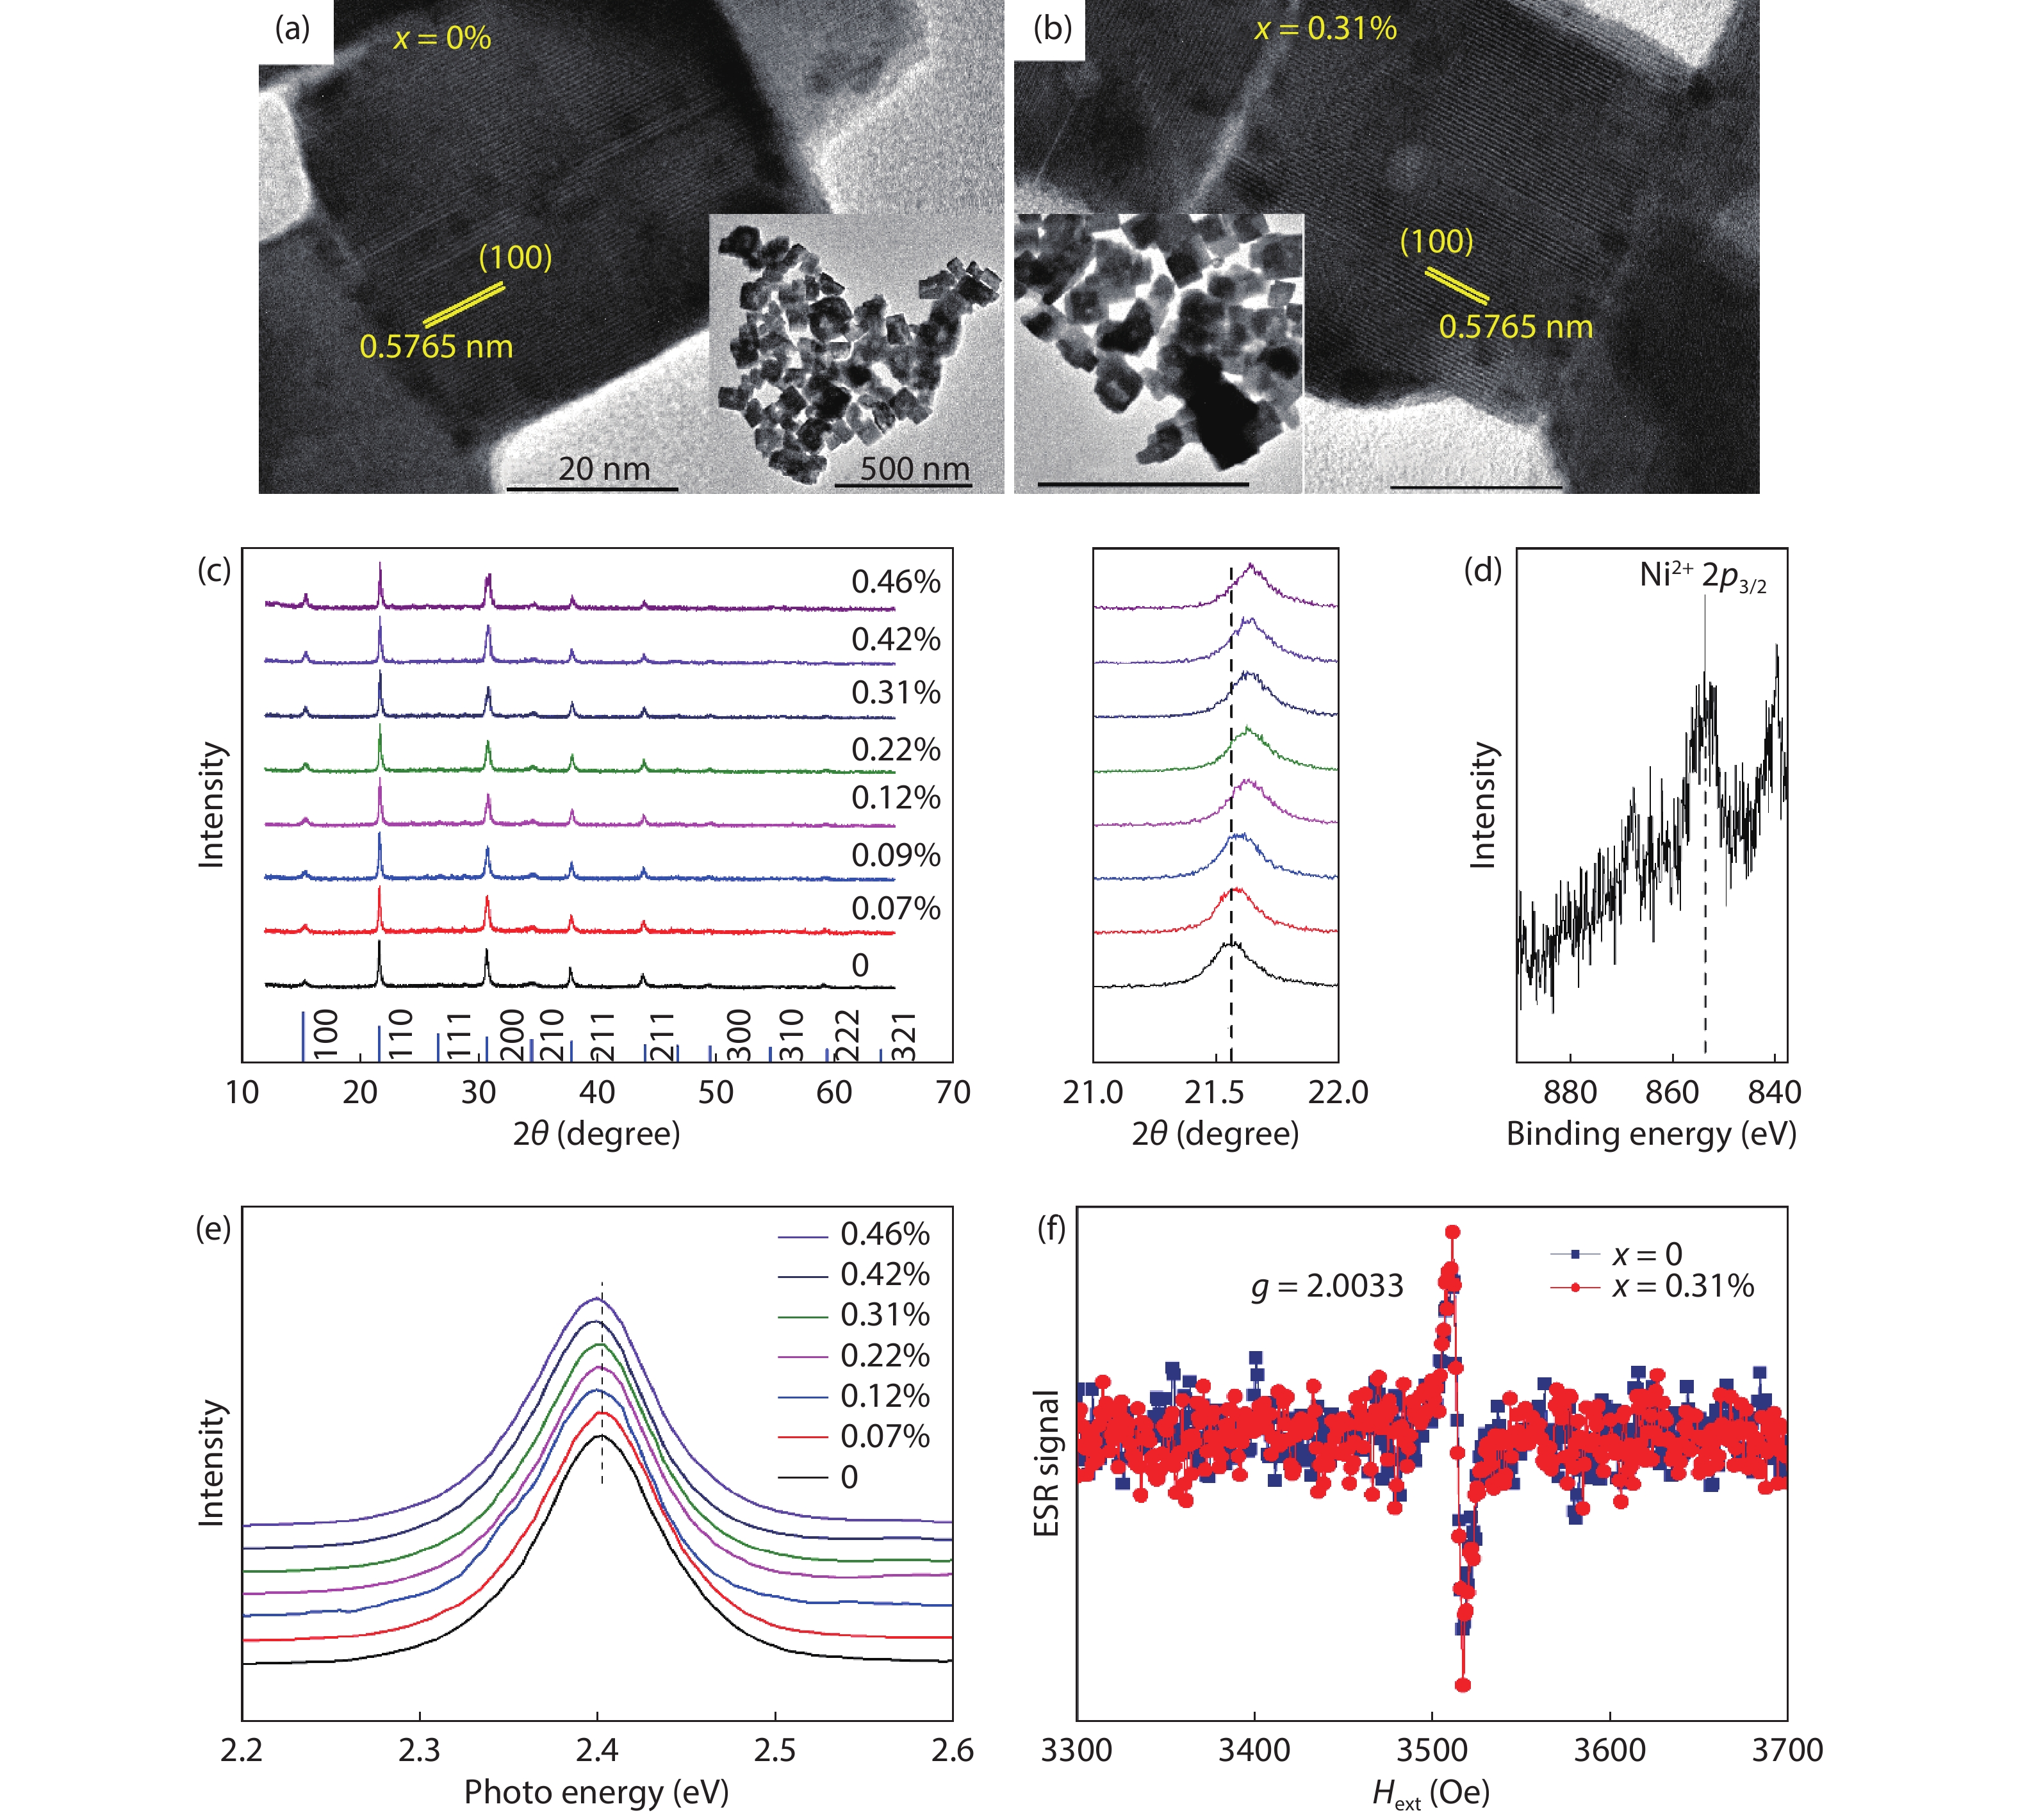
    Fig. 1. (Color online) Crystal and electronic structure characterizations. High-resolution TEM images of CsPb1–xNixBr3 nanocrystals with (a) x = 0 and (b) x = 0.31%. The insets show corresponding low-resolution TEM images. (c) XRD patterns of CsPb1–xNixBr3 nanocrystals with variant x values. The bottom blue vertical lines index the XRD patterns of CsPbBr3 with a cubic-phase structure (PDF#54-0752). The enlarged view of the XRD spectra near 2θ = 21.5º is also shown. (d) X-ray photoelectron spectroscopy of the Ni 2p level in CsPb1–xNixBr3 with x = 0.31%. (e) Photoluminescence spectra of RT-synthesized CsPb1–xNixBr3 nanocrystals with different x, measured at 300 K. (f) The ESR spectra of CsPb1–xNixBr3 nanocrystals with x = 0 and 0.31%, measured at 300 K. 1 Oe = 0.1 mT. All samples used here were RT-synthesized.
    (Color online) First-principle calculations. (a) The 3 × 3 × 3 CsPbBr3 supercells used in DFT calculations. Left: perfect lattice, where the Br atom indicated by the blue arrow will be removed to create a VBr. Right: relaxed lattice with the presence of a VBr. (b) DCD of the perfect (left) and defective (right) CsPbBr3. High (low) charge density corresponds to charge accumulation (depletion) regimes. (c) Spin-resolved total and partial DOSs of the perfect and defective CsPbBr3 supercells.
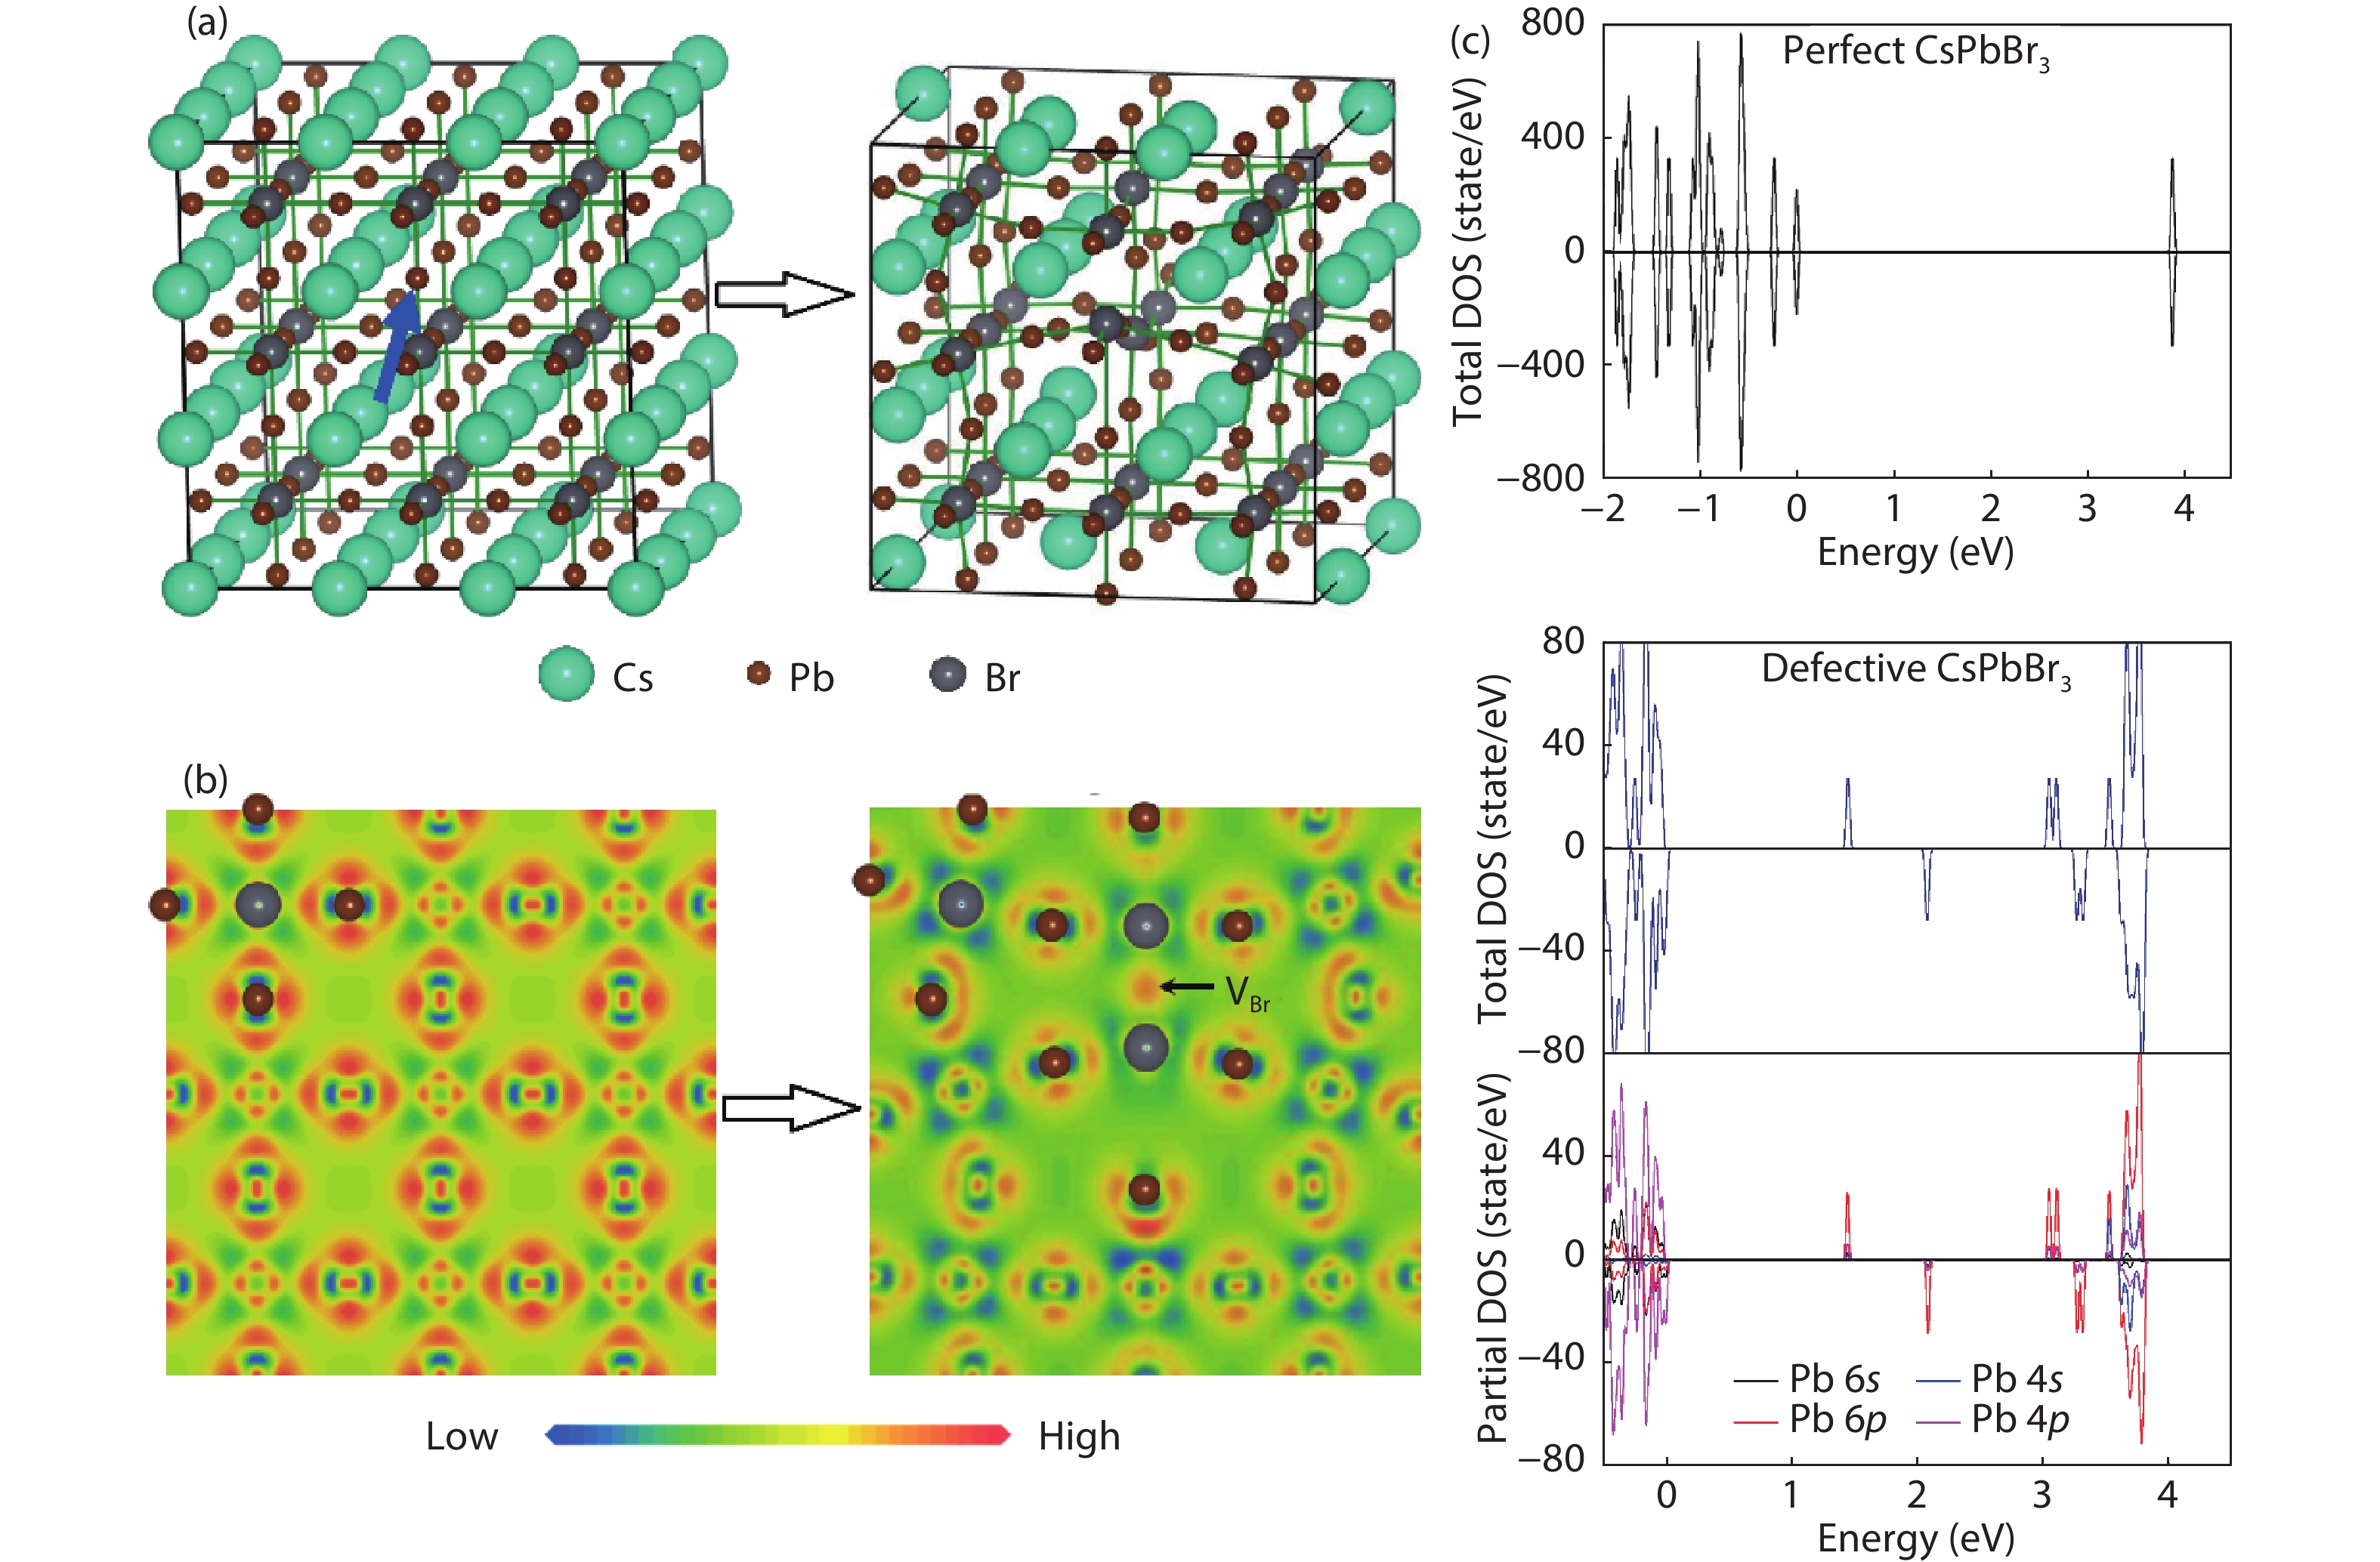
    Fig. 2. (Color online) First-principle calculations. (a) The 3 × 3 × 3 CsPbBr3 supercells used in DFT calculations. Left: perfect lattice, where the Br atom indicated by the blue arrow will be removed to create a VBr. Right: relaxed lattice with the presence of a VBr. (b) DCD of the perfect (left) and defective (right) CsPbBr3. High (low) charge density corresponds to charge accumulation (depletion) regimes. (c) Spin-resolved total and partial DOSs of the perfect and defective CsPbBr3 supercells.
    (Color online) Magnetic properties of RT-synthesized LHPs. (a) Magnetization versus Hext curves of RT-synthesized pure CsPbBr3 nanocrystals measured at several representative temperatures. The diamagnetic signals have already been subtracted. Inset shows the enlarged view of low field regimes between ±0.5 kOe. (b) Temperature dependence of Ms of pure CsPbBr3 nanocrystals. Effects of (c) OAmBr passivation, (d) OAmCl passivation, (e) OAmI passivation, and (f) OAmBr passivation on the ferromagnetism of CsPbBr3, CsPbCl3, CsPbI3, and CH3NH3PbBr3, respectively, measured at 300 K.
    Fig. 3. (Color online) Magnetic properties of RT-synthesized LHPs. (a) Magnetization versus Hext curves of RT-synthesized pure CsPbBr3 nanocrystals measured at several representative temperatures. The diamagnetic signals have already been subtracted. Inset shows the enlarged view of low field regimes between ±0.5 kOe. (b) Temperature dependence of Ms of pure CsPbBr3 nanocrystals. Effects of (c) OAmBr passivation, (d) OAmCl passivation, (e) OAmI passivation, and (f) OAmBr passivation on the ferromagnetism of CsPbBr3, CsPbCl3, CsPbI3, and CH3NH3PbBr3, respectively, measured at 300 K.
    (Color online) 3d dopant effects on the magnetic properties of CsPbBr3. (a) Magnetization versus Hext curves of RT-synthesized CsPbBr3 nanocrystals doped with 1.7% Mn, 0.54% Fe, 0.87% Co, 0.31% Ni, 0.35% Cu, and 0.86% Zn, measured at 300 K. (b) Ms of the magnetization curves presented in (a). (c) Magnetization versus Hext curves of RT-synthesized CsPb1–xNixBr3 nanocrystals with x = 0, 0.12%, 0.31%, and 0.46%, measured at 300 K. Inset shows the x dependence of Ms. (d) Magnetization versus Hext curves of RT-synthesized CsPb1–xNixBr3 nanocrystals with x = 0.31% at measuring temperatures of 4, 100, 200, 300, and 400 K. The diamagnetic signals have already been subtracted.
    Fig. 4. (Color online) 3d dopant effects on the magnetic properties of CsPbBr3. (a) Magnetization versus Hext curves of RT-synthesized CsPbBr3 nanocrystals doped with 1.7% Mn, 0.54% Fe, 0.87% Co, 0.31% Ni, 0.35% Cu, and 0.86% Zn, measured at 300 K. (b) Ms of the magnetization curves presented in (a). (c) Magnetization versus Hext curves of RT-synthesized CsPb1–xNixBr3 nanocrystals with x = 0, 0.12%, 0.31%, and 0.46%, measured at 300 K. Inset shows the x dependence of Ms. (d) Magnetization versus Hext curves of RT-synthesized CsPb1–xNixBr3 nanocrystals with x = 0.31% at measuring temperatures of 4, 100, 200, 300, and 400 K. The diamagnetic signals have already been subtracted.
    (Color online) Schematic of vacancy-induced ferromagnetism. A donor electron associated with a VBr polarizes the surrounding lattices within its hydrogenic orbital, leading to the formation of a magnetic polaron (gray circles). Due to the shallow nature of the VBr, the magnetic polarons have extended wave functions. As a result, the overlap of the magnetic polarons aligns the spins of the VBr (red arrows) via exchange coupling, producing long-range spin ordering (i.e., ferromagnetism). Regarding a Ni2+ ion with a 3d8 subshell, the only unoccupied 3d orbitals available are in the eg level. Therefore, the exchange coupling between the Ni2+ spins (blue arrows) and the VBr spins is antiferromagnetic. Nonetheless, the exchange coupling between two VBr mediated by a same Ni2+ ion is ferromagnetic. Note here that the Cs ions are not shown, and that the sizes of the magnetic polarons are not scaled to their calculated values (see the Discussion section of the main text).
    Fig. 5. (Color online) Schematic of vacancy-induced ferromagnetism. A donor electron associated with a VBr polarizes the surrounding lattices within its hydrogenic orbital, leading to the formation of a magnetic polaron (gray circles). Due to the shallow nature of the VBr, the magnetic polarons have extended wave functions. As a result, the overlap of the magnetic polarons aligns the spins of the VBr (red arrows) via exchange coupling, producing long-range spin ordering (i.e., ferromagnetism). Regarding a Ni2+ ion with a 3d8 subshell, the only unoccupied 3d orbitals available are in the eg level. Therefore, the exchange coupling between the Ni2+ spins (blue arrows) and the VBr spins is antiferromagnetic. Nonetheless, the exchange coupling between two VBr mediated by a same Ni2+ ion is ferromagnetic. Note here that the Cs ions are not shown, and that the sizes of the magnetic polarons are not scaled to their calculated values (see the Discussion section of the main text).
    Zhiguo Sun, Bo Cai, Xi Chen, Wenxian Wei, Xiaoming Li, Dandan Yang, Cuifang Meng, Ye Wu, Haibo Zeng. Prediction and observation of defect-induced room-temperature ferromagnetism in halide perovskites[J]. Journal of Semiconductors, 2020, 41(12): 122501
    Download Citation