• Journal of Semiconductors
  • Vol. 41, Issue 9, 091709 (2020)
Aizhen Liao1, Huichao He3, Yong Zhou2、4, and Zhigang Zou2、4
Author Affiliations
  • 1School of Science, Xi'an University of Posts and Telecommunications, Xi'an 710121, China
  • 2National Laboratory of Solid-State Microstructures, Collaborative Innovation Center of Advanced Microstructures, School of Physics and School of Engineering and Applied Science, Nanjing University, Nanjing 210093, China
  • 3State Key Laboratory of Environmental-Friendly Energy Materials, School of Materials Science and Engineering, Southwest University of Science and Technology, Mianyang 621010, China
  • 4Ecomaterials and Renewable Energy Research Center, School of Physics, Nanjing University, Nanjing 210093, China
  • show less
    DOI: 10.1088/1674-4926/41/9/091709 Cite this Article
    Aizhen Liao, Huichao He, Yong Zhou, Zhigang Zou. Typical strategies to facilitate charge transfer for enhanced oxygen evolution reaction: Case studies on hematite[J]. Journal of Semiconductors, 2020, 41(9): 091709 Copy Citation Text show less
    (Color online) Schematic of water splitting in photoanode-based PEC cell.
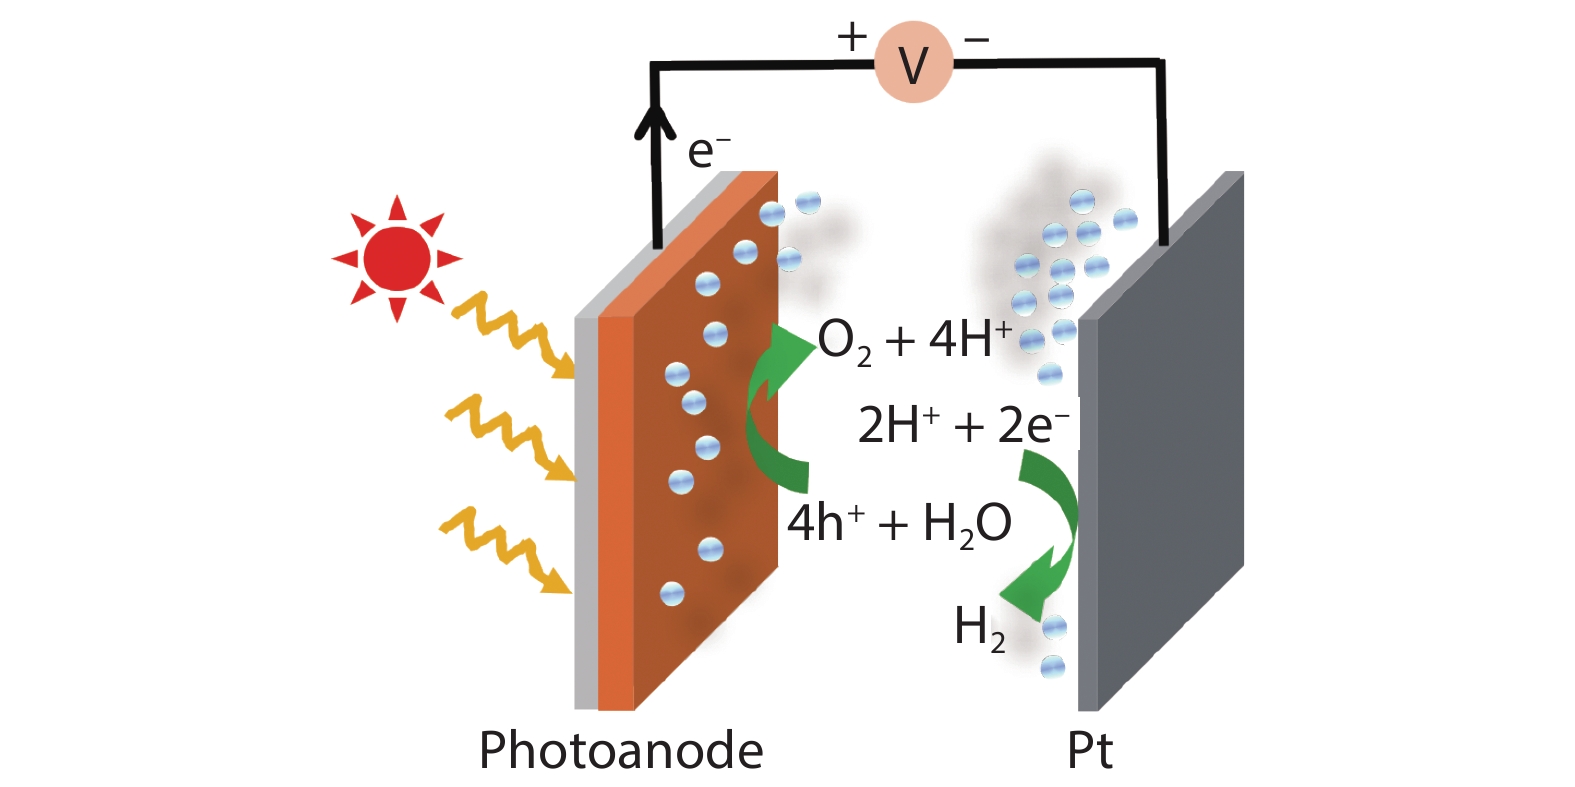
    Fig. 1. (Color online) Schematic of water splitting in photoanode-based PEC cell.
    (Color online) Ultimate photocurrent density and corresponding maximum STH of some semiconductors.
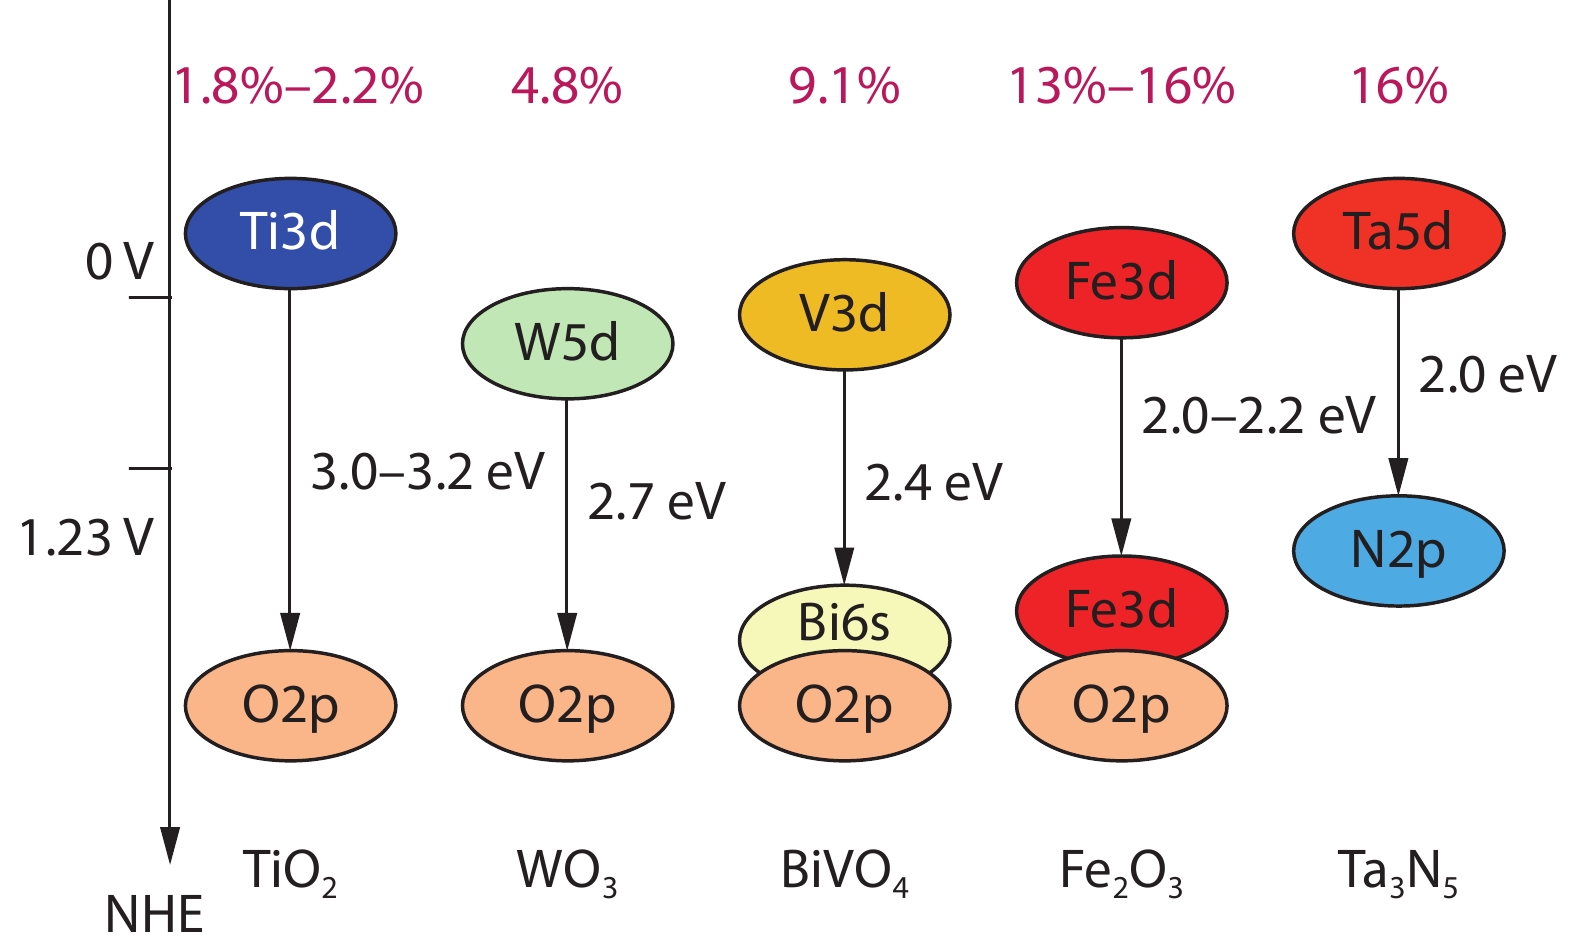
    Fig. 2. (Color online) Ultimate photocurrent density and corresponding maximum STH of some semiconductors.
    (Color online) Comparison of electron–hole recombination in planar and 1D Fe2O3 nanorods arrays electrode.
    Fig. 3. (Color online) Comparison of electron–hole recombination in planar and 1D Fe2O3 nanorods arrays electrode.
    (Color online) (a–c) SEM and (d) TEM images of obtained Fe2O3 by a facile rapid dehydration strategy (RD-Fe2O3). (e) Current density–voltage curves of obtained Fe2O3 by a conventional temperature-rising route (C-Fe2O3) and RD-Fe2O3 collected at 10 mV/s in 1.0 M KOH aqueous electrolyte under AM 1.5G illumination and in the dark. The solid and dashed lines represent the data collected under back (solid lines) and front (dashed lines) illuminations, respectively. Reproduced from Ref. [36].
    Fig. 4. (Color online) (a–c) SEM and (d) TEM images of obtained Fe2O3 by a facile rapid dehydration strategy (RD-Fe2O3). (e) Current density–voltage curves of obtained Fe2O3 by a conventional temperature-rising route (C-Fe2O3) and RD-Fe2O3 collected at 10 mV/s in 1.0 M KOH aqueous electrolyte under AM 1.5G illumination and in the dark. The solid and dashed lines represent the data collected under back (solid lines) and front (dashed lines) illuminations, respectively. Reproduced from Ref. [36].
    (Color online) (a) Mott–Schottky (M–S) plots measured in 1 M NaOH solution. Conditions: 1 kHz frequency. (b) J–V curves of Sn-doped (green), Sn, Zr-doped α-Fe2O3(blue), and Sn, Zr-doped α-Fe2O3-NiOOH (red) in the dark and under illumination. Reproduced from ref 18. (c) M–S plots of undoped, Si-doped, Ti-doped, and co-doped α-Fe2O3 films at the frequency of 1000 Hz. (d) J–V characteristics of the undoped, Si-doped, Ti-doped, and codoped films in 1 M NaOH under 500 W full arc xenon lamp, the green line indicates dark currents of all the films. The inset is IPCE performance for the four α-Fe2O3 films mentioned above at 0.6 V vs. Ag/AgCl in 1 M NaOH. Reproduced from Ref. [56].
    Fig. 5. (Color online) (a) Mott–Schottky (M–S) plots measured in 1 M NaOH solution. Conditions: 1 kHz frequency. (b) J–V curves of Sn-doped (green), Sn, Zr-doped α-Fe2O3(blue), and Sn, Zr-doped α-Fe2O3-NiOOH (red) in the dark and under illumination. Reproduced from ref 18. (c) MS plots of undoped, Si-doped, Ti-doped, and co-doped α-Fe2O3 films at the frequency of 1000 Hz. (d) J–V characteristics of the undoped, Si-doped, Ti-doped, and codoped films in 1 M NaOH under 500 W full arc xenon lamp, the green line indicates dark currents of all the films. The inset is IPCE performance for the four α-Fe2O3 films mentioned above at 0.6 V vs. Ag/AgCl in 1 M NaOH. Reproduced from Ref. [56].
    (Color online) Comparison of the band structure of an n-type semiconductor photoanode in the presence and the absence of passivation layers inside a PEC cell. (a) High charge recombination at surface defects and inefficient water oxidation by the photogenerated holes. (b) Use of an OER catalyst layer, which promotes facile hole transfer across the interface to the electrolyte for improving water oxidation. (c) Use of thin non-catalytic passivation layers which suppress surface recombination and improve water oxidation.
    Fig. 6. (Color online) Comparison of the band structure of an n-type semiconductor photoanode in the presence and the absence of passivation layers inside a PEC cell. (a) High charge recombination at surface defects and inefficient water oxidation by the photogenerated holes. (b) Use of an OER catalyst layer, which promotes facile hole transfer across the interface to the electrolyte for improving water oxidation. (c) Use of thin non-catalytic passivation layers which suppress surface recombination and improve water oxidation.
    (Color online) (a) J–V curves of a bare hematite electrode (red solid line) and the same electrode after depositing 1 (orange dotted line), 2 (yellow short dashed line), 15 (green dashed double dotted line), 45 (teal long dashed line), and 90 (blue dashed single dotted line) mC/cm2 CoPi catalyst at 5 mV/s. (b) Proposed mechanism of the catalytic process. (c) Anodic and cathodic transient currents at an applied bias of 1.05 V vs. RHE. Reproduced from Ref. [63].
    Fig. 7. (Color online) (a) J–V curves of a bare hematite electrode (red solid line) and the same electrode after depositing 1 (orange dotted line), 2 (yellow short dashed line), 15 (green dashed double dotted line), 45 (teal long dashed line), and 90 (blue dashed single dotted line) mC/cm2 CoPi catalyst at 5 mV/s. (b) Proposed mechanism of the catalytic process. (c) Anodic and cathodic transient currents at an applied bias of 1.05 V vs. RHE. Reproduced from Ref. [63].
    (Color online) (a) Scheme of charge transfer from Fe2O3 to H2O through Ni(OH)2 and/or IrO2. (b) Chronoamperometry measurement of Ti-Fe2O3, Ti-Fe2O3/Ni(OH)2, and Ti-Fe2O3/Ni(OH)2/IrO2 under a stepped potential. Reproduced from Ref. [20].
    Fig. 8. (Color online) (a) Scheme of charge transfer from Fe2O3 to H2O through Ni(OH)2 and/or IrO2. (b) Chronoamperometry measurement of Ti-Fe2O3, Ti-Fe2O3/Ni(OH)2, and Ti-Fe2O3/Ni(OH)2/IrO2 under a stepped potential. Reproduced from Ref. [20].
    (Color online) (a) High-resolution TEM images of Fe2O3/FeB photoanode. (b) Charge separation and (c) injection efficiency at 1.23 V vs. RHE for the Fe2O3 and Fe2O3/FeB photoanodes. Reproduced from Ref. [80]. (d, e) AFM images and (f, g) the corresponding SPVM images of (d, f) Fe2O3 and (e, g) Fe2O3|VO|FexS, respectively. Scale bars in (a–d), 200 nm. (h) Histograms of the SPV distributions on the Fe2O3and Fe2O3|VO|FexS electrodes. (i) Time evolution of SPV generation and decay with light on and off on Fe2O3 and Fe2O3|VO|FexS. All the SPV signals are obtained under 450 nm laser illumination at a light intensity of 4 mW/cm2. (j) Photocurrent-potential (J–V) curves of the Fe2O3 and Fe2O3|VO|FexS photoanodes in a 1 M NaOH (pH ~ 13.6) aqueous electrolyte under AM 1.5G illumination and in the dark. Reproduced from Ref. [81].
    Fig. 9. (Color online) (a) High-resolution TEM images of Fe2O3/FeB photoanode. (b) Charge separation and (c) injection efficiency at 1.23 V vs. RHE for the Fe2O3 and Fe2O3/FeB photoanodes. Reproduced from Ref. [80]. (d, e) AFM images and (f, g) the corresponding SPVM images of (d, f) Fe2O3 and (e, g) Fe2O3|VO|FexS, respectively. Scale bars in (a–d), 200 nm. (h) Histograms of the SPV distributions on the Fe2O3and Fe2O3|VO|FexS electrodes. (i) Time evolution of SPV generation and decay with light on and off on Fe2O3 and Fe2O3|VO|FexS. All the SPV signals are obtained under 450 nm laser illumination at a light intensity of 4 mW/cm2. (j) Photocurrent-potential (J–V) curves of the Fe2O3 and Fe2O3|VO|FexS photoanodes in a 1 M NaOH (pH ~ 13.6) aqueous electrolyte under AM 1.5G illumination and in the dark. Reproduced from Ref. [81].
    (Color online) Schematic illustration of (a) the type-II heterostructure, (b) p–n heterostructure, and (c) Z-scheme system without electron-mediators band alignments, and the correspondingly possible separation and transfer process of photoinduced electron–hole pairs of semiconductor photocatalysts. Reproduced from Refs. [92, 93].
    Fig. 10. (Color online) Schematic illustration of (a) the type-II heterostructure, (b) p–n heterostructure, and (c) Z-scheme system without electron-mediators band alignments, and the correspondingly possible separation and transfer process of photoinduced electron–hole pairs of semiconductor photocatalysts. Reproduced from Refs. [92, 93].
    (Color online) Schematic for the energy band structure of the Fe2O3-NA/RGO/BiV1–xMoxO4 heterojunction and the proposed mechanism of PEC water splitting. Reproduced from Ref. [105].
    Fig. 11. (Color online) Schematic for the energy band structure of the Fe2O3-NA/RGO/BiV1–xMoxO4 heterojunction and the proposed mechanism of PEC water splitting. Reproduced from Ref. [105].
    (Color online) (a) TiSi2 nanonet-based hematite nanostructure is essentially a core/shell arrangement where the core is the nanonet for effective charge collection and the shell is hematite for photocatalytic functionalities. The electronic band structure is shown in the enlarged cross-sectional view. (b) Low- and (c) high-magnification transmission electron microscopy (TEM) images showing the conformal coverage and crystallinity of hematite. (d) J–V curves of an Fe2O3/TiSi2 heteronanostructure and a planar hematite film. (e) IPCE comparison of Fe2O3 with and without TiSi2 nanonets. Reproduced from Ref. [116].
    Fig. 12. (Color online) (a) TiSi2 nanonet-based hematite nanostructure is essentially a core/shell arrangement where the core is the nanonet for effective charge collection and the shell is hematite for photocatalytic functionalities. The electronic band structure is shown in the enlarged cross-sectional view. (b) Low- and (c) high-magnification transmission electron microscopy (TEM) images showing the conformal coverage and crystallinity of hematite. (d) J–V curves of an Fe2O3/TiSi2 heteronanostructure and a planar hematite film. (e) IPCE comparison of Fe2O3 with and without TiSi2 nanonets. Reproduced from Ref. [116].
    Aizhen Liao, Huichao He, Yong Zhou, Zhigang Zou. Typical strategies to facilitate charge transfer for enhanced oxygen evolution reaction: Case studies on hematite[J]. Journal of Semiconductors, 2020, 41(9): 091709
    Download Citation