
Jian Li, Xinxin Zhou, Yang Xu, Lijun Qiao, Jianzhong Zhang, Mingjiang Zhang, "Slope-assisted Raman distributed optical fiber sensing," Photonics Res. 10, 205 (2022)
- Photonics Research
- Vol. 10, Issue 1, 205 (2022)
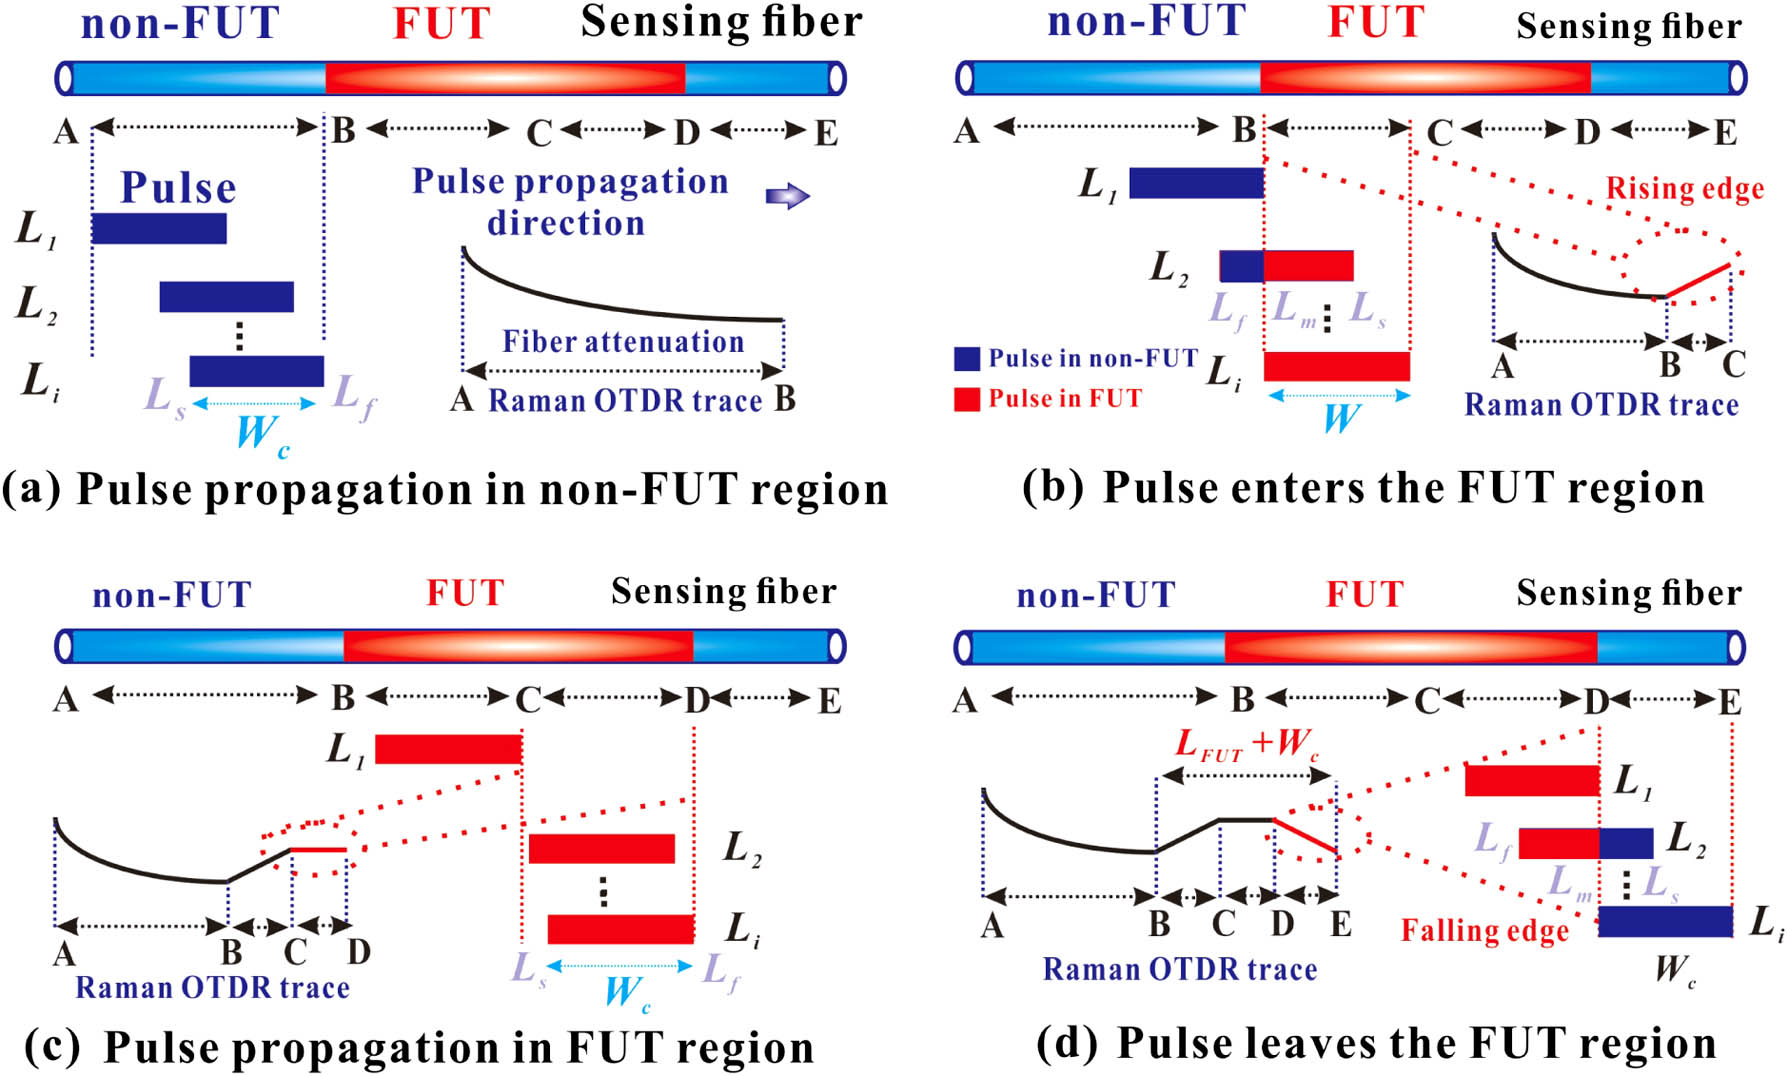
Fig. 1. Schematic diagram of the pulse transmission and characteristics of the superimposed Raman signals.
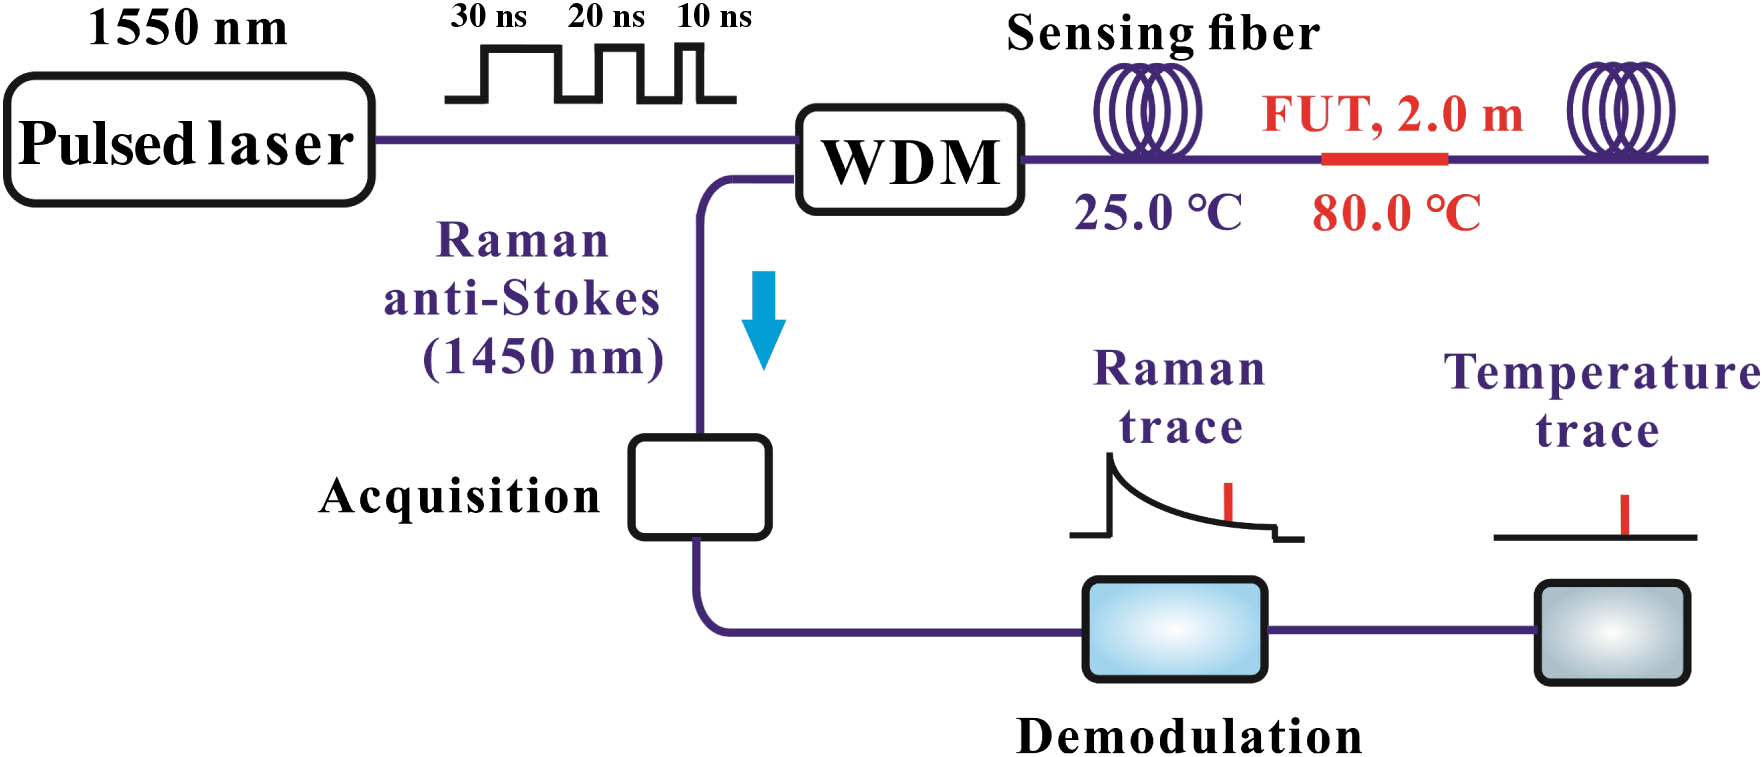
Fig. 2. Numerical simulation model.
Fig. 3. Superimposed Raman OTDR traces under different pulse widths. (a) Whole superimposed Raman OTDR traces. Superimposed Raman OTDR traces based on (b) 10 ns pulse width, (c) 20 ns pulse width, and (d) 30 ns pulse width.
Fig. 4. Schematic diagram based on the slope-assisted demodulation scheme (L FUT
Fig. 5. Experimental setup based on slope-assisted demodulation sensing.
Fig. 6. Distribution of superimposed Raman OTDR traces in the FUT region under the pulse width of (a1) 30.30 ns, (a2) 45.45 ns, and (a3) 53.03 ns. Distribution of superimposed Raman OTDR traces in the slope-assisted region under the pulse width of (b1) 30.30 ns, (b2) 45.45 ns, and (b3) 53.03 ns.
Fig. 7. Relationship between the pulse width and FUT length as measured by Raman signal.
Fig. 8. Relationship between the slope-assisted coefficients and the FUT temperature under the pulse width of (a) 30.30 ns, (b) 45.45 ns, (c) 53.03 ns, and (d) 55.56 ns.
Fig. 9. Distribution of superimposed Raman OTDR traces in the FUT region under the FUT with length of (a1) 6.0 m, (b1) 4.8 m, and (c1) 5.6 m. Distribution of superimposed Raman OTDR traces in the slope-assisted region under the FUT with length of (a2) 6.0 m, (b2) 4.8 m, and (c2) 5.6 m.
Fig. 10. Relationship between the slope-assisted coefficients and the FUT temperature under FUT lengths of (a) 2.0 m, (b) 3.0 m, and (c) 4.0 m. (d) Comparative results based on the different FUT lengths.
Fig. 11. Temperature measurement results at a centimeter-level spatial scale detected using a conventional demodulation method and the slope-assisted demodulation method. (a) Results measured using the conventional demodulation method. (b) Distribution of superimposed Raman OTDR trace after attenuation compensation. (c) Results measured using the slope-assisted coefficients.
|
Table 1. Parameters for the Superimposed Raman Signal


Set citation alerts for the article
Please enter your email address

© Copyright 2018-2021 | Chinese Laser Press. All Rights Reserved 沪ICP备15018463号-20