
Jian Li, Xinxin Zhou, Yang Xu, Lijun Qiao, Jianzhong Zhang, Mingjiang Zhang, "Slope-assisted Raman distributed optical fiber sensing," Photonics Res. 10, 205 (2022)
- Photonics Research
- Vol. 10, Issue 1, 205 (2022)
Abstract
1. INTRODUCTION
Over the last decade, distributed optical fiber sensing has increasingly attracted the attention of researchers [1–5], as it provides the ability to detect, along with sensing fiber lines, the spatial distribution of surrounding environmental quantities such as temperature [1,2], strain [3,5], vibration [6–8], magnetic fields [9], and gases [10,11]. Based on the physical quantities monitored above, distributed optical fiber sensing has been widely used in micro-/nano-sensing [12], medical treatment [13], corrosion environment detection [14], pressure sensing in harsh environments [15], hydrophone sensors [16], and other security detection fields.
Distributed optical fiber sensing based on the classification of scattering mechanisms can be divided into Rayleigh optical fiber sensing [17,18], Brillouin optical fiber sensing [19,20], and Raman optical fiber sensing [21,22]. Raman distributed fiber sensing is a typical optical fiber sensor that operates on the principle that spontaneous Raman scattering is excited by a pulsed laser in an optical fiber [23]. It has been widely used in the linear infrastructure temperature detection field owing to its advantages of fast measurement speed, simple structure, and temperature sensitivity [24]. With the help of advanced schemes, the sensing range of Raman distributed fiber sensing can reach from several kilometers [25] up to a few tens of kilometers [26]. Consequently, it can realize temperature sensing at any point along tens of kilometers of fiber. However, the temperature demodulation data is the average over an entire fiber length equal to the spatial resolution, owing to the limitations of pulse width and the principle of optical time-domain reflectometry (OTDR) [27]. Thus, the temperature detection result is much smaller than the true temperature when the detection area is smaller than the spatial resolution of the system. For example, in a temperature detection area of 1.0 cm (the temperature being approximately 200°C), the detected temperature using the conventional measurement method is 35.6°C (with a spatial resolution of 1.0 m), the measurement error reaching several hundred degrees Celsius. Consequently, the temperature values obtained can be significantly underestimated when the size of the temperature variation spot along the fiber is small. Subsequently, pre-warning of anomalous temperature points and fires could be delayed, leaving less time for fire departments to react. Therefore, temperature detection in small-scale areas is of great importance for the reliable detection of small anomalous spots in applications such as gas production [24] and fire prediction [26].
Several advanced demodulation methods have been developed to solve these problems [28–32] and can typically be divided into two categories, that is, one category which attempts to improve the spatial resolution of the system [28–30] and a second category which uses the sensing fiber as a sensing network to avoid limitations of the spatial resolution of measurement results [31,32]. In the first category, special fiber sensing [28], optical pulse coding [29], and time-domain differential correlation demodulation [30] are regarded as effective methods for optimizing the spatial resolution. For example, Liu
Sign up for Photonics Research TOC. Get the latest issue of Photonics Research delivered right to you!Sign up now
In this paper, we propose a novel optical scheme called slope-assisted sensing to improve the capability of temperature monitoring in micro-scale regions. The proposed scheme has two innovations. First, an accurate temperature measurement in a region of 1.0 cm spatial scale—even if the spatial resolution of the system was of the order of a meter—was experimentally demonstrated. The proposed scheme could eliminate expensive pulse-encoding sources and special sensing fibers compared to advanced schemes, thereby confirming the utility of the technique in practical applications. Second, the pulse transmission feature in the temperature variation area of the sensing fiber and superposition characteristics of the Raman OTDR signal were first theoretically analyzed and simulated. The equations of superimposed Raman anti-Stokes scattered signals were derived at different stages. Consequently, the theoretical analysis performed in the current study could be a useful tool for designing distributed optical fiber sensors based on the OTDR principle, such as Brillouin optical time domain reflectometry (BOTDR), Brillouin optical time-domain analysis (BOTDA), and Rayleigh-OTDR systems.
2. METHODOLOGY: PRINCIPLE AND NUMERICAL SIMULATION
A. Pulse Transmission and Superposition Characteristics of Raman Scattered Signal
First, we studied the transmission features of the pulsed laser in the temperature variation area of a sensing fiber and the superposition characteristics of the Raman scattered intensity. In Raman distributed optical fiber sensing, the positioning and acquisition of the system are based on the OTDR principle, which means that the Raman anti-Stokes scattered signal (hereafter referred to as the Raman signal) collected by the system at a certain moment comprises the superposition of the entire scattered intensity data in a section of the sensing fiber, the length of this section being related to the pulse width. The intensity collected at a position
The pulse transmission trajectory can be divided into the following four parts when the pulsed laser is transmitted in the temperature-variation region of the sensing fiber, including the fiber under test (FUT) area and non-FUT area, as shown in Fig. 1. First, the pulsed laser is transmitted in the non-FUT area (from
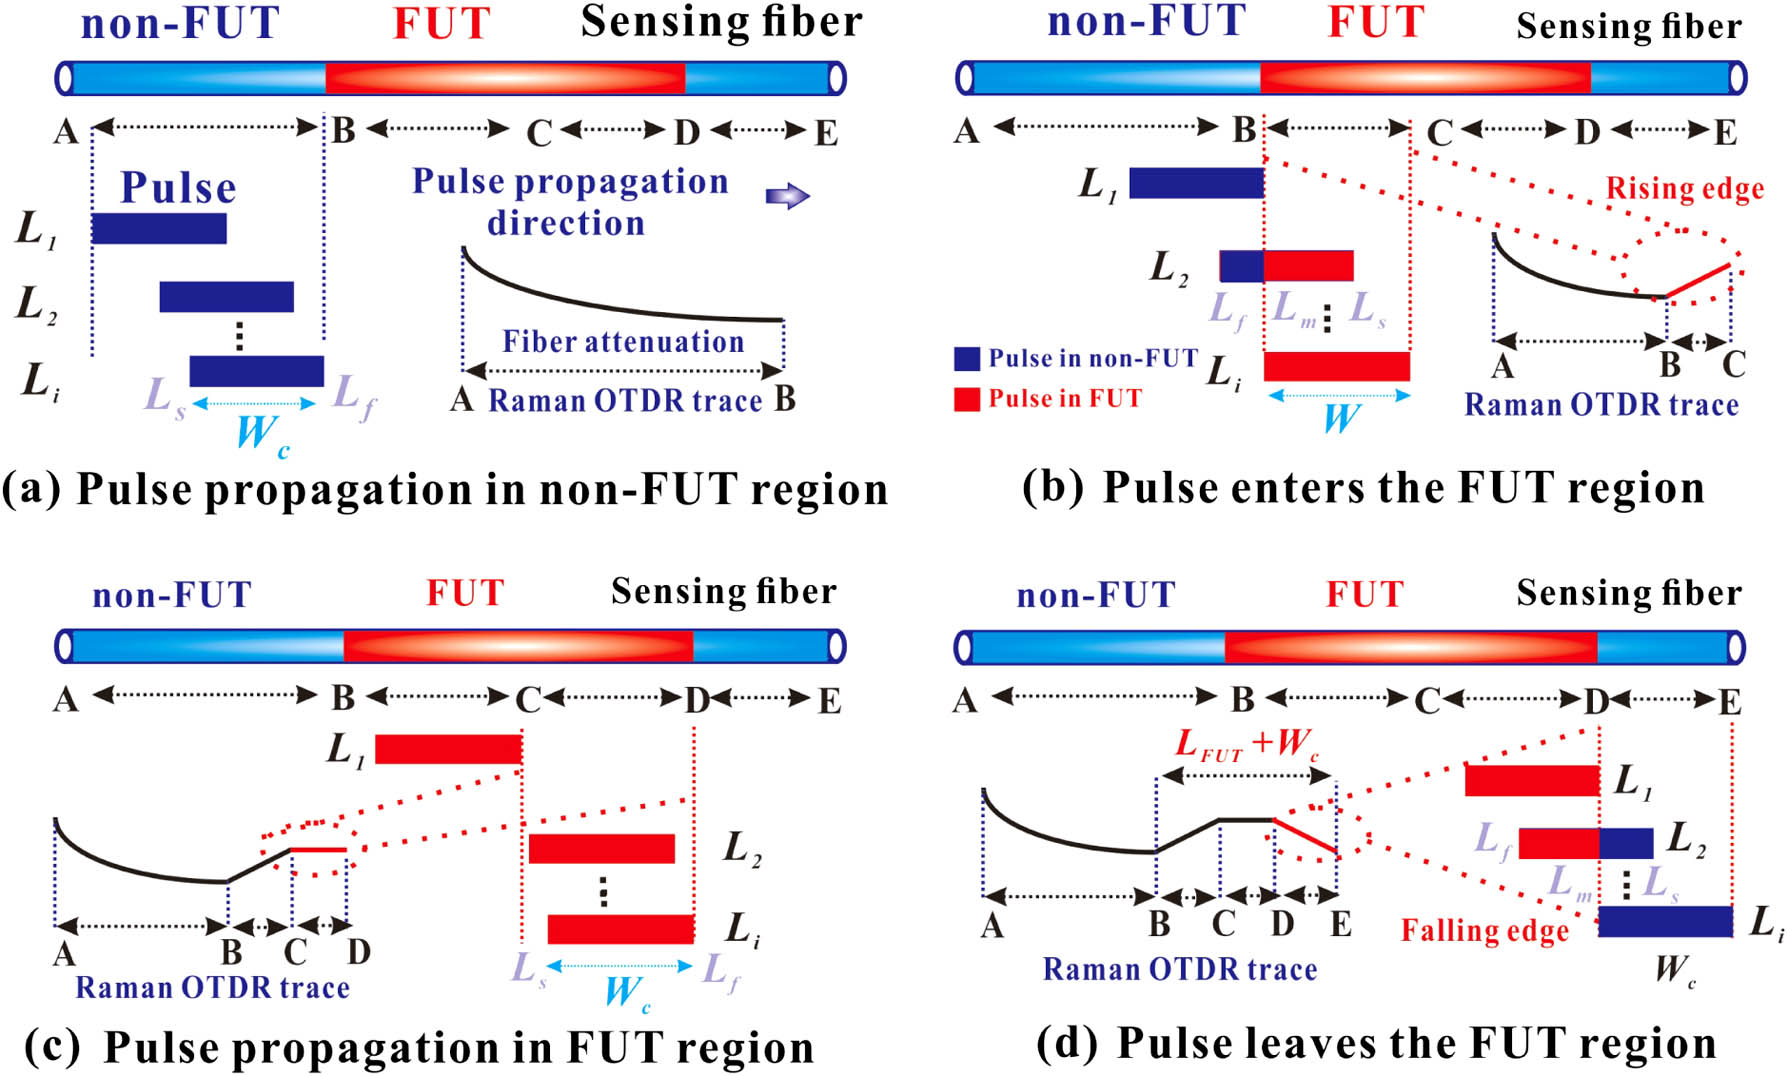
Figure 1.Schematic diagram of the pulse transmission and characteristics of the superimposed Raman signals.
The parameters for the Raman anti-Stokes signal are listed in Table 1. The superimposed intensity is related to several inherent parameters of the fiber, such as the incident power, fiber attenuation, and temperature of the non-FUT area. Because the temperature in this area remains essentially constant, the superimposed intensity of the Raman signal is dynamically modulated by the fiber attenuation, which gradually decreases with increasing sensing distance, as shown in the schematic diagram of the Raman OTDR trace in Fig. 1(a).
Parameters for the Superimposed Raman Signal
| Parameters | Symbol |
|---|---|
| Raman scattering coefficient | |
| Anti-Stokes wavelength | |
| Incident light power | |
| Temperature coefficient | |
| Attenuation coefficient | |
| Starting position of the pulse | |
| Final position of the pulse |
Furthermore, the superimposed intensity of the Raman signal contains two parts—that is, when the pulsed laser enters the FUT region (the temperature of the FUT is higher than that of the non-FUT). As shown in Fig. 1(b), the superimposed intensity includes the intensity of the FUT area (from
When the pulsed laser is completely transmitted in the FUT area (from
B. Numerical Simulation
We designed a numerical simulation model to verify the above-mentioned theories, the simulation model being shown in Fig. 2. A 10.0 km sensing fiber (with temperature of 25.0°C) was used, in which a section of 2.0 m FUT was set at a position of 10.0 km as a temperature variation region, its temperature being set at 80.0°C. Pulsed lasers of pulse-widths 30, 20, and 10 ns (and wavelength 1550 nm) were injected into the sensing fiber. The Raman anti-Stokes scattered signal (of wavelength 1450 nm) was filtered out by a wavelength division multiplexer (WDM) and collected by an acquisition and demodulation system.
![]()
Figure 2.Numerical simulation model.
The simulated Raman signals are shown in Fig. 3(a). As mentioned previously, the Raman OTDR curves collected in the experiment represent the superposition of the light intensity within the pulse width scale, the superimposed intensity collected at a certain moment being related to the pulse width—that is, the wider the pulse width, the stronger the superimposed Raman intensity under the same conditions. The simulation results also confirmed that the superimposed intensity based on a pulse width of 30 ns was stronger than that based on a pulse width of 20 and 10 ns. Figure 3(b) shows the excited Raman OTDR signal based on a 10 ns pulse width. In this case, the pulse width was less than the length of the actual FUT.
![]()
Figure 3.Superimposed Raman OTDR traces under different pulse widths. (a) Whole superimposed Raman OTDR traces. Superimposed Raman OTDR traces based on (b) 10 ns pulse width, (c) 20 ns pulse width, and (d) 30 ns pulse width.
The transmission trajectory includes four stages. The first stage is the transmission of the pulsed laser in the non-FUT (from
Figures 3(c) and 3(d) show the Raman signals excited by the pulsed laser under pulse widths of 20 and 30 ns, respectively. In Fig. 3(c), the length of the FUT is 2 m, which is consistent with the spatial scale of the 20 ns pulse width. Consequently, when the entire pulsed laser is transmitted to the FUT area, the spatial scale of it is exactly the same as the spatial length of the FUT. Compared to the Raman OTDR curves excited by a pulse width of 10 ns, the transmission signal of the pulsed laser is submerged at a distance from
Based on this theoretical analysis and the simulation results, we studied the dynamic response characteristics of superimposed Raman OTDR traces with different pulse widths in the FUT region. First, the spatial length of the superimposed intensity influenced by the FUT area was longer than the actual length of the FUT area. The results showed that the spatial length of the superimposed Raman OTDR trace affected by the FUT area was the FUT length plus the pulse width. As shown in Fig. 3, the light blue areas represent the actual spatial length and position of the FUT area. This shows that the superimposed Raman OTDR signal modulated by the FUT temperature does not fully map the position and length of the actual FUT area. The true position corresponding to the falling edges of the Raman OTDR curve excited by pulse widths of 10 and 20 ns is in the non-FUT region. Based on this, we can see from Fig. 3 that the spatial spans of the rising or falling edges of the Raman OTDR traces in the FUT area are determined by the minimum value between the pulse width and FUT length.
Consequently, when the pulse width of the system is determined, the length and position of the actual FUT can be calculated using the spatial length of the rising edge of the Raman OTDR curve. Furthermore, the measurement accuracy is related to the pulse width and the FUT length. Specifically, when the pulse width is less than the length of the FUT, the region [from
C. Slope-Assisted Temperature Demodulation Scheme
We propose a slope-assisted temperature sensing scheme based on the aforementioned pulse transmission and superposition characteristics of scattering signal. In the proposed slope-assisted demodulation scheme, we defined the part of the falling edge of the Raman OTDR curve as the slope-assisted detection area. The distance span within this area is from the point when the pulse laser starts to exit from the FUT area to when it leaves the FUT area completely. In the slope-assisted detection area, the collected data includes the intensity information of the FUT and non-FUT areas. Figure 4 illustrates the principle of the slope-assisted sensing scheme. As can be surmised from Fig. 4(a), the larger the temperature difference between the FUT and non-FUT areas, the faster the Raman OTDR curve of the slope-assisted area decreases. The temperature variation causes different falling slopes in the slope-assisted region, which is the basic principle on which the proposed slope-assisted demodulation method is based.
![]()
Figure 4.Schematic diagram based on the slope-assisted demodulation scheme (
The temperature demodulation process of the slope-assisted scheme can be explained as follows: to extract the slope-assisted coefficient, the demodulation system requires at least two pieces of Raman intensity data in the slope-assisted detection area, as shown in Fig. 4(b). The superimposed intensity of the Raman signal collected at position
3. EXPERIMENTAL SETUP AND RESULTS
A. Experimental Setup
The experimental setup, based on slope-assisted Raman distributed fiber sensing, is shown in Fig. 5. The system comprised a distributed feedback (DFB) laser, semiconductor optical amplifier (SOA), WDM, high-speed data acquisition card (DAC), and avalanche photo diode (APD). The pulsed laser source (DFB laser and SOA) operated at a wavelength of approximately 1550 nm and a repetition rate of 6 kHz. Pulses with a peak optical power of 15 W were launched into the sensing fiber (graded-index multimode, 62.5/125, MMF). The backscattered light from the WDM was separated into anti-Stokes and Stokes signals, which were then detected simultaneously using low-noise APDs. Next, the electrical signals were collected by a DAC before being transmitted to a computer for further data processing.
![]()
Figure 5.Experimental setup based on slope-assisted demodulation sensing.
B. Temperature-Measurement Results Based on Slope-Assisted Demodulation
We experimentally conducted a temperature measurement based on the slope-assisted demodulation scheme. A section of the FUT (of length 5.0 m) at a position of 487.0 m was set up as the temperature variation region, the length of the entire sensing fiber being 900.0 m. Pulsed lasers of different pulse widths (30.30, 45.45, and 53.03 ns, respectively) were then injected into the FUT (5.0 m). Among them, the collected effective Raman signal excited under each pulse width was processed 10,000 times by the accumulation average. The temperature of the FUT was set at 39.77°C, 42.37°C, 48.40°C, 52.39°C, 56.36°C, and 60.55°C using a high-precision temperature chamber controller (TCC). The remaining non-FUT area was placed in a room temperature environment (25.5°C). Subsequently, the DAC and computer started collecting and demodulating the superimposed Raman signals excited along the FUT.
The Raman signals collected after attenuation compensation based on Eq. (8) are shown in Fig. 6. Figures 6(a1)–6(a3) show the superimposed Raman OTDR trace excited by the pulsed laser incident on the FUT area under different pulse widths. After attenuation compensation under constant temperature conditions, the superimposed intensity of the non-FUT region was unaffected by the pulse width. When the spatial length of the pulse width was greater than the length of the FUT—such as the pulse width with 53.03 ns—the intensity of the Raman signal in the FUT area was weaker than that of the Raman signals excited by the pulse width of 30.30 and 45.45 ns. Moreover, compared with the simulation results shown in Fig. 3, the rising and falling edges of the Raman OTDR curve in the FUT region were not smooth. This was because—owing to the light source equipment limitations—the pulsed laser injected into the FUT area was not a standard rectangular pulse signal, leading to inhomogeneity of the superimposed intensity within the spatial scale of the pulse width. In addition, the rising and falling edges of the pulsed laser affected the smoothness of the Raman OTDR curve.
![]()
Figure 6.Distribution of superimposed Raman OTDR traces in the FUT region under the pulse width of (a1) 30.30 ns, (a2) 45.45 ns, and (a3) 53.03 ns. Distribution of superimposed Raman OTDR traces in the slope-assisted region under the pulse width of (b1) 30.30 ns, (b2) 45.45 ns, and (b3) 53.03 ns.
The influence of the pulse width on the spatial scale of the superimposed Raman OTDR trace in the FUT region was investigated. As shown in Figs. 6(a1)–6(a3), the blue area represents the spatial length where the superimposed Raman signal is modulated by the FUT temperature. The experimental results confirmed the spatial length of the superimposed Raman signal affected by the FUT to be longer than the real length of the FUT area, as elaborated upon in Section 2.A. This indicates that the spatial length of the superimposed Raman signal affected by the FUT area is the FUT length plus the pulse width, as shown in Fig. 7—that is, it shows that the spatial length of the Raman scattered signal is affected by the temperature of the FUT area, the experimental results agreeing with the theoretical analysis and simulation results.
![]()
Figure 7.Relationship between the pulse width and FUT length as measured by Raman signal.
Figures 6(b1)–6(b3) show the distribution of the superimposed Raman OTDR curves in the slope-assisted region. The slope-assisted coefficients (
![]()
Figure 8.Relationship between the slope-assisted coefficients and the FUT temperature under the pulse width of (a) 30.30 ns, (b) 45.45 ns, (c) 53.03 ns, and (d) 55.56 ns.
Furthermore, the relationships between
![]()
Figure 9.Distribution of superimposed Raman OTDR traces in the FUT region under the FUT with length of (a1) 6.0 m, (b1) 4.8 m, and (c1) 5.6 m. Distribution of superimposed Raman OTDR traces in the slope-assisted region under the FUT with length of (a2) 6.0 m, (b2) 4.8 m, and (c2) 5.6 m.
The relationship between
![]()
Figure 10.Relationship between the slope-assisted coefficients and the FUT temperature under FUT lengths of (a) 2.0 m, (b) 3.0 m, and (c) 4.0 m. (d) Comparative results based on the different FUT lengths.
C. Temperature Measurement Results in a Centimeter-Level Spatial Scale
In the initial stage of a fire, the fire source is usually small, and the temperature does not increase quickly. This is the best time to extinguish it. However, the meter-level spatial resolution of the system will cause this temperature variation information to be submerged in the average temperature data within the pulse width scale. To experimentally demonstrate the measurement performance of the proposed slope-assisted method on a centimeter-level spatial scale, a micro-scale temperature measurement experiment was conducted. In the experiment, a cigarette lighter was used to heat the optical fibers—that is, it could set the temperature variation region of the FUT to 1.0 cm, as shown in Fig. 11(a), the core temperature of the flame able to reach 200°C. The pulse width of the system used in the experiment was 53.0 ns, its theoretical spatial resolution being 5.3 m. Limited by the spatial resolution, the temperature of the FUT was 36.56°C and was demodulated using a conventional demodulation method, as shown in Fig. 11(a). However, the conventional Raman demodulation method cannot accurately monitor the temperature in such a small area. Fortunately, the actual temperature signal under the same conditions can be accurately demodulated using the proposed slope-assisted scheme.
![]()
Figure 11.Temperature measurement results at a centimeter-level spatial scale detected using a conventional demodulation method and the slope-assisted demodulation method. (a) Results measured using the conventional demodulation method. (b) Distribution of superimposed Raman OTDR trace after attenuation compensation. (c) Results measured using the slope-assisted coefficients.
Figure 11(b) shows the distribution of the superimposed Raman OTDR trace after attenuation compensation. Figure 11(c) shows the slope-assisted coefficients and calculated temperature. Among them, the slope-assisted coefficients could be calculated in the slope-assisted area, being
4. CONCLUSION
A novel optical scheme for Raman distributed optical fiber sensing was proposed to improve the capability of temperature monitoring in the micro-scale region. In this work, the pulse transmission feature in the temperature variation area of the sensing fiber and the superposition characteristics of the Raman OTDR signal were first theoretically analyzed and then simulated. The results showed that the true length and position information of the FUT could be demodulated by the spatial length of the rising edge of the Raman OTDR trace. Moreover, the spatial length of the Raman OTDR trace affected by the FUT area was the FUT length plus the pulse width. This analysis was enabled by a detailed theoretical analysis of the system’s limitations and an optimization process that provided the best possible measurement performance. The theoretical analysis performed in the current study could be a useful tool for designing a distributed optical fiber sensor based on the OTDR principle, such as BOTDR, BOTDA, and Rayleigh-OTDR systems.
A slope-assisted sensing principle and scheme were also proposed and experimentally demonstrated using Raman distributed optical fiber sensing. The falling edge of the superimposed Raman OTDR curve was defined as the slope-assisted detection area in the FUT. The temperature variation information along the FUT could be demodulated using the proposed slope-assisted coefficients. The experiment showed that the slope-assisted scheme could achieve an accurate measurement in a region with centimeter-level spatial scale, even if the spatial resolution of the system was at the meter-level scale. The results obtained demonstrated a deep understanding of pulsed laser transmission and scattering signal superposition, which can lead to a significant performance improvement in optical fiber sensing. To the best of our knowledge, this is the first demonstration of Raman distributed optical fiber sensing in a centimeter-level spatial measurement region. In the future, we will further optimize the signal to noise ratio (SNR) of the system based on an optical coding modulation scheme.
References
[1] M. A. Soto, J. A. Ramírez, L. Thévenaz. Intensifying the response of distributed optical fibre sensors using 2D and 3D image restoration. Nat. Commun., 7, 10870(2016).
[2] X. Z. Sun, Z. S. Yang, X. B. Hong, S. Zaslawski, S. Wang, M. A. Soto, X. Gao, J. Wu, L. Thévenaz. Genetic-optimised aperiodic code for distributed optical fibre sensors. Nat. Commun., 11, 5774(2020).
[3] D. M. Chow, Z. Yang, M. A. Soto, L. Thévenaz. Distributed forward Brillouin sensor based on local light phase recovery. Nat. Commun., 9, 2990(2018).
[4] Z. W. Zhan, M. Cantono, V. Kamalov, A. Mecozzo, R. Muller, S. Yin, J. C. Castellanos. Optical polarization–based seismic and water wave sensing on transoceanic cables. Science, 371, 931-936(2021).
[5] Y. K. Dong, C. Pang, Z. J. Hua, D. W. Zhou, H. Y. Zhang, L. Chen, X. Y. Bao. Optomechanical time-domain analysis based on coherent forward stimulated Brillouin scattering probing. Optica, 7, 176-184(2020).
[6] Z. Zhao, H. Wu, J. Hu, K. Zhu, Y. L. Dang, Y. X. Yan, M. Tang, C. Lu. Interference fading suppression in Phi-OTDR using space-division multiplexed probes. Opt. Express, 29, 15452-15462(2021).
[7] Z. L. Zhang, Y. G. Lu, J. Q. Peng, Z. Y. Ji. Simultaneous measurement of temperature and acoustic impedance based on forward Brillouin scattering in LEAF. Opt. Lett., 46, 1776-1779(2021).
[8] J. L. Jiang, Z. N. Wang, Z. T. Wang, Z. J. Qiu, C. Y. Liu, Y. Y. Rao. Continuous chirped-wave phase-sensitive OTDR. Opt. Lett., 46, 686-688(2021).
[9] A. Leal-Junior, C. Díaz, A. Frizera, H. Lee, K. Nakamura, Y. Mizuno, C. Marques. Highly sensitive fiber-optic intrinsic electromagnetic field sensing. Adv. Photon. Res., 2, 2000078(2021).
[10] X. T. Lou, Y. B. Feng, S. H. Yang, Y. K. Dong. Ultra-wide-dynamic-range gas sensing by optical pathlength multiplexed absorption spectroscopy. Photon. Res., 9, 193-201(2021).
[11] Y. Zhao, Y. Qi, H. L. Ho, S. F. Gao, Y. Y. Wang, W. Jin. Photoacoustic Brillouin spectroscopy of gas-filled anti-resonant hollow-core optical fibers. Optica, 8, 532-538(2021).
[12] S. Xie, A. Sharma, M. Romodina, N. Joly, P. St.J. Russell. Tumbling and anomalous alignment of optically levitated anisotropic microparticles in chiral hollow-core photonic crystal fiber. Sci. Adv., 7, 6053-6062(2021).
[13] H. T. Zhu, L. W. Zhan, Q. Dai, B. Xu, Y. Chen, Y. Q. Lu, F. Xu. Self-assembled wavy optical microfiber for stretchable wearable sensor. Adv. Opt. Mater., 9, 2002206(2021).
[14] H. Chen, M. Buric, P. R. Ohodnicki, J. Nakano, B. Liu, B. T. Chorpening. Review and perspective: sapphire optical fiber cladding development for harsh environment sensing. Appl. Phys. Rev., 5, 011102(2018).
[15] X. Wang, J. F. Jiang, S. Wang, K. Liu, T. G. Liu. All-silicon dual-cavity fiber-optic pressure sensor with ultralow pressure-temperature cross-sensitivity and wide working temperature range. Photon. Res., 9, 521-529(2021).
[16] B. Lu, B. Y. Wu, J. F. Gu, J. Q. Yang, K. Gao, Z. Y. Wang, L. Ye, Q. Ye, R. H. Qu, X. B. Chen, H. W. Cai. Distributed optical fiber hydrophone based on Φ-OTDR and its field test. Opt. Express, 29, 3147-3162(2021).
[17] S. Gao, Y. Wang, W. Ding, Y. Hong, P. Wang. Conquering the Rayleigh scattering limit of silica glass fiber at visible wavelengths with a hollow-core fiber approach. Laser Photon. Rev., 14, 1900241(2020).
[18] V. Fuertes, N. Grégoire, P. Labranche, S. Gagnon, Y. Messaddeq. Engineering nanoparticle features to tune Rayleigh scattering in nanoparticles-doped optical fibers. Sci. Rep., 11, 9116(2021).
[19] Z. Zhang, Y. Lu, J. Peng, Z. Ji. Simultaneous measurement of temperature and acoustic impedance based on forward Brillouin scattering in LEAF. Opt. Lett., 46, 1776-1779(2021).
[20] Z. Li, Y. Zhou, B. Jiang, J. Zhao. Phase fluctuation cancellation for coherent detection BOTDA fiber sensors based on optical subcarrier multiplexing. Opt. Lett., 46, 757-760(2021).
[21] Z. Zhang, H. Wu, C. Zhao, M. Tang. High-performance Raman distributed temperature sensing powered by deep learning. J. Lightwave Technol., 39, 654-659(2021).
[22] Y. S. Muanenda, M. Taki, T. Nannipieri, A. Signorini, C. J. Oton, F. Zaidi, I. Toccafondo, F. Di Pasquale. Advanced coding techniques for long-range Raman/BOTDA distributed strain and temperature measurements. J. Lightwave Technol., 34, 342-350(2016).
[23] J. Li, Q. Zhang, Y. Xu, M. J. Zhang, J. Z. Zhang, L. J. Qiao, M. M. Promi, W. Tao. High-accuracy distributed temperature measurement using difference sensitive-temperature compensation for Raman-based optical fiber sensing. Opt. Express, 27, 38163-38196(2019).
[24] Y. Xu, J. Li, M. Zhang, T. Yu, B. Yan, X. Zhou, F. Yu, J. Zhang, L. Qiao, T. Wang, S. Gao. Pipeline leak detection using Raman distributed fiber sensor with dynamic threshold identification method. IEEE Sens. J., 20, 7870-7877(2020).
[25] A. Datta, H. Mamidala, D. Venkitesh, B. Srinivasan. Reference-free real-time power line monitoring using distributed anti-Stokes Raman thermometry for smart power grids. IEEE Sens. J., 20, 7044-7052(2019).
[26] J. Li, B. Q. Yan, M. J. Zhang, J. Z. Zhang, B. Q. Jin, Y. Wang, D. Wang. Long-range Raman distributed fiber temperature sensor with early warning model for fire detection and prevention. IEEE Sens. J., 19, 3711-3717(2019).
[27] J. Q. Wang, Z. Y. Li, X. L. Fu, X. Gui, J. Zhan, H. H. Wang, D. S. Jiang. High-sensing-resolution distributed hot spot detection system implemented by a relaxed pulse width. Opt. Express, 28, 16045-16056(2020).
[28] Y. Liu, L. Ma, C. Yang, W. Tong, Z. Y. He. Long-range Raman distributed temperature sensor with high spatial and temperature resolution using graded-index few-mode fiber. Opt. Express, 26, 20562-20571(2018).
[29] M. A. Soto, N. Nannipieri, A. Signorini, A. Lazzeri, F. D. Pasquale. Raman-based distributed temperature sensor with 1 m spatial resolution over 26 km SMF using low-repetition-rate cyclic pulse coding. Opt. Lett., 36, 2557-2559(2011).
[30] J. Li, X. X. Zhou, Z. T. Yin, C. Y. Wang, Y. Xu, J. Z. Zhang, M. J. Zhang. Reconstruction compression correlation demodulation for Raman optical time domain reflection. Adv. Photon. Res., 2, 2100047(2021).
[31] C. Pandian, M. Kasinathan, S. Sosamma, C. B. Rao, T. Jayakumar, N. Murali, B. Raj. Single-fiber grid for improved spatial resolution in distributed fiber optic sensor. Opt. Lett., 35, 1677-1679(2010).
[32] M. Sun, Y. Tang, S. Yang, J. Li, S. Markus, F. Dong. Fire source localization based on distributed temperature sensing by a dual-line optical fiber system. Sensors, 16, 829(2016).


Set citation alerts for the article
Please enter your email address

© Copyright 2018-2021 | Chinese Laser Press. All Rights Reserved 沪ICP备15018463号-20