
Fanran Meng, Wenxiang Zhang, Xiaojun Liu, Fei Liu, Xian Zhou, "Comparative analysis of temporal-spatial and time-frequency features for pattern recognition of φ-OTDR," Chin. Opt. Lett. 21, 040601 (2023)
- Chinese Optics Letters
- Vol. 21, Issue 4, 040601 (2023)
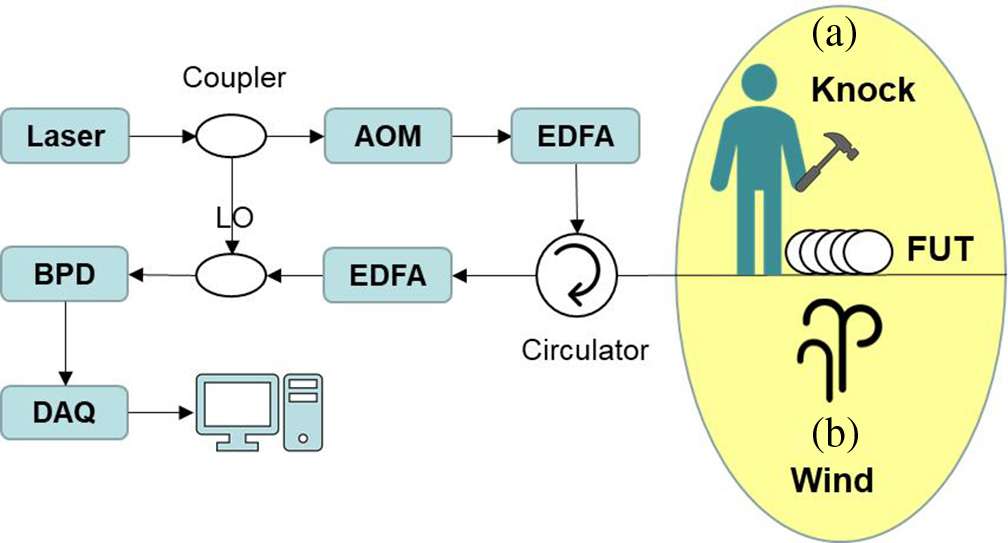
Fig. 1. Experimental setup of φ-OTDR. (a) Knocking with a hammer; (b) wind blowing. AOM, acoustic-optic modulator; EDFA, erbium-doped fiber amplifier; LO, local oscillator; BPD, balanced photodetector; DAQ, data acquisition card.
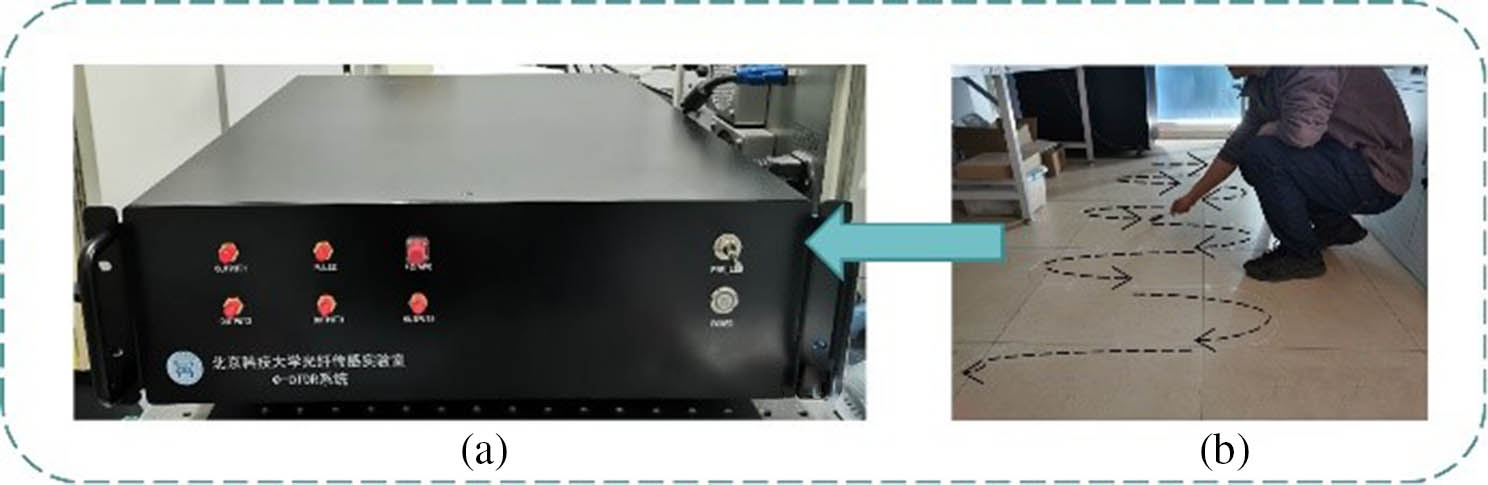
Fig. 2. (a) Developed prototype φ-OTDR instrument; (b) deployed fiber in the experiment.
Fig. 3. Flow chart of DSP.
Fig. 4. Time-domain waveform of vibration signal. (a) Knock around the fiber with a hammer; (b) wind blowing; (c) background noise.
Fig. 5. Temporal-spatial image and time-frequency image for vibration events. (a), (d) Knock around the fiber with a hammer; (b), (e) wind blowing; (c), (f) background noise.
Fig. 6. Network structure of ResNet50.
Fig. 7. Residual blocks of ResNet50.
Fig. 8. (a) Classification accuracy curve and (b) loss curve of training.
Fig. 9. Confusion matrix of (a) temporal-spatial image and (b) time-frequency image.
|
Table 1. Composition of the Data Set
| |||||||||||||||||||||
Table 2. Comparison of Training Results between Temporal-Spatial and Time-Frequency Images
| ||||||||||||||||||||||||
Table 3. Comparison of Recall and f1-Score


Set citation alerts for the article
Please enter your email address

© Copyright 2018-2021 | Chinese Laser Press. All Rights Reserved 沪ICP备15018463号-20