Author Affiliations
1College of Automation Engineering, Nanjing University of Aeronautics and Astronautics, Nanjing, Jiangsu 211100, China2College of Aeronautics, Nanjing University of Aeronautics and Astronautics, Nanjing, Jiangsu 210016, China3Nanjing Geological Survey Center, China Geological Survey, Nanjing, Jiangsu 210016, Chinashow less
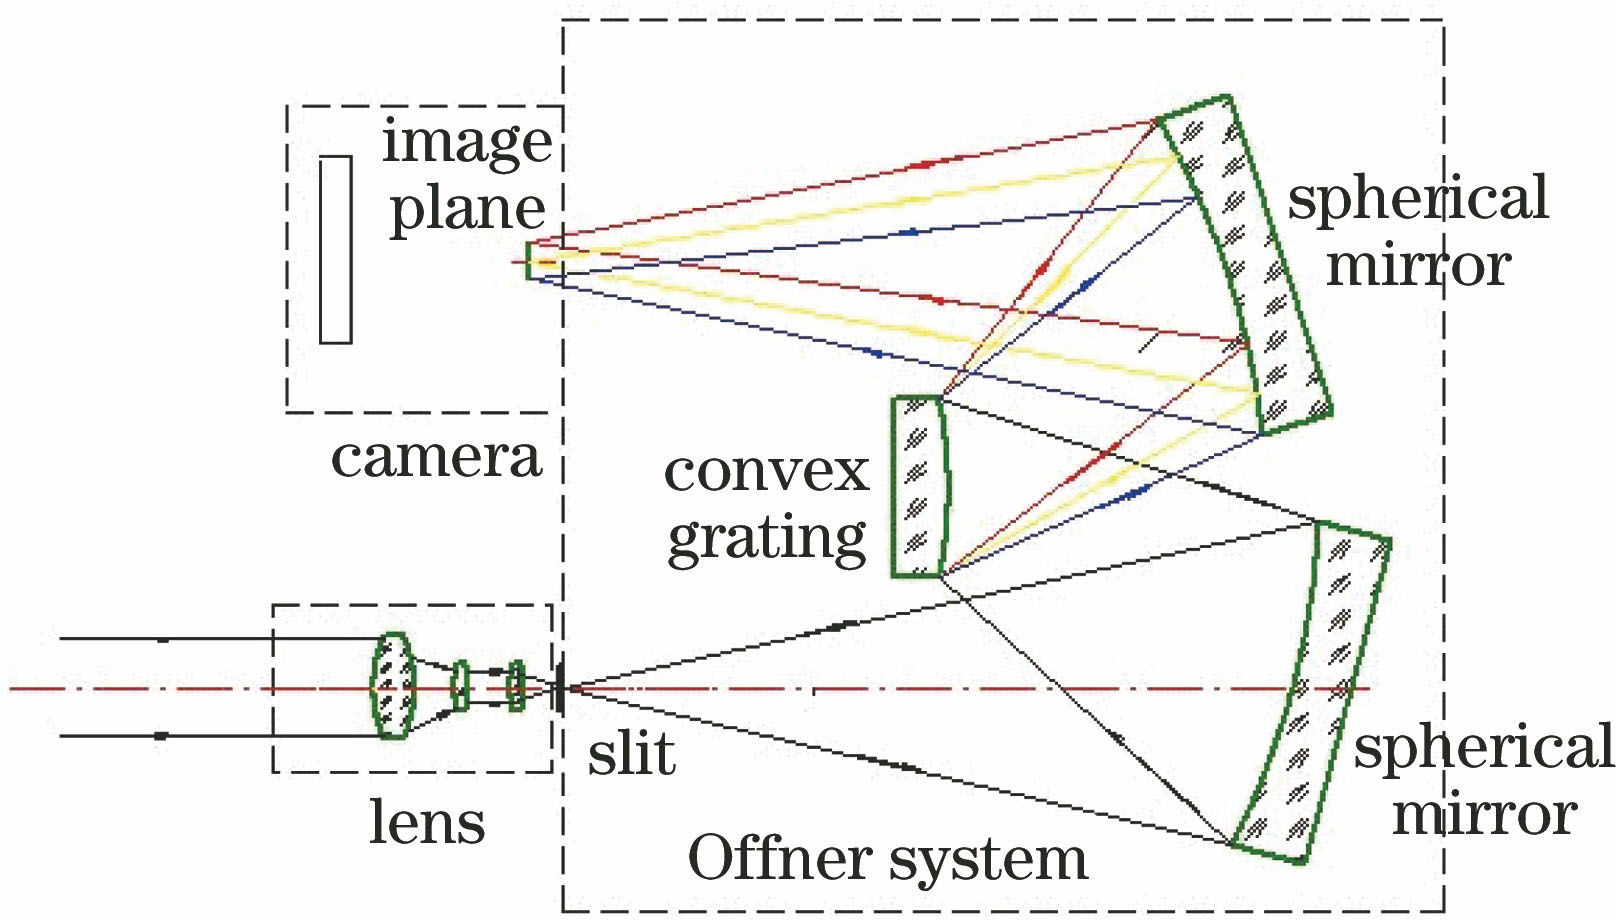
Fig. 1. Structural composition of an Offner imaging spectrometer
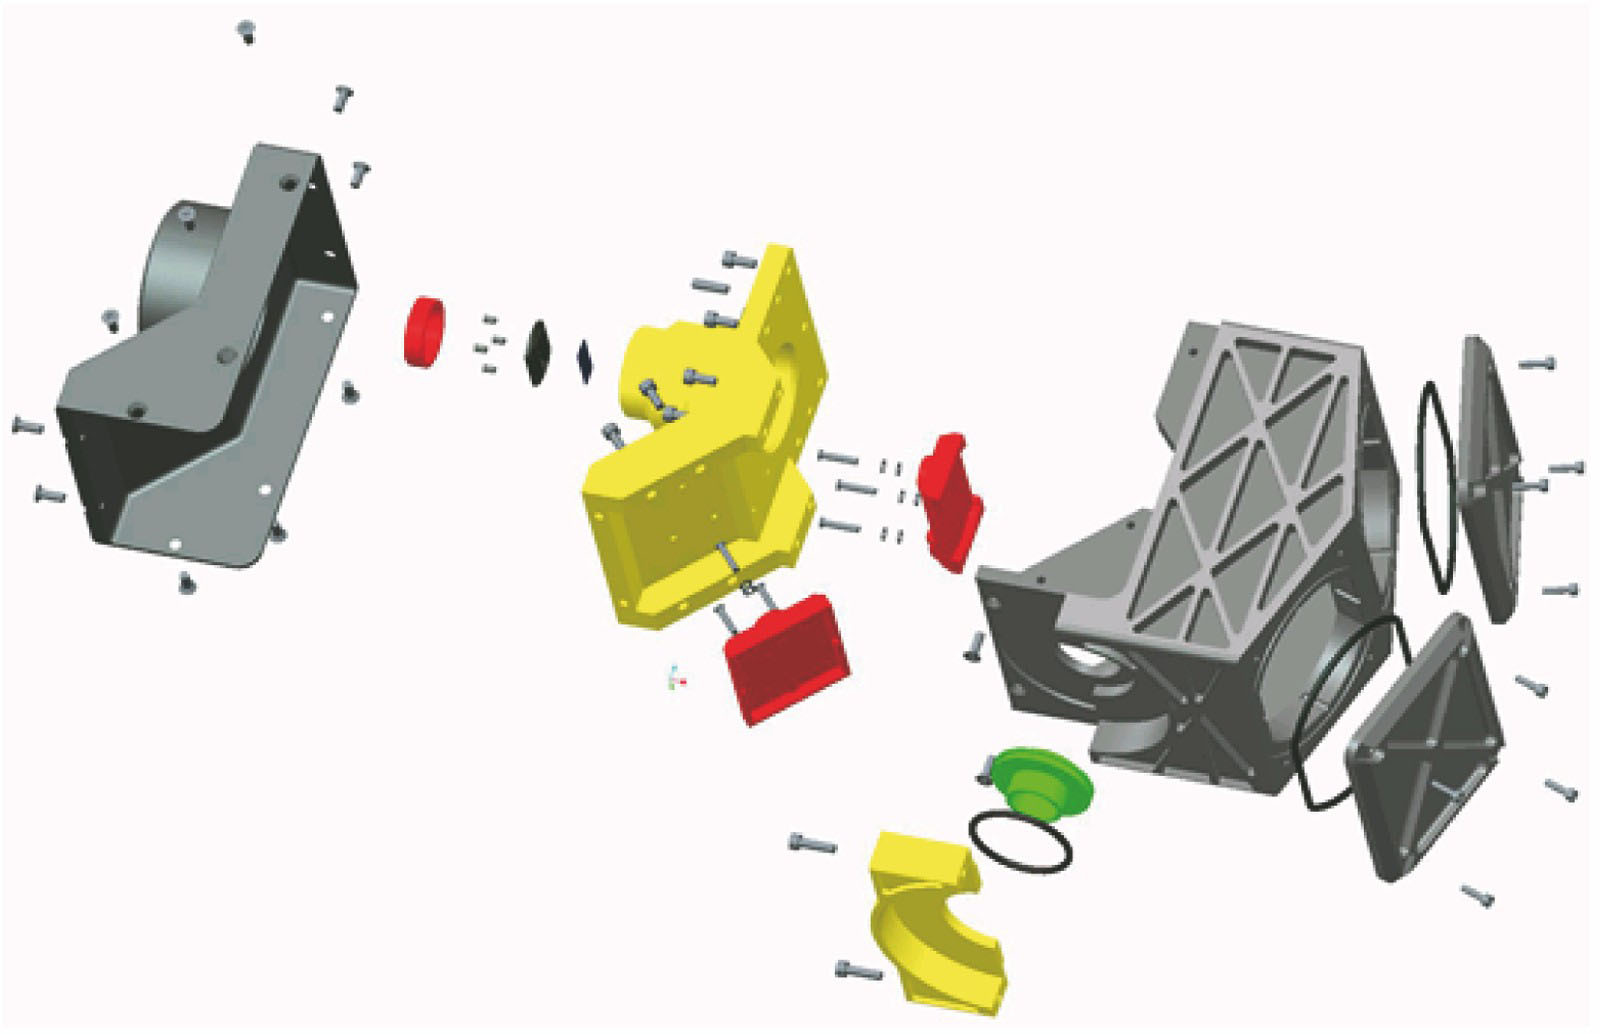
Fig. 2. Exploded view of the components
Fig. 3. Finite element model of imaging spectrometer
Fig. 4. Nature mode sharp of mechanical structure and optical elements. (a) Mechanical structure; (b) optical elements
Fig. 5. RMS values between mirrors at 0-40 ℃
Fig. 6. PV values between mirrors at 0-40 ℃
Fig. 7. RMS values between translating mirrors at 0-40 ℃
Fig. 8. RMS values between rotating mirrors at 0-40 ℃
Fig. 9. Random test condition
Fig. 10. Vibration test scene
Fig. 11. Optical detection before and after vibration test
Fig. 12. Thermo optical test scene
Fig. 13. Short-wave scanning pictures
Fig. 14. Spectral image and spectral curve at 20 ℃. (a) Spectral image; (b) spectral curve
| Peak | Temperature | | | Mean | Extremedifference |
|---|
| 5 ℃ | 10 ℃ | | 15 ℃ | 20 ℃ | 25 ℃ | 30 ℃ | 35 ℃ | |
|---|
| A | 1414.50 | 1413.65 | 1414.30 | 1415.47 | 1416.71 | 1417.81 | 1417.44 | 1415.69 | 2.11 | | B | 2202.45 | 2202.31 | 2203.10 | 2204.06 | 2200.41 | 2200.03 | 2199.91 | 2201.75 | 2.30 |
|
Table 1. 0 Absorption position at different temperaturesnm
| Parameter | Value |
|---|
| Wavelength range /nm | 1000-2500 | | Focal length /mm | 130 | | F-number | 2.2 | | Dispersion /(nm·pixel-1) | 7.5 | | Slit dimension /mm | Height: 12, width: 0.025 | | Detector array size /pixel | 320×256 | | Detector pixel size /μm2 | 30×30 |
|
Table 1. Index parameters of imaging spectrometer
| Temperature | | | Mean | Extremedifference |
|---|
| 5 ℃ | 10 ℃ | | | 15 ℃ | 20 ℃ | 25 ℃ | 30 ℃ | 35 ℃ | | | 38.7 | 36.12 | 35.57 | 39.54 | 43.83 | 42.88 | 45.2 | 40.26 | 4.93 |
|
Table 1. 1 Spectral bandwidth value under different temperaturenm
| Material | Density (g·cm-3) | Modulus ofelasticity /GPa | Poisson's ratio | Coefficient of thermalexpansion /(10-6 K-1) |
|---|
| 6061 aluminum | 2.70 | 70 | 0.33 | 21.7 | | 45 steel | 7.85 | 202 | 0.30 | 10.6 | | K9 glass | 2.51 | 55 | 0.21 | 7.1 |
|
Table 2. Material property sheet for imaging spectrometer
| Direction | Parameter | Mirror | Grating | Image plane | Collimating mirror |
|---|
| X | RMS /nm | 0.53 | 0.20 | 0.52 | 0.04 | | PV /nm | 12.89 | 1.69 | 2.25 | 1.57 | | Rigid angular displacement /(″)Rigid line displacement /μm | 5.183.64 | 5.253.51 | 5.193.95 | 5.243.46 | | Y | RMS /nm | 0.010 | 0.040 | 0.050 | 0.004 | | PV /mm | 1.53 | 0.63 | 3.11 | 2.12 | | Rigid angular displacement /(″)Rigid line displacement /μm | 2.952.10 | 2.832.10 | 3.132.29 | 2.792.08 | | Z | RMS /nm | 0.14 | 0.05 | 0.20 | 0.01 | | PV /mm | 5.40 | 1.03 | 0.53 | 0.15 | | Rigid angular displacement /(″)Rigid line displacement /μm | 0.590.52 | 0.730.59 | 0.820.83 | 0.830.66 |
|
Table 3. Shape errors and rigid displacement with 4 g acceleration load
| Component | Mirror | Grating | Imageplane | Collimatingmirror |
|---|
| Mirror | — | 0.07″/1.16 μm | 0.57″/0.32 μm | 0.19″/0.23 μm | | Grating | 0.07″/1.16 μm | - | 0.33″/0.46 μm | 0.10″/0.05 μm | | Image plane | 0.57″/0.32 μm | 0.33″/0.46 μm | - | 0.41″/0.49 μm | | Collimatingmirror | 0.19″/0.23 μm | 0.10″/0.05 μm | 0.41″/0.49 μm | - |
|
Table 4. Relative displacement between mirrors on X-direction 4 g acceleration load (angular displacement/line displacement)
| Component | Mirror | Grating | Imageplane | Collimatingmirror |
|---|
| Mirror | - | 0.12″/0.03 μm | 0.34″/0.24 μm | 0.16″/0.04 μm | | Grating | 0.12″/0.03 μm | - | 0.38″/0.25 μm | 0.08″/0.03 μm | | Image plane | 0.34″/0.24 μm | 0.38″/0.25 μm | - | 0.45″/0.28 μm | | Collimatingmirror | 0.16″/0.04 μm | 0.08″/0.03 μm | 0.45″/0.28 μm | - |
|
Table 5. Relative displacement between mirrors on Y-direction 4 g acceleration load (angular displacement/line displacement)
| Component | Mirror | Grating | Imageplane | Collimatingmirror |
|---|
| Mirror | - | 0.29″/0.19 μm | 0.34″/0.33 μm | 0.31″/0.20 μm | | Grating | 0.29″/0.19 μm | - | 0.51″/0.33 μm | 0.27″/0.10 μm | | Image plane | 0.34″/0.33 μm | 0.51″/0.33 μm | - | 0.31″/0.23 μm | | Collimatingmirror | 0.31″/0.20 μm | 0.27″/0.10 μm | 0.31″/0.23 μm | - |
|
Table 6. Relative displacement between mirrors on Z-direction 4 g acceleration load (angular displacement/line displacement)
| Parameter | Mirror | Grating | Image plane | Collimating mirror |
|---|
| max | RMS /nm | 12.9 | 15.8 | 16.4 | 17.9 | | PV /nm | 86.2 | 75.2 | 79.3 | 102.8 | | Rigid angular displacement /(″) | 39.8 | 35.1 | 33.3 | 40.4 | | Rigid line displacement /μm | 50.4 | 36.3 | 24.7 | 55.6 | | min | RMS /nm | 5.0 | 4.6 | 4.8 | 5.0 | | PV /nm | 32.1 | 24.0 | 32.4 | 27.1 | | Rigid angular displacement /(″) | 9.9 | 8.6 | 8.3 | 18.7 | | Rigid line displacement /μm | 12.6 | 9.1 | 6.2 | 13.7 |
|
Table 7. Shape errors and rigid displacement of imaging spectrometer on 0-40 ℃ temperature load
| Component | Mirror | Grating | Image plane | Collimating mirror |
|---|
| Mirror | — | 38.7″/40.3 μm | 54.3″/28.7 μm | 45.4″/53.9 μm | | Grating | 38.7″/40.3 μm | — | 32.3″/33.7 μm | 16.6″/19.0 μm | | Image plane | 54.3″/28.7 μm | 32.3″/33.7 μm | — | 31.7″/51.8 μm | | Collimatingmirror | 45.4″/53.9 μm | 16.6″/19.0 μm | 31.7″/51.8 μm | — |
|
Table 8. Max relative displacement between mirrors on 0-40 ℃ temperature load (angular displacement/line displacement)
| Frequency /Hz | Magnitude /g | Scanningspeed /(oct·min-1) | Experimentaldirection |
|---|
| 5-150 | 0.8 | 5 | X,Y,Z |
|
Table 9. Sinusoidal vibration test condition