• Opto-Electronic Advances
  • Vol. 4, Issue 3, 200049-1 (2021)
Chonglei Zhang*, Dongfang Zhang, and Zhouping Bian
Author Affiliations
  • Nanophotonics Research Centre, Shenzhen Key Laboratory of Micro-Scale Optical Information Technology, Shenzhen University, Shenzhen 518060, China.
  • show less
    DOI: 10.29026/oea.2021.200049 Cite this Article
    Chonglei Zhang, Dongfang Zhang, Zhouping Bian. Dynamic full-color digital holographic 3D display on single DMD[J]. Opto-Electronic Advances, 2021, 4(3): 200049-1 Copy Citation Text show less
    Combination of 4×4 neighboring pixels into one superpixel. (a) Weighting phase, where the pixels within each superpixel are distributed uniformly between 0 and 2π, each pixel can be independently modulated, and a spatial filter in the form of a circular aperture is placed in the Fourier plane of the first lens. We turn on the four pixels indicated by the yellow squares as an example. (b) The response E is the sum of the modulated pixels, as represented by the line arrow. (c) Complex target fields that can be constructed using a single super-pixel with size of 4×4, where the number of fields that can be constructed is 49291, the horizontal axis is the real part and the vertical axis is the imaginary part. (d) By loading blazed gratings in different directions for different colors of light, splitting of the differently colored light on the Fourier focal plane can be realized.
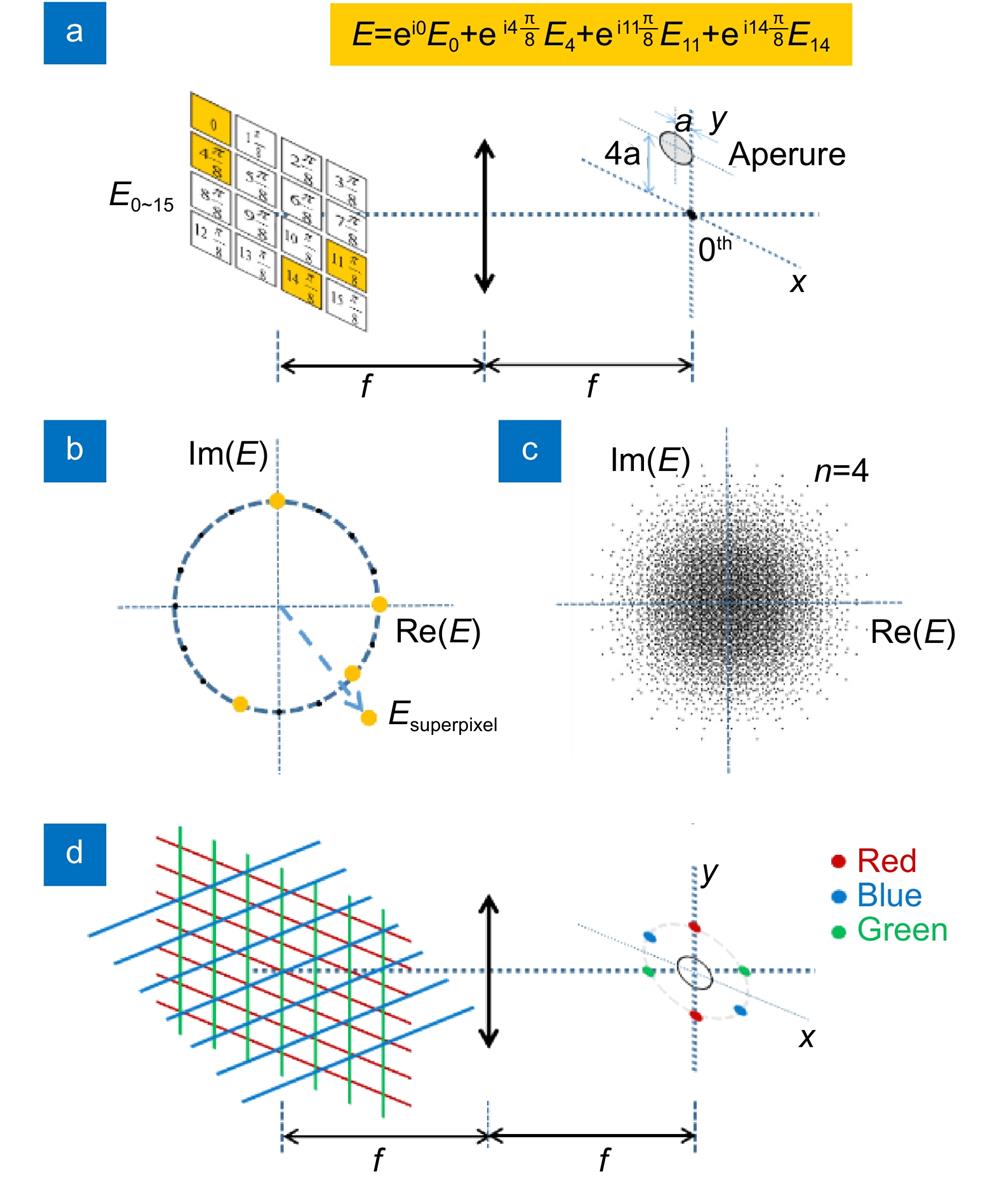
    Fig. 1. Combination of 4×4 neighboring pixels into one superpixel. (a) Weighting phase, where the pixels within each superpixel are distributed uniformly between 0 and 2π, each pixel can be independently modulated, and a spatial filter in the form of a circular aperture is placed in the Fourier plane of the first lens. We turn on the four pixels indicated by the yellow squares as an example. (b) The response E is the sum of the modulated pixels, as represented by the line arrow. (c) Complex target fields that can be constructed using a single super-pixel with size of 4×4, where the number of fields that can be constructed is 49291, the horizontal axis is the real part and the vertical axis is the imaginary part. (d) By loading blazed gratings in different directions for different colors of light, splitting of the differently colored light on the Fourier focal plane can be realized.
    Amplitude and phase mask generation process. (a1) Amplitude modulation mask for red. (b1) Amplitude modulation mask for green. (c1) Amplitude modulation mask for blue, where the amplitude modulation range is 0–1. (d1) Amplitude modulation mask for tri-primary color amplitude linear superposition, which can be loaded by the DMD. (a2) Phase modulation mask for red, loading a vertical blazed grating. (b2) Phase modulation mask for green, loading a horizontal blazed grating. (c2) Phase modulation mask for blue, loading a 45° tilted blazed grating, where the phase modulation range is (0,2π). (d2) Phase modulation mask for tri-primary color phase linear superposition, which can be loaded by the DMD.
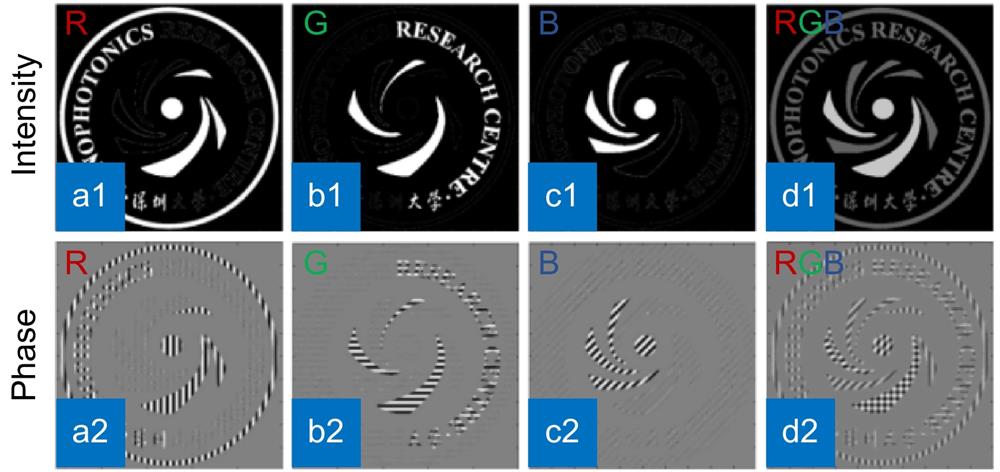
    Fig. 2. Amplitude and phase mask generation process. (a1) Amplitude modulation mask for red. (b1) Amplitude modulation mask for green. (c1) Amplitude modulation mask for blue, where the amplitude modulation range is 0–1. (d1) Amplitude modulation mask for tri-primary color amplitude linear superposition, which can be loaded by the DMD. (a2) Phase modulation mask for red, loading a vertical blazed grating. (b2) Phase modulation mask for green, loading a horizontal blazed grating. (c2) Phase modulation mask for blue, loading a 45° tilted blazed grating, where the phase modulation range is (0,2π). (d2) Phase modulation mask for tri-primary color phase linear superposition, which can be loaded by the DMD.
    Schematic of the color holographic imaging display system. Three types of color semiconductor laser are collimated, expanded and combined, reflected by R2 and R3, and are incident on the DMD panel at 24°. A multi-hole aperture filter is placed at the focal plane of lens f4, and lens f5 is used to reconstruct the image on the color charge-coupled device (CCD) panel. The DMD and CCD panels are strictly conjugated by the f4 and f5 lens groups.
    Fig. 3. Schematic of the color holographic imaging display system. Three types of color semiconductor laser are collimated, expanded and combined, reflected by R2 and R3, and are incident on the DMD panel at 24°. A multi-hole aperture filter is placed at the focal plane of lens f4, and lens f5 is used to reconstruct the image on the color charge-coupled device (CCD) panel. The DMD and CCD panels are strictly conjugated by the f4 and f5 lens groups.
    Color image display results realized using a red LD and a green LD, where the logo of our research center is used as the target structure. (a1) Structural design. (a2) DMD loading image, where the local magnification image shows the loaded holographic mask. (a3) Spectrum plane. (a4) Measured red image. (a5) Measured green image; and (a6) measured double-color result image. (b1) Multicolor result map based on the red and green primary colors. (b2) DMD loaded image, where the local magnified image shows the loaded grating magnified image. (b3) Spectrum plane. (b4) Measured red image. (b5) Measured green image. (b6) Measured multicolor result image.
    Fig. 4. Color image display results realized using a red LD and a green LD, where the logo of our research center is used as the target structure. (a1) Structural design. (a2) DMD loading image, where the local magnification image shows the loaded holographic mask. (a3) Spectrum plane. (a4) Measured red image. (a5) Measured green image; and (a6) measured double-color result image. (b1) Multicolor result map based on the red and green primary colors. (b2) DMD loaded image, where the local magnified image shows the loaded grating magnified image. (b3) Spectrum plane. (b4) Measured red image. (b5) Measured green image. (b6) Measured multicolor result image.
    Color image display results realized using a red LD, a green LD and a blue LD, where the logo of our research center is again used as the target structure. (a1) Structural design. (a2) Three-color spectrum plane, where the three-color spectrum is separated in space. (a3) Measured three-color result image. (b1) Designed multi-color image. (b2) Measured red pattern. (b3) Measured green pattern. (b4) Measured blue pattern. (b5) Tri-color combination pattern. (c1) Actual loaded natural picture and (c2) image display picture.
    Fig. 5. Color image display results realized using a red LD, a green LD and a blue LD, where the logo of our research center is again used as the target structure. (a1) Structural design. (a2) Three-color spectrum plane, where the three-color spectrum is separated in space. (a3) Measured three-color result image. (b1) Designed multi-color image. (b2) Measured red pattern. (b3) Measured green pattern. (b4) Measured blue pattern. (b5) Tri-color combination pattern. (c1) Actual loaded natural picture and (c2) image display picture.
    Optical reconstructions of 3D display with different focal plane locations. (a) Focus on z=0. (b) Focus on z=40mm. (c) Focus on z=60 mm. (d) Dynamic full-color digital holographic imaging.
    Fig. 6. Optical reconstructions of 3D display with different focal plane locations. (a) Focus on z=0. (b) Focus on z=40mm. (c) Focus on z=60 mm. (d) Dynamic full-color digital holographic imaging.
    Structural similarity Color similarity (objective) Color similarity (Subjective)
    Fig.4: a1 vs. a6 0.93970.432780.9981
    Fig.4: b1 vs. b6 0.96110.497730.9973
    Fig.5: a1 vs. a3 0.96060.461020.9913
    Fig.5: b1 vs. b5 0.93280.671020.9923
    Fig.5: c1 vs. c2 0.88960.585490.9832
    Table 1. Evaluation of experimental and design images
    Chonglei Zhang, Dongfang Zhang, Zhouping Bian. Dynamic full-color digital holographic 3D display on single DMD[J]. Opto-Electronic Advances, 2021, 4(3): 200049-1
    Download Citation