
Wei Cheng, Sikun Li, Xiangzhao Wang, Zinan Zhang. Method for Profile Reconstruction of Phase Defects in Extreme Ultraviolet Lithography Mask[J]. Acta Optica Sinica, 2020, 40(10): 1005001
- Acta Optica Sinica
- Vol. 40, Issue 10, 1005001 (2020)
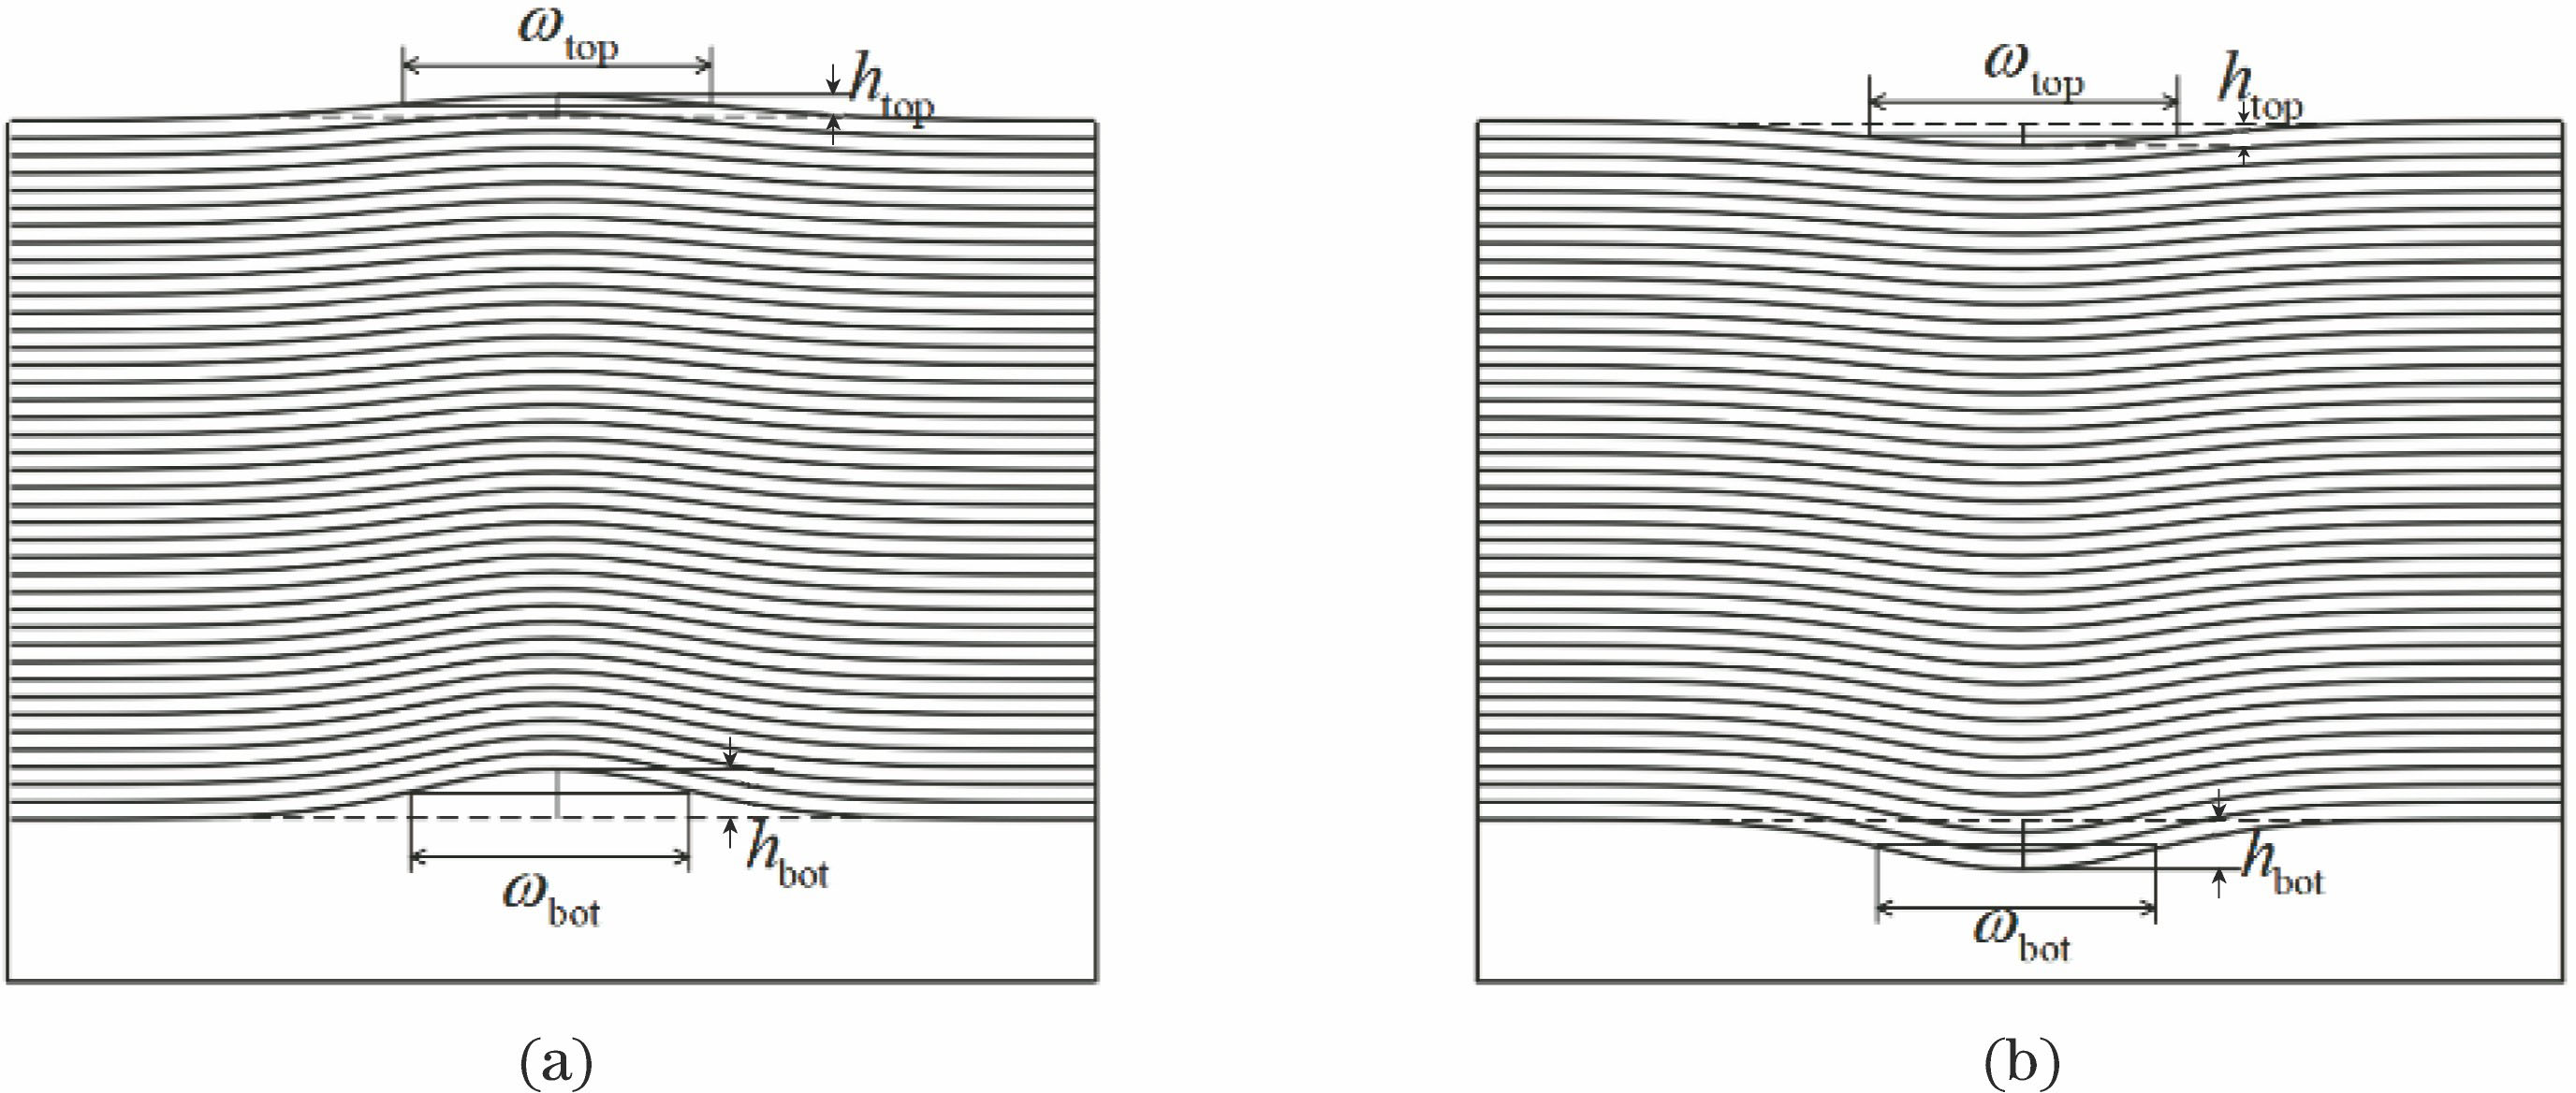
Fig. 1. Schematic of defected multilayer film in EUV lithography. (a) Bump defect; (b) pit defect
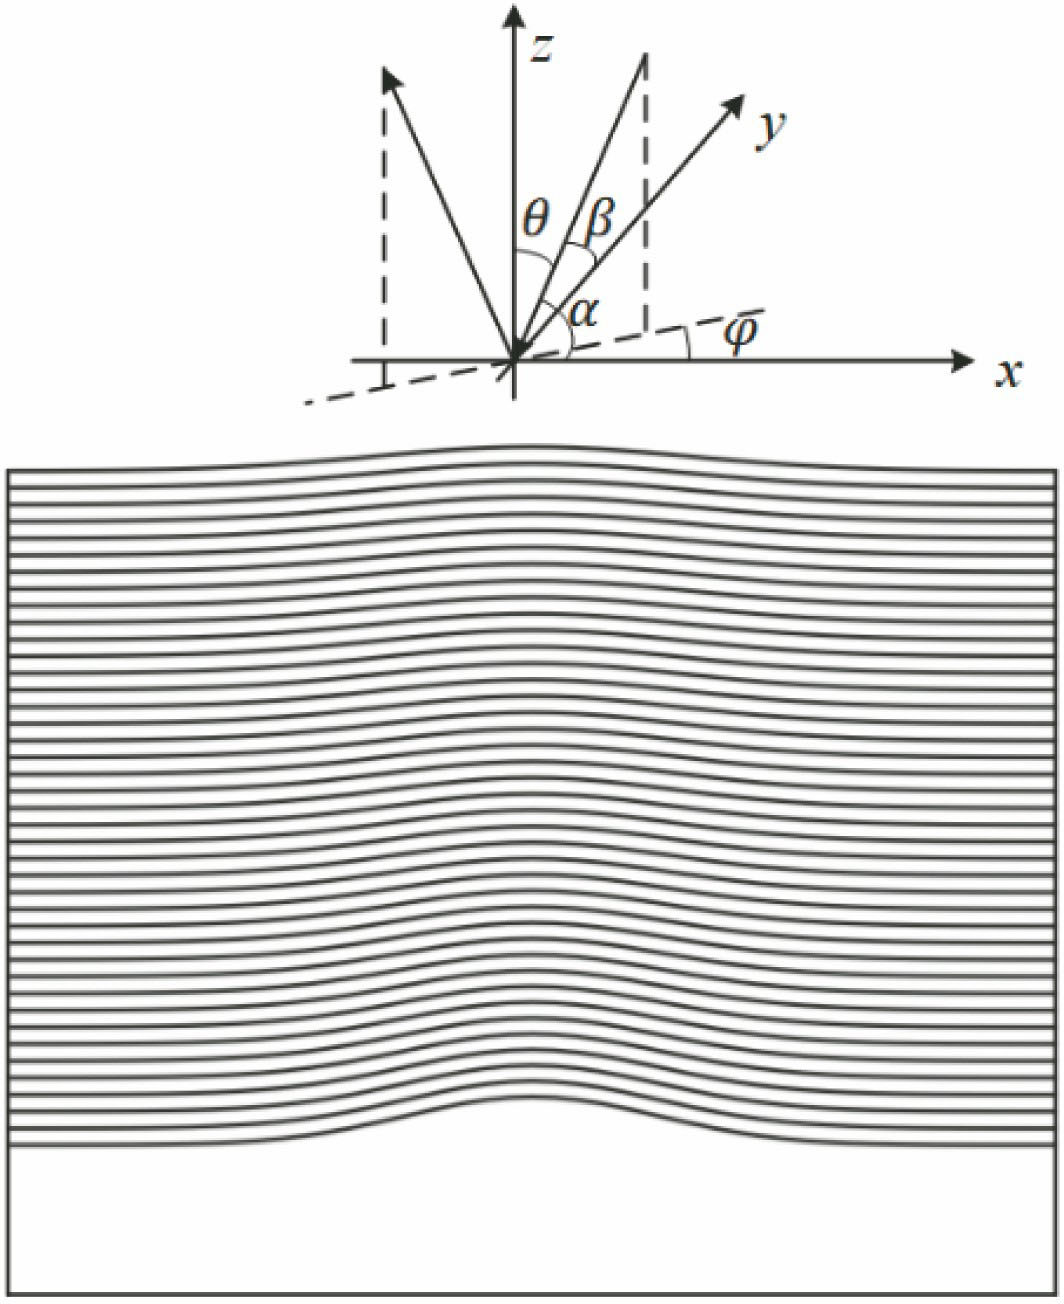
Fig. 2. Schematic of illumination angle
Fig. 3. Flowchart of FP reconstructing complex amplitude
Fig. 4. Schematic of CNN
Fig. 5. Schematic of MLP
Fig. 6. Flowchart of bottom profile parameter reconstruction of defects
Fig. 7. Schematic of FP reconstructing complex amplitude
Fig. 8. Reconstruction results of complex amplitude of aerial image. (a) Reconstructed amplitude; (b) reconstructed phase
Fig. 9. Comparison of amplitudes of aerial images. (a) Reconstructed amplitude of aerial image; (b) simulated amplitude of aerial image (NAobj=0.0825); (c) simulated amplitude of aerial image (NAobj=0.1320); (d) difference between those in Fig. 9 (a) and Fig. 9 (c)
Fig. 10. Central longitudinal sections of amplitude and phase of aerial images of mask blanks with bump defect. (a)(c) ωbot=20 nm; (b)(d) hbot=20 nm
Fig. 11. Central longitudinal sections of amplitude and phase of aerial images of mask blanks with pit defect. (a)(c) ωbot=20 nm; (b)(d) hbot=-20 nm
Fig. 12. Central values of aerial images of mask blanks with bump defects. (a) Amplitude; (b) phase
Fig. 13. Central values of aerial images of mask blanks with pit defects. (a) Amplitude; (b) phase
Fig. 14. Reconstruction results of bottom profile parameters of bump defects. (a) Reconstructed ωbot using CNN; (b) reconstructed hbot using MLP; (c) reconstructed hbot using MLP when input ωbot is real; (d) reconstructed hbot using CNN
Fig. 15. Reconstruction results of bottom profile parameters of pit defects. (a) Reconstructed ωbot using CNN; (b) reconstructed hbot using MLP; (c) reconstructed hbot using MLP when input ωbot is real; (d) reconstructed hbot using CNN
Fig. 16. Comparison of aerial images without and with noise. (a) Aerial image without noise; (b) aerial image with noise; (c) noise
Fig. 17. Reconstruction results of bottom profile parameters of bump defects when measured aerial images are with noise. (a) Reconstructed ωbot using CNN; (b) reconstructed hbot using MLP
Fig. 18. Reconstruction results of bottom profile parameters of pit defects when measured aerial images are with noise. (a) Reconstructed ωbot using CNN; (b) reconstructed hbot using MLP
|
Table 1. Parameter setting for simulation
|
Table 2. Illumination angle of coherent light
|
Table 3. Reconstruction results of defects

Set citation alerts for the article
Please enter your email address
© Copyright 2018-2021 | Chinese Laser Press. All Rights Reserved 沪ICP备15018463号-20