
Yichao Zhang, Ziwen Sun. Identity Authentication for Smart Phones Based on an Optimized Convolutional Deep Belief Network[J]. Laser & Optoelectronics Progress, 2020, 57(8): 081009
- Laser & Optoelectronics Progress
- Vol. 57, Issue 8, 081009 (2020)
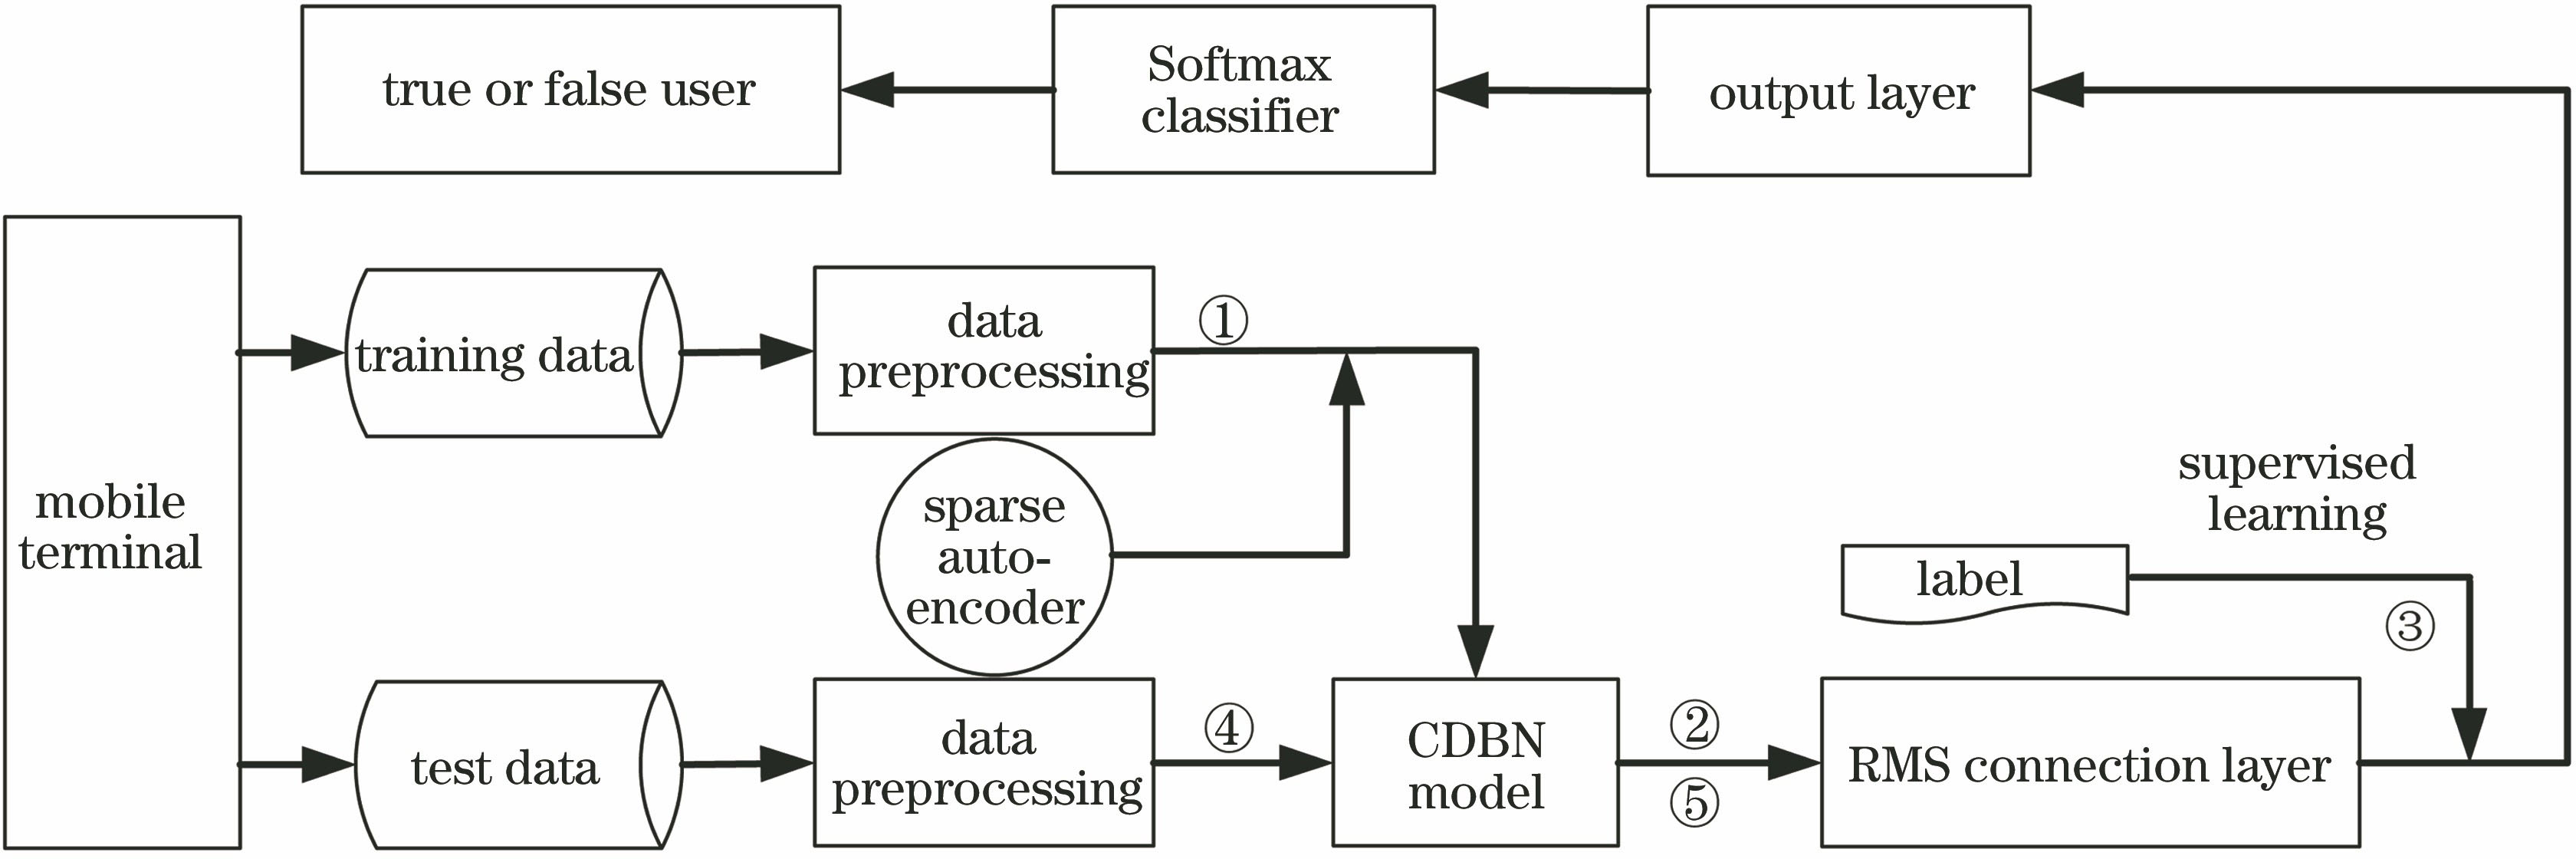
Fig. 1. Overall framework of gesture identity authentication
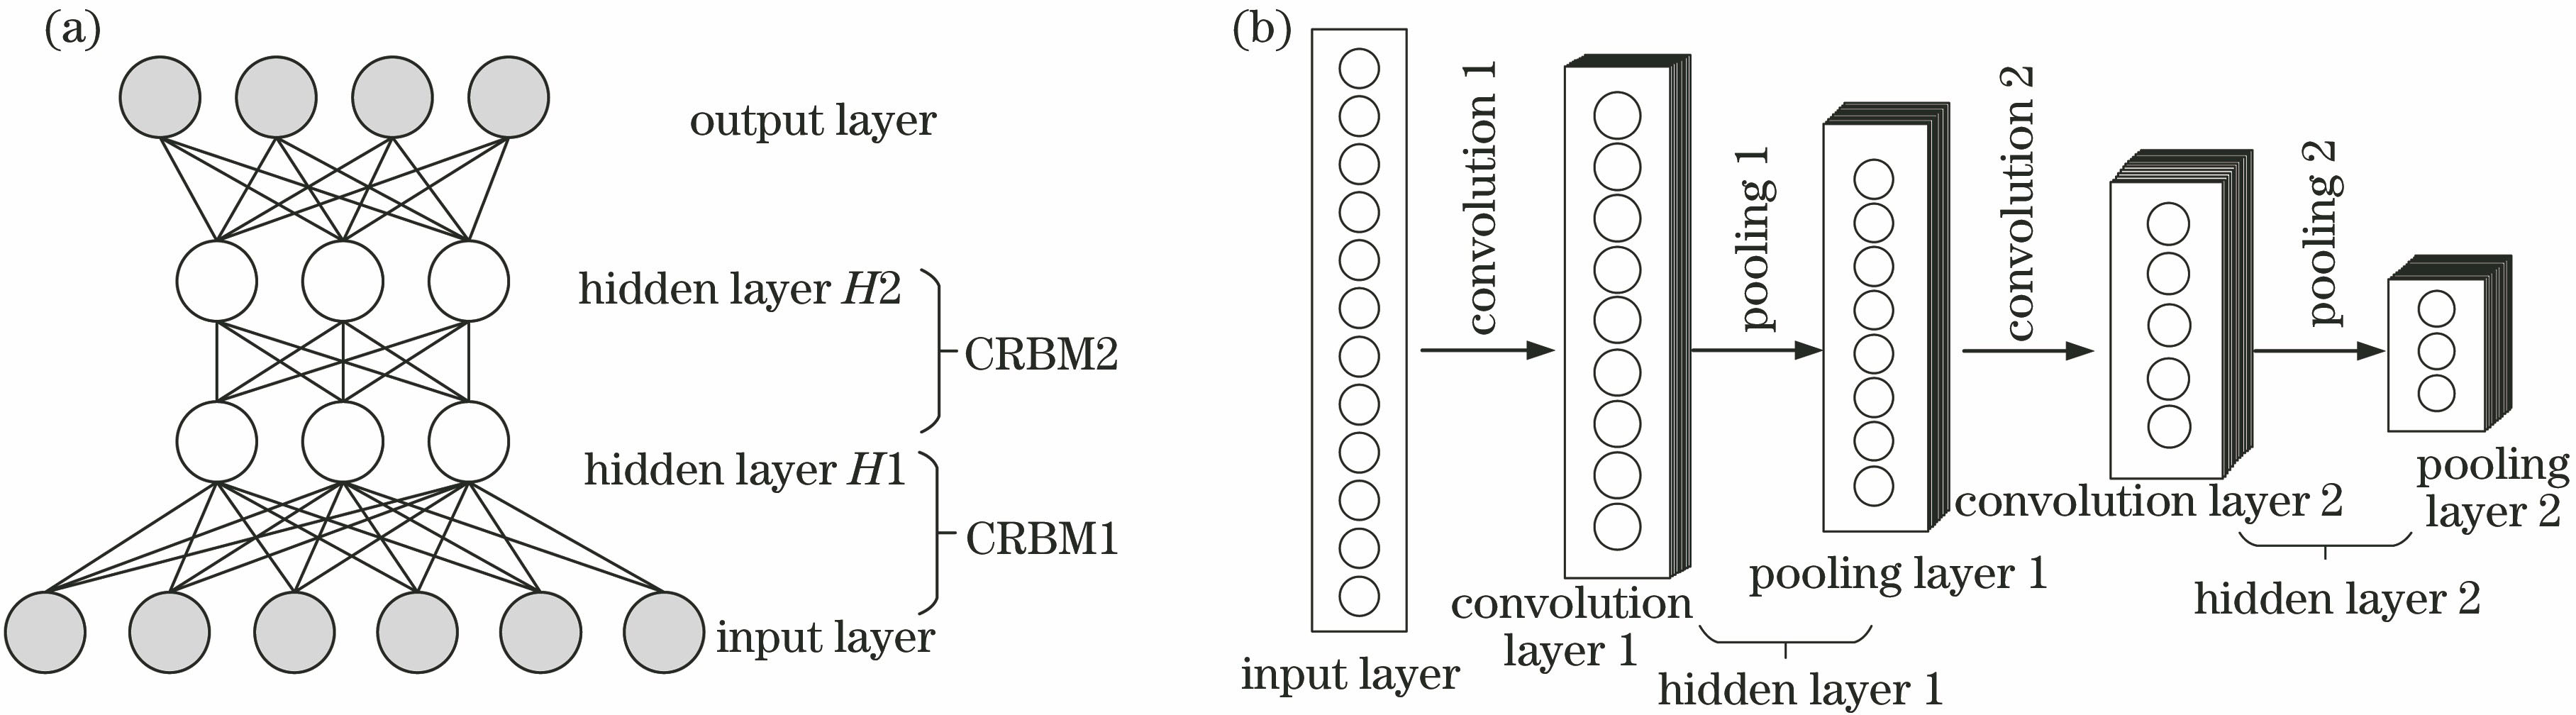
Fig. 2. Different types of CDBN models structure. (a) General structure; (b) with pooling layer
Fig. 3. Different model structures. (a) RBM structure; (b) CRBM structure
Fig. 4. Maximum pooling operation
Fig. 5. Single step Gibbs sampling
Fig. 6. Structure diagram of the output authentication model
Fig. 7. User 1 original motion trajectory
Fig. 8. User 1 pre-processed trajectory
Fig. 9. Fake user's gesture recovery diagram
|
Table 1. Simulation results of different network depths
|
Table 2. Simulation results of different sparsity indices
|
Table 3. Simulation results of different pooling methods
|
Table 4. Simulation results of different iteration times
|
Table 5. Simulation results of different connection layers
|
Table 6. Performance comparison among CDBN algorithm, BP, HMM, and DBN algorithms

Set citation alerts for the article
Please enter your email address
© Copyright 2018-2021 | Chinese Laser Press. All Rights Reserved 沪ICP备15018463号-20