• Journal of Infrared and Millimeter Waves
  • Vol. 42, Issue 1, 88 (2023)
Yu-Yan XIANG1, Yue MA1, Gao-Feng GUO2, Quan JING2, and Song LI1、3、*
Author Affiliations
  • 1School of Electronic Information,Wuhan University,Wuhan 430072,China
  • 2China Academy of Space Technology,Beijing 100098,China
  • 3Wuhan Institute of Quantum Technology,Wuhan 430010,China
  • show less
    DOI: 10.11972/j.issn.1001-9014.2023.01.012 Cite this Article
    Yu-Yan XIANG, Yue MA, Gao-Feng GUO, Quan JING, Song LI. The photon detection mode of photomultiplier tubes considering the pulse height distribution[J]. Journal of Infrared and Millimeter Waves, 2023, 42(1): 88 Copy Citation Text show less
    Effect of pulse pile-up,in the figure,the green dashed line pulse represents the electron flow pulse of PMT responding to the output of a single photon,and the solid green line pulse represents the electron flow pulse after pile up:(a)dead time effect caused by pulse,(b)height increase effect caused by pulse pile-up
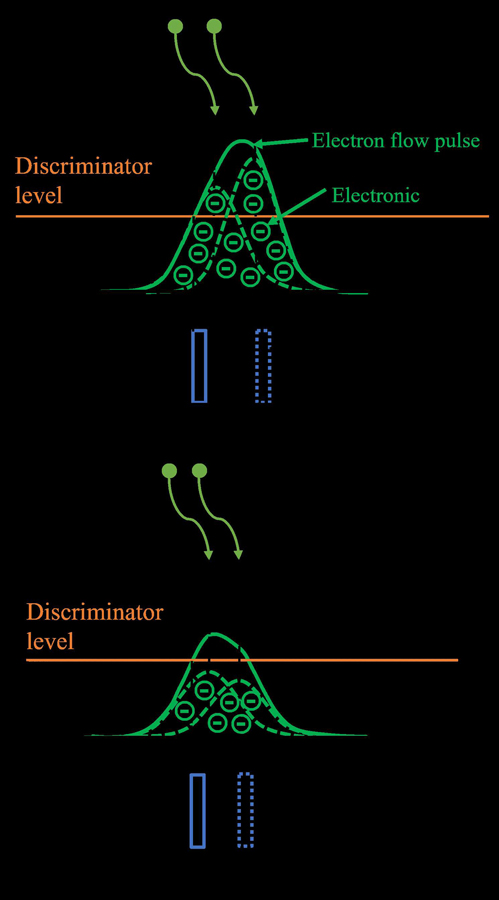
    Fig. 1. Effect of pulse pile-up,in the figure,the green dashed line pulse represents the electron flow pulse of PMT responding to the output of a single photon,and the solid green line pulse represents the electron flow pulse after pile up:(a)dead time effect caused by pulse,(b)height increase effect caused by pulse pile-up
    The pulse height distribution of PMT anode output signal electron current
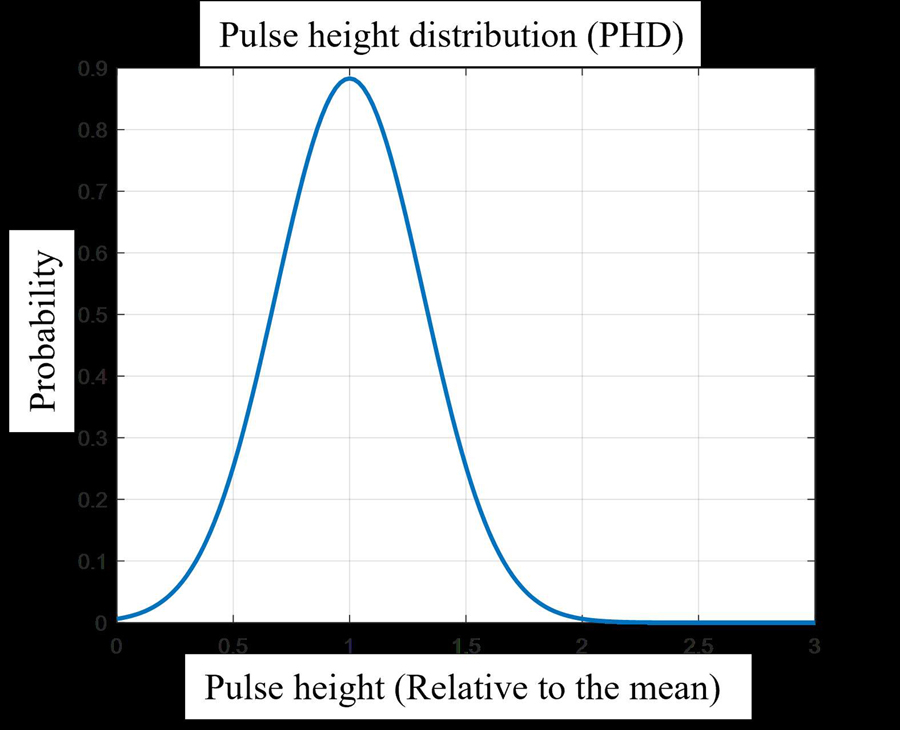
    Fig. 2. The pulse height distribution of PMT anode output signal electron current
    PMT output pulse pile-up,dotted line is the part of pulse pile-up,solid line is the result of pulse pile-up
    Fig. 3. PMT output pulse pile-up,dotted line is the part of pulse pile-up,solid line is the result of pulse pile-up
    Photon-events detection probability time distribution,in the figure,the solid orange line is the photon detection probability of the traditional single-photon model,the solid blue line is the detection probability of the simplified PMT model,and the yellow 'X' is the Monte Carlo simulation data point:(a)Ns=1,(b)Ns=2,(c)Ns=4,(d)Ns=8
    Fig. 4. Photon-events detection probability time distribution,in the figure,the solid orange line is the photon detection probability of the traditional single-photon model,the solid blue line is the detection probability of the simplified PMT model,and the yellow 'X' is the Monte Carlo simulation data point:(a)Ns=1,(b)Ns=2,(c)Ns=4,(d)Ns=8
    Comparison of ranging walking error and ranging accuracy between PMT photon detection model and traditional model,in the figure,the solid blue line represents the traditional photon detection model and the solid orange line represents the PMT photon detection model:(a)ranging walking error Ra,(b)ranging accuracy Rp
    Fig. 5. Comparison of ranging walking error and ranging accuracy between PMT photon detection model and traditional model,in the figure,the solid blue line represents the traditional photon detection model and the solid orange line represents the PMT photon detection model:(a)ranging walking error Ra,(b)ranging accuracy Rp
    The relationship between PMT detection probability,ranging walking error and photon event identification threshold,(a)the relationship between the detection probability and the threshold when the number of incident photons Ns=2,(b)the relationship between the ranging walking error and the number of incident photons under different threshold conditions
    Fig. 6. The relationship between PMT detection probability,ranging walking error and photon event identification threshold,(a)the relationship between the detection probability and the threshold when the number of incident photons Ns=2,(b)the relationship between the ranging walking error and the number of incident photons under different threshold conditions
    Photon-counting radar system:(a)a block diagram of experimental system,(b)a photograph of thephoton counting LIDAR
    Fig. 7. Photon-counting radar system:(a)a block diagram of experimental system,(b)a photograph of thephoton counting LIDAR
    The relationship between photon detection probability and incident photon number:(a)GM-APD,(b)PMT
    Fig. 8. The relationship between photon detection probability and incident photon number:(a)GM-APD,(b)PMT
    Experimental results:(a)experimental results and theoretical curves of incident photon number and ranging walking error,the solid blue line in the figure is the theoretical curve of GM-APD ranging walking error changing with incident photon number,and the blue 'o' is the experimental data point of GM-APD,the solid orange line is the theoretical curve of PMT ranging walking error varying with the number of incident photons,and the orange 'x' is the experimental data point of PMT,(b)experimental results of the ranging accuracy of PMT and GM-APD varying with the number of incident photons
    Fig. 9. Experimental results:(a)experimental results and theoretical curves of incident photon number and ranging walking error,the solid blue line in the figure is the theoretical curve of GM-APD ranging walking error changing with incident photon number,and the blue 'o' is the experimental data point of GM-APD,the solid orange line is the theoretical curve of PMT ranging walking error varying with the number of incident photons,and the orange 'x' is the experimental data point of PMT,(b)experimental results of the ranging accuracy of PMT and GM-APD varying with the number of incident photons
    Three pulse height distribution functions
    Fig. 10. Three pulse height distribution functions
    When the number of incident photons is 2,the relationship between the photon event detection probability and normalized dentification threshold of the three pulse height distribution functions:(a)T=0.3,(b)T=0.7,(c)T=1,(d)T=1.5
    Fig. 11. When the number of incident photons is 2,the relationship between the photon event detection probability and normalized dentification threshold of the three pulse height distribution functions:(a)T=0.3,(b)T=0.7,(c)T=1,(d)T=1.5
    When the threshold T=1,the relationship between the ranging walking error,ranging accuracy and incident photon number of the three pulse height distribution functions:(a)ranging walking error and(b)ranging accuracy
    Fig. 12. When the threshold T=1,the relationship between the ranging walking error,ranging accuracy and incident photon number of the three pulse height distribution functions:(a)ranging walking error and(b)ranging accuracy
    The relationship between the signal-to-noise ratio of photon detection and the identification threshold of photon events:(a)T=1,(b)T=2,(c)T=3,(d)T=4
    Fig. 13. The relationship between the signal-to-noise ratio of photon detection and the identification threshold of photon events:(a)T=1,(b)T=2,(c)T=3,(d)T=4
    The relationship between signal photon detection probability and threshold
    Fig. 14. The relationship between signal photon detection probability and threshold
    The shadowing effect of noise photons on signal photons:(a)the low identification threshold,(b)the high identification threshold
    Fig. 15. The shadowing effect of noise photons on signal photons:(a)the low identification threshold,(b)the high identification threshold
    The relationship between photon detection probability and normalized threshold at high noise rate
    Fig. 16. The relationship between photon detection probability and normalized threshold at high noise rate
    The photon-events detection probability time distribution when the pulse width of echo pulse is 10 ns,in the figure,the solid orange line is the photon detection probability of the traditional single-photon model,the solid blue line is the detection probability of the simplified PMT model,and the yellow 'X' is the Monte Carlo simulation data point:(a)Ns=1,(b)Ns=2,(c)Ns=4,(d)Ns=8
    Fig. 17. The photon-events detection probability time distribution when the pulse width of echo pulse is 10 ns,in the figure,the solid orange line is the photon detection probability of the traditional single-photon model,the solid blue line is the detection probability of the simplified PMT model,and the yellow 'X' is the Monte Carlo simulation data point:(a)Ns=1,(b)Ns=2,(c)Ns=4,(d)Ns=8
    参数
    PMT输出脉宽1.2 ns
    激光脉冲脉宽1.8 ns
    时间分辨率τ200 ps
    PMT单级增益10
    PMT倍增级数6
    噪声50 KHz
    仿真次数10000
    Table 1. Monte Carlo simulation conditions
    入射光子数衰减倍数刻度θ
    0.510-3-1.61217.3
    110-3-1.30175.4
    210-3-1.00135.0
    310-3-0.82110.7
    410-3-0.7094.5
    810-3-0.4054.0
    1010-3-0.3040.5
    Table 2. The relationship between adjustable attenuation scale and incident photon number
    项目PMTGM-APD
    增益106~107106~107
    量子效率(532 nm)30%35%
    暗计数(counts)<30<500
    探测死区时间3.2 ns50 ns
    时间抖动<500 ps<600 ps
    Table 3. The parameters of PMT and GM-APD module
    阈值T行走误差/m精确度/m信号光子探测概率
    0.5-0.103 10.067 80.72
    1-0.078 50.067 20.79
    2-0.058 70.059 20.69
    3-0.033 30.052 50.39
    Table 4. The relationship between ranging walking error, ranging accuracy, detection probability and threshold
    Yu-Yan XIANG, Yue MA, Gao-Feng GUO, Quan JING, Song LI. The photon detection mode of photomultiplier tubes considering the pulse height distribution[J]. Journal of Infrared and Millimeter Waves, 2023, 42(1): 88
    Download Citation