• Journal of Semiconductors
  • Vol. 45, Issue 3, 032701 (2024)
Yong Sun1、2、*, Wei Zhang1、2, Shuang Han1、2, Ran An1、2, Xin-Sheng Tang1、2, Xin-Lei Yu1、2, Xiu-Juan Miao1、2、**, Xin-Jun Ma1、2, Xianglian1、2, Pei-Fang Li1、2, Cui-Lan Zhao1、2, Zhao-Hua Ding1、2, and Jing-Lin Xiao1、2
Author Affiliations
  • 1Institute of Condensed Matter Physics, Inner Mongolia Minzu University, Tongliao 028043, China
  • 2College of Physics and Electronic Information, Inner Mongolia Minzu University, Tongliao 028043, China
  • show less
    DOI: 10.1088/1674-4926/45/3/032701 Cite this Article
    Yong Sun, Wei Zhang, Shuang Han, Ran An, Xin-Sheng Tang, Xin-Lei Yu, Xiu-Juan Miao, Xin-Jun Ma, Xianglian, Pei-Fang Li, Cui-Lan Zhao, Zhao-Hua Ding, Jing-Lin Xiao. Behavior of exciton in direct−indirect band gap AlxGa1−xAs crystal lattice quantum wells[J]. Journal of Semiconductors, 2024, 45(3): 032701 Copy Citation Text show less
    (Color online) (a) Schematic diagram of AlxGa1−xAs ground state lattice; (b) schematic diagram of exciton−phonon coupling in AlxGa1−xAs crystals; (c) schematic diagram of an exciton subject to parabolic potential.
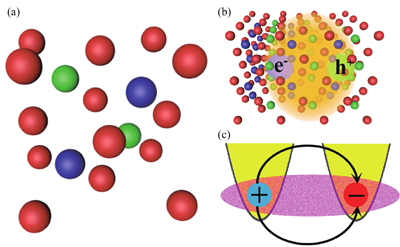
    Fig. 1. (Color online) (a) Schematic diagram of AlxGa1−xAs ground state lattice; (b) schematic diagram of exciton−phonon coupling in AlxGa1−xAs crystals; (c) schematic diagram of an exciton subject to parabolic potential.
    (Color online) (a) Schematic diagram of exciton energy band. (b) Relationship between exciton and phonon coupling coefficient and Al concentration.
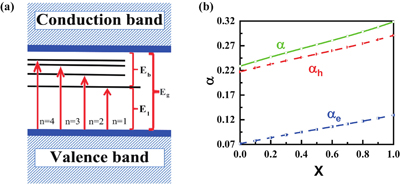
    Fig. 2. (Color online) (a) Schematic diagram of exciton energy band. (b) Relationship between exciton and phonon coupling coefficient and Al concentration.
    (Color online) Exciton energy in AlxGa1−xAs crystal: (a) At ω0=1013 Hz, Eb, E1 and Eg change with Al concentration in AlxGa1−xAs crystal; (b) schematic diagram of exciton energies in direct semiconductors and indirect semiconductors.
    Fig. 3. (Color online) Exciton energy in AlxGa1−xAs crystal: (a) At ω0=1013 Hz, Eb, E1 and Eg change with Al concentration in AlxGa1−xAs crystal; (b) schematic diagram of exciton energies in direct semiconductors and indirect semiconductors.
    (Color online) (a) The influence of quantum dots and Al concentration on exciton ground state binding energy; (b) the dependence of exciton ground state binding energy on quantum dots and Al concentration; (c) the parabolic potential of the electron; (d) the parabolic potential of the hole; (e) schematic diagram of an exciton in an indirect semiconductor.
    Fig. 4. (Color online) (a) The influence of quantum dots and Al concentration on exciton ground state binding energy; (b) the dependence of exciton ground state binding energy on quantum dots and Al concentration; (c) the parabolic potential of the electron; (d) the parabolic potential of the hole; (e) schematic diagram of an exciton in an indirect semiconductor.
    GaAsAlxGa1−xAsAlAs
    me (units of m0)0.0670.067 + 0.083x0.15
    mh (units of m0)0.620.62 + 0.14x0.76
    ωLO (meV)36.2536.25 + 38.3x + 17.12x2 − 5.11x350.09
    ε0 13.1813.18 − 3.12x10.06
    ε 10.89 10.89 − 2.73x8.16
    Eg (eV)1.4241.424 + 1.247x, x < 0.451.9 + 0.125x + 0.143x2, x > 0.452.168
    Table 1. Related parameters of AlxGa1−xAs crystals.
    Yong Sun, Wei Zhang, Shuang Han, Ran An, Xin-Sheng Tang, Xin-Lei Yu, Xiu-Juan Miao, Xin-Jun Ma, Xianglian, Pei-Fang Li, Cui-Lan Zhao, Zhao-Hua Ding, Jing-Lin Xiao. Behavior of exciton in direct−indirect band gap AlxGa1−xAs crystal lattice quantum wells[J]. Journal of Semiconductors, 2024, 45(3): 032701
    Download Citation