• Photonics Research
  • Vol. 10, Issue 4, 913 (2022)
Zhen Zhen1、2, Si-Yue Jin1、2, Ren Jie1、2, Hai-Yao Liang1, and Xing-Sheng Xu1、2、*
Author Affiliations
  • 1State Key Laboratory of Integrated Optoelectronics, Institute of Semiconductors, Chinese Academy of Sciences, Beijing 100083, China
  • 2Center of Materials Science and Optoelectronics Engineering, University of Chinese Academy of Sciences, Beijing 100049, China
  • show less
    DOI: 10.1364/PRJ.448781 Cite this Article Set citation alerts
    Zhen Zhen, Si-Yue Jin, Ren Jie, Hai-Yao Liang, Xing-Sheng Xu. Strong coupling between colloidal quantum dots and a microcavity with hybrid structure at room temperature[J]. Photonics Research, 2022, 10(4): 913 Copy Citation Text show less
    Quasi-BIC in hybrid refractive-index waveguide. (a) Schematic diagram of hybrid waveguide. The etched SOI is 340 nm thick with a gradually varying width w. SOI was top spin coated with an SU8 polymer. (b) Photonic potential of the hybrid waveguide. The red and dark gray lines plot wells of the TM and TE polarizations. The yellow region represents the TMC band that is above the TE potential. The black wavy line presents the TMB mode. (c) Calculated Q factors of the modes versus waveguide widths around 2.3 μm and 9 μm. The red curve represents the Q factor of the hybrid waveguide and the blue curve without the SU8 layer. The modal profiles for the waveguides with widths 2.3 μm, 2.34 μm, and 9.426 μm are, respectively, shown in (d)–(f).
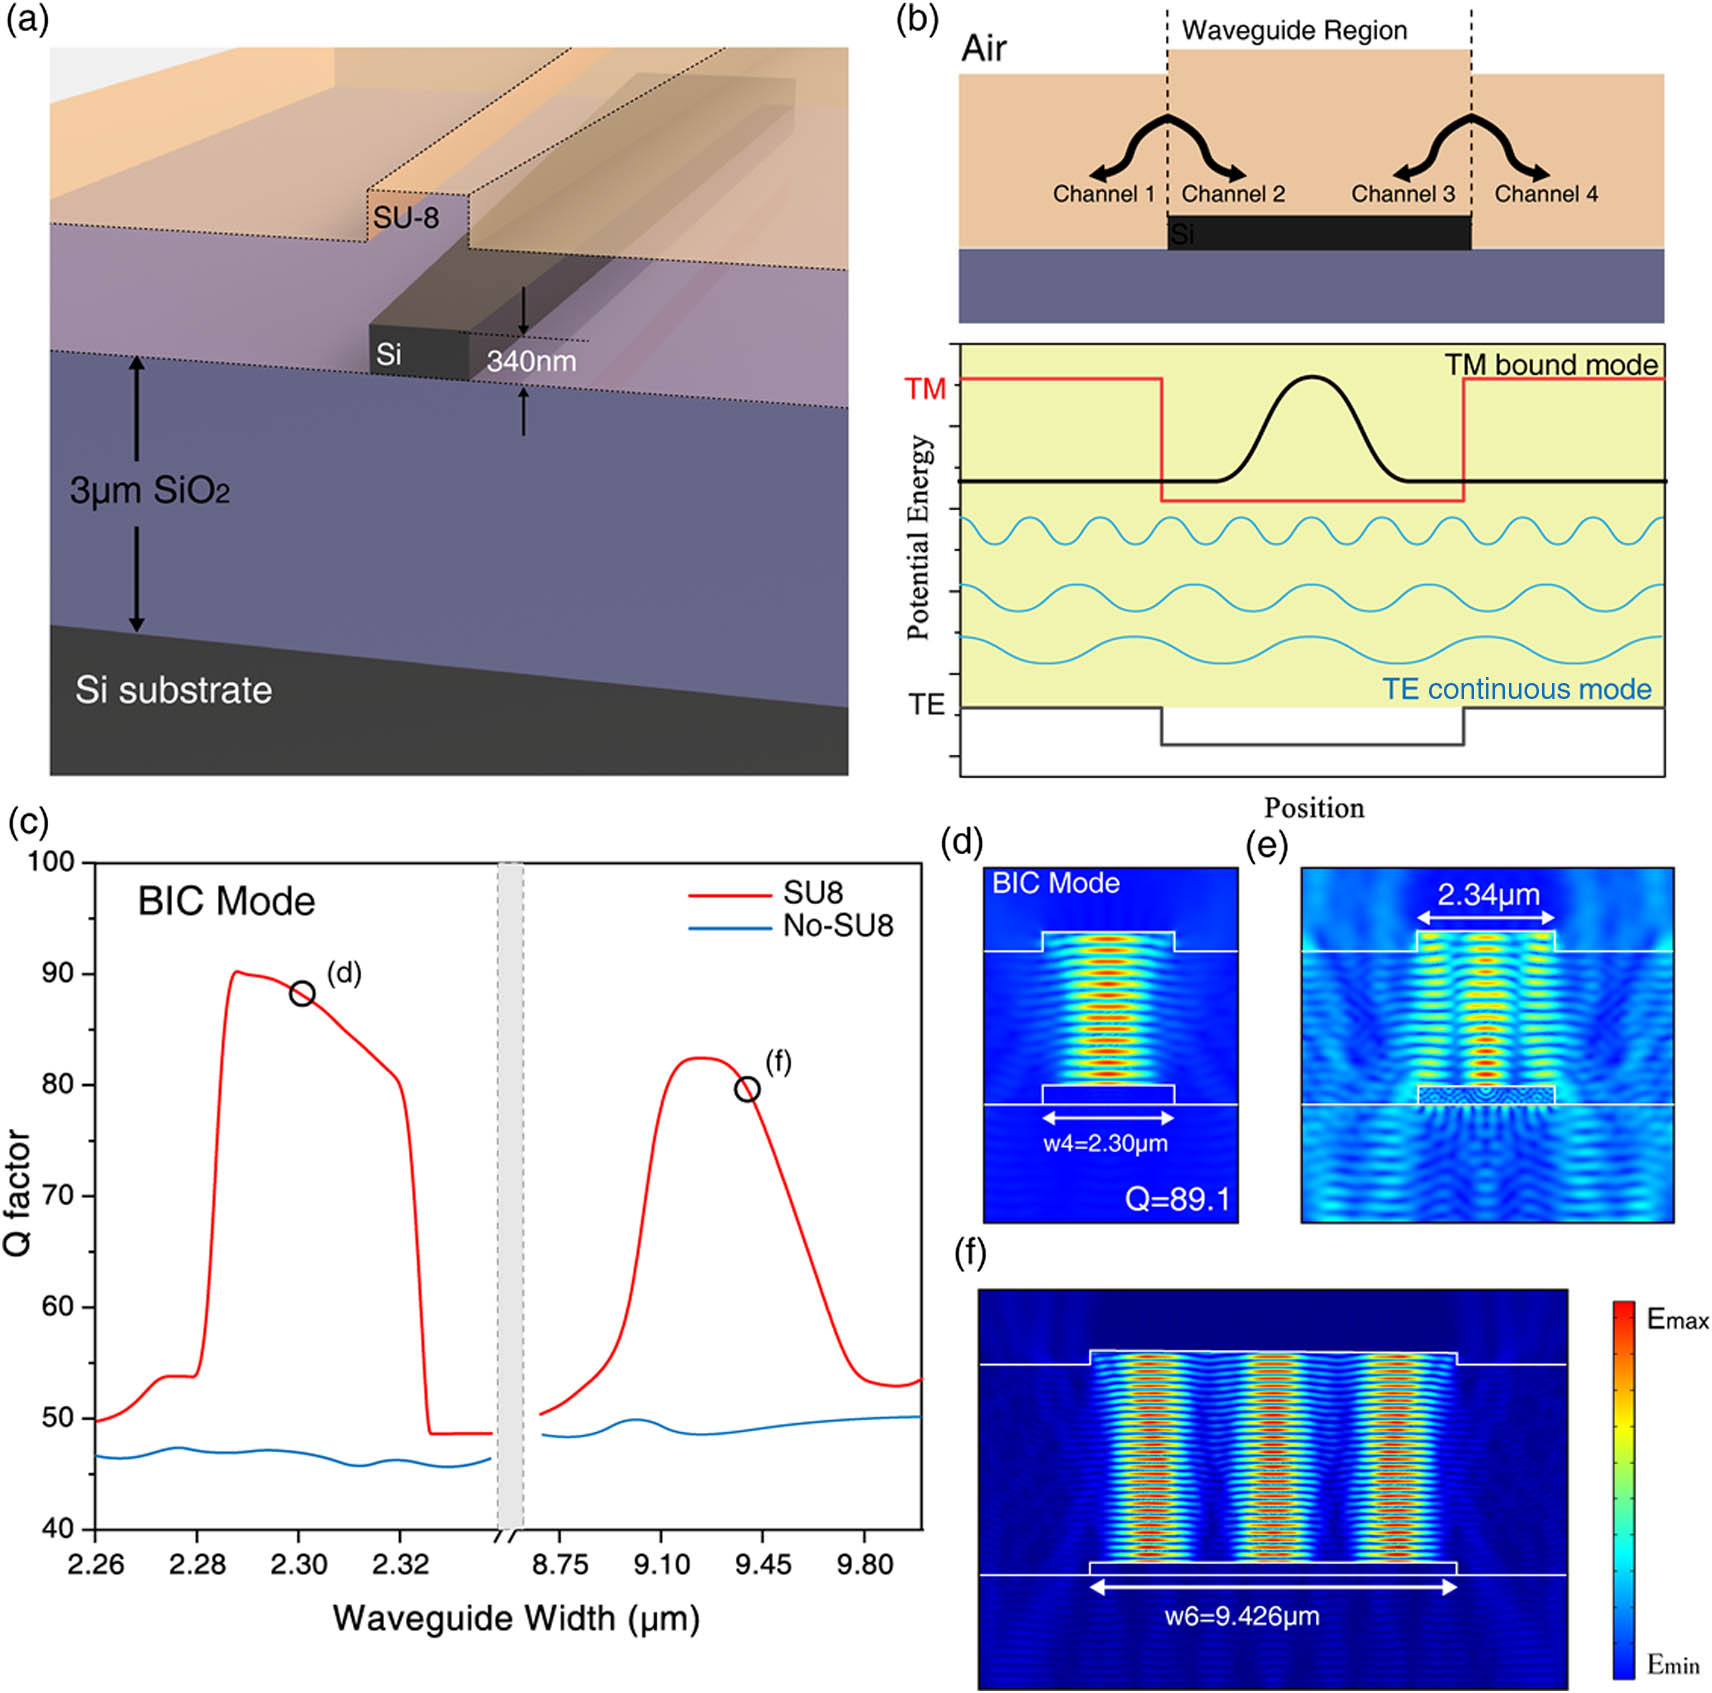
    Fig. 1. Quasi-BIC in hybrid refractive-index waveguide. (a) Schematic diagram of hybrid waveguide. The etched SOI is 340 nm thick with a gradually varying width w. SOI was top spin coated with an SU8 polymer. (b) Photonic potential of the hybrid waveguide. The red and dark gray lines plot wells of the TM and TE polarizations. The yellow region represents the TMC band that is above the TE potential. The black wavy line presents the TMB mode. (c) Calculated Q factors of the modes versus waveguide widths around 2.3 μm and 9 μm. The red curve represents the Q factor of the hybrid waveguide and the blue curve without the SU8 layer. The modal profiles for the waveguides with widths 2.3 μm, 2.34 μm, and 9.426 μm are, respectively, shown in (d)–(f).
    Schematic diagram of waveguide structure and coupled CQD energy level. (a) CQDs were drop-casted onto the polymer waveguide surface. (b) Energy-level structure of the CQD-cavity system with large coupling strength. When strong coupling occurs, the exciton energy level G is split into two sub-energy levels. δ is the energy difference between them. The UP and LP transitions are indicated by red and blue arrows, respectively. ωc is eigenfrequency of the exciton. (c) Microscopic photograph of SU8-SOI waveguides with CQDs. (d) Experiment optical path and spectrum diagram.
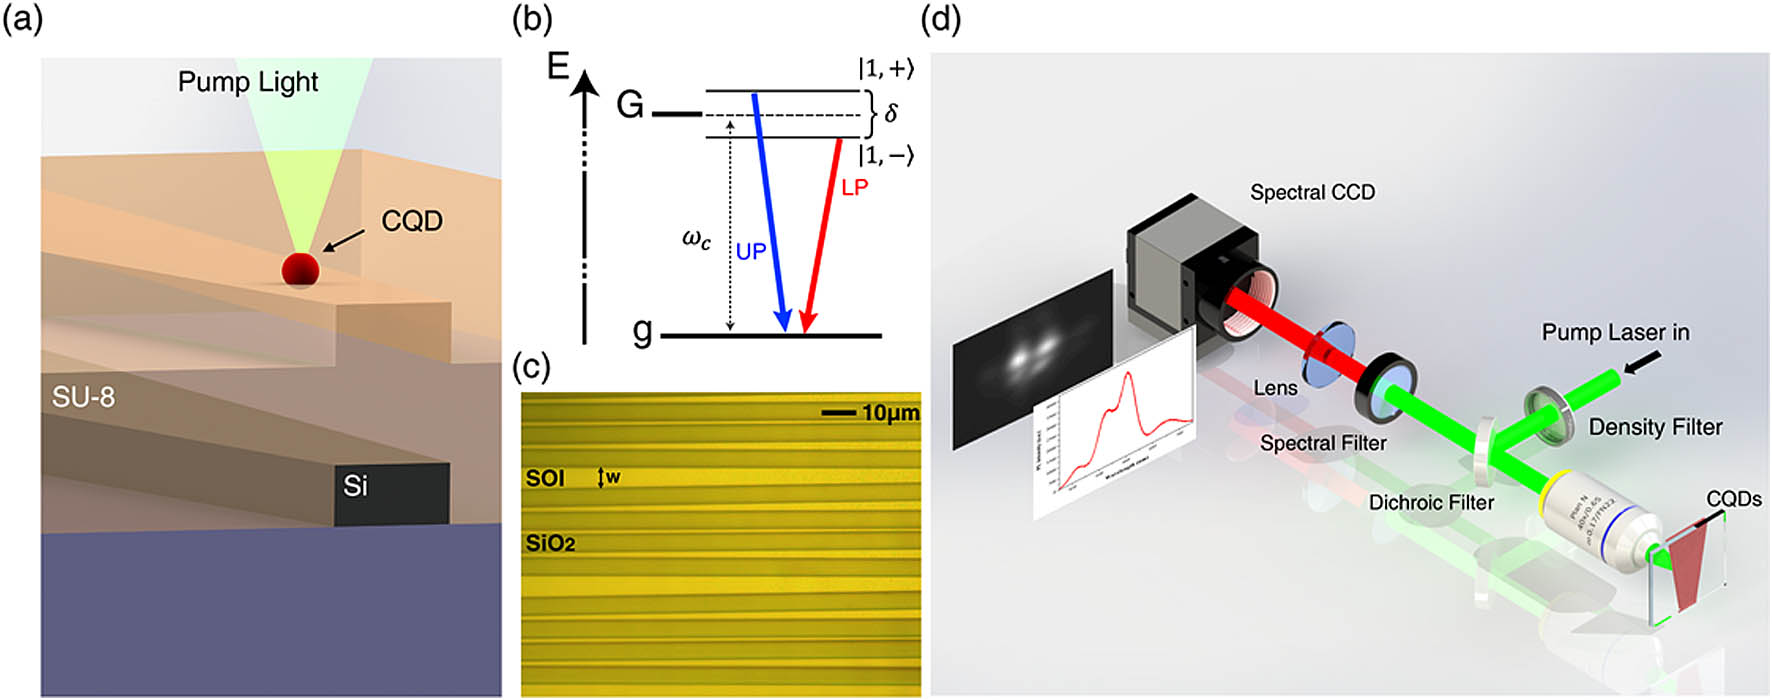
    Fig. 2. Schematic diagram of waveguide structure and coupled CQD energy level. (a) CQDs were drop-casted onto the polymer waveguide surface. (b) Energy-level structure of the CQD-cavity system with large coupling strength. When strong coupling occurs, the exciton energy level G is split into two sub-energy levels. δ is the energy difference between them. The UP and LP transitions are indicated by red and blue arrows, respectively. ωc is eigenfrequency of the exciton. (c) Microscopic photograph of SU8-SOI waveguides with CQDs. (d) Experiment optical path and spectrum diagram.
    PL spectra of CQDs at different widths on the waveguide, from (a) to (f), and the waveguide widths from w1 to w6 gradually increase. The vertical dashed line is the CQD exciton energy, and the value is 1. 893 eV. The red dotted line is the resulting curve fitted by the multi-Gaussian function.
    Fig. 3. PL spectra of CQDs at different widths on the waveguide, from (a) to (f), and the waveguide widths from w1 to w6 gradually increase. The vertical dashed line is the CQD exciton energy, and the value is 1. 893 eV. The red dotted line is the resulting curve fitted by the multi-Gaussian function.
    Spectral image of CQDs on the waveguide with width w4. (a) The spectral image was captured by PI-CCD, in which the brightness represents the relative intensity, the horizontal axis represents the wavelength, and the vertical axis represents the acquisition angle. Each bright horizontal line can be separated into a spectrum at corresponding angle. The angles corresponding to the spectra of (b), (c), and (d) are marked with red horizontal dotted lines. (b) Spectrum at angle 2.0°, and the red dotted line represents the fitted curve of the bi-Gaussian function. The spectra below are the same. (c) Spectrum at angle 12.3°. (d) Spectrum at angle -22.5°. At this angle, the relative intensity of the UP transition is lower than that of the LP transition.
    Fig. 4. Spectral image of CQDs on the waveguide with width w4. (a) The spectral image was captured by PI-CCD, in which the brightness represents the relative intensity, the horizontal axis represents the wavelength, and the vertical axis represents the acquisition angle. Each bright horizontal line can be separated into a spectrum at corresponding angle. The angles corresponding to the spectra of (b), (c), and (d) are marked with red horizontal dotted lines. (b) Spectrum at angle 2.0°, and the red dotted line represents the fitted curve of the bi-Gaussian function. The spectra below are the same. (c) Spectrum at angle 12.3°. (d) Spectrum at angle -22.5°. At this angle, the relative intensity of the UP transition is lower than that of the LP transition.
    Strong coupling between CQDs and SU8-SOI waveguide. At different angles, the peak energies of the PL split spectra change with the angle: (a) at waveguide width w4; (c) at w1; and (d) at w6. The blue and red curves represent UP and LP due to the strong coupling. Colored scatters are the peak energies of the PL spectra. The gray line is the cavity mode. The black crosses represent the experimental cavity modes at different angles. (b) PL spectra on SU8-SiO2 and SU8-SOI under the same experimental conditions. The black curve is the PL spectrum at angle 11.0° of the hybrid index structure, and the PL spectrum split into multiple peaks. At the same angle of 11.0°, the RL spectrum of the SU8-SOI without CQDs is shown by the blue curve.
    Fig. 5. Strong coupling between CQDs and SU8-SOI waveguide. At different angles, the peak energies of the PL split spectra change with the angle: (a) at waveguide width w4; (c) at w1; and (d) at w6. The blue and red curves represent UP and LP due to the strong coupling. Colored scatters are the peak energies of the PL spectra. The gray line is the cavity mode. The black crosses represent the experimental cavity modes at different angles. (b) PL spectra on SU8-SiO2 and SU8-SOI under the same experimental conditions. The black curve is the PL spectrum at angle 11.0° of the hybrid index structure, and the PL spectrum split into multiple peaks. At the same angle of 11.0°, the RL spectrum of the SU8-SOI without CQDs is shown by the blue curve.
    Zhen Zhen, Si-Yue Jin, Ren Jie, Hai-Yao Liang, Xing-Sheng Xu. Strong coupling between colloidal quantum dots and a microcavity with hybrid structure at room temperature[J]. Photonics Research, 2022, 10(4): 913
    Download Citation