• Photonics Research
  • Vol. 10, Issue 4, 913 (2022)
Zhen Zhen1、2, Si-Yue Jin1、2, Ren Jie1、2, Hai-Yao Liang1, and Xing-Sheng Xu1、2、*
Author Affiliations
  • 1State Key Laboratory of Integrated Optoelectronics, Institute of Semiconductors, Chinese Academy of Sciences, Beijing 100083, China
  • 2Center of Materials Science and Optoelectronics Engineering, University of Chinese Academy of Sciences, Beijing 100049, China
  • show less
    DOI: 10.1364/PRJ.448781 Cite this Article Set citation alerts
    Zhen Zhen, Si-Yue Jin, Ren Jie, Hai-Yao Liang, Xing-Sheng Xu. Strong coupling between colloidal quantum dots and a microcavity with hybrid structure at room temperature[J]. Photonics Research, 2022, 10(4): 913 Copy Citation Text show less

    Abstract

    The interaction between light and matter has always been the focus of quantum science, and the realization of truly strong coupling between an exciton and the optical cavity is a basis of quantum information systems. As a special semiconductor material, colloidal quantum dots have fascinating optical properties. In this study, the photoluminescence spectra of colloidal quantum dots are measured at different collection angles in microcavities based on hybrid refractive-index waveguides. The photon bound states in the continuum are found in the low–high–low refractive-index hybrid waveguides in the appropriate waveguide width region, where the photoluminescence spectra of colloidal quantum dots split into two or more peaks. The upper polaritons and lower polaritons avoid resonance crossings in the systems. The Rabi splitting energy of 96.0 meV can be obtained. The observed phenomenon of vacuum Rabi splitting at room temperature is attributed to the strong coupling between quantum dots and the bound states in the continuum.

    1. INTRODUCTION

    Quantum dots (QDs) are an important low-dimensional semiconductor material whose sizes in three dimensions are no more than twice the exciton Bohr radius of the corresponding semiconductor material. When QDs interact with their solid-state environment, we can obtain a light-atom continuum with excitonic Rabi rotation [14]. CdSe/ZnS as a kind of colloidal quantum dot (CQD) has been used to investigate photoluminescence (PL) blinking, power-law behavior, and single photon sources [57]. CdSe nanocrystal is a basic kind of CQD [8].

    The nonlinear optical phenomena caused by placing CQDs in optical microcavities are worthy of attention. When strong coupling occurs, the coupling between the light and matter will produce new mixing states, which is the basis of quantum information systems such as quantum entanglement, quantum phase gates, ultralow power switches, and lasers [911]. Most of the achievements for the cavity quantum electrodynamics require low temperatures [12] and complex manufacturing methods [13]. To achieve strong coupling at room temperature, the conditions are more severe. When the loss rate of the cavity and the decay rate of the oscillators are not enough to offset the coupling strength between two oscillators with the same energy, the vacuum Rabi splitting will occur [14].

    Recently, it has been reported that using 2D semiconductors and introducing a gain material embedded dielectric optical microcavity structure to study the strong coupling phenomenon at room temperature helps to obtain a Rabi splitting of about 36.0 meV [15]. There are also reports that researchers demonstrated the strong coupling between CdSe nanoplatelets and an open planar microcavity at room temperature, in which vacuum Rabi splitting of 66.0 meV was observed [16]. In addition, the surface plasmon resonator can satisfy a sufficiently small mode volume, and a strong coupling phenomenon can be observed [17]. These are all through scattering measurement research. However, strong coupling phenomena are sometimes difficult to interpret [18] because they are inevitably affected by other effects, such as enhanced absorption [19], Fano resonances in the weak coupling regime [20,21], or various polarization and symmetry artifacts. Therefore, only the scattering measurement is performed, and the evidence for characterizing strong coupling is not very convincing. But phenomena such as Fano interference cannot interfere with the study of PL spectroscopy; the splitting of the PL spectrum determinedly represents the generation of the phenomenon of vacuum Rabi splitting [12]. In larger systems, like metal films and Fabry–Perot (F–P) interferometers, the researchers usually could only see the report for the spectrum of the lower polariton, because the upper polariton (UP) will turn to an uncoupled incoherent state due to a very fast lifetime [2225]. Here, we creatively use a hybrid microstructure with a low–high–low refractive index to achieve strong coupling between CQDs and a microcavity at room temperature. In our experiments, PL spectral splitting could be observed on the ensemble level, and the transition of the UP was observed.

    At the same time, in our hybrid refractive-index waveguide, bound states can exist above the potential barrier. The existence of this phenomenon, the so-called bound state in the continuum (BIC) has been proven [26]. There have been some researches about BIC on photoelectronic structures [2730]. The application of BIC in waveguide structures with different refractive-index distributions has also been reported [31,32]. Under specific waveguide structure parameters, the leakage channels have a destructive interference, resulting in a lower optical loss. In this study, the photonic quasi-BIC in our special refractive-index waveguide was investigated. The PL spectral spitting was attributed to the strong coupling between F–P BIC and the exciton of the CQDs on the surface of the polymer-SOI waveguide.

    2. EXPERIMENT

    A. Cavity with BICs

    In the experiment, a Si waveguide with a height of 340 nm and varying width of w was fabricated on silicon dioxide (SiO2) with a 3 μm thickness (known as SOI) by electron beam lithography and the dry etching method. The width w of the waveguide cross section varied linearly from 450 nm to 10 μm. Then the polymer (SU8) was spin-coated onto the structure at 4000 r/min and prebaked at 95°C for 5 min to form a composite structure of the low-refractive-index on the high-refractive-index, as shown in Fig. 1(a).

    Quasi-BIC in hybrid refractive-index waveguide. (a) Schematic diagram of hybrid waveguide. The etched SOI is 340 nm thick with a gradually varying width w. SOI was top spin coated with an SU8 polymer. (b) Photonic potential of the hybrid waveguide. The red and dark gray lines plot wells of the TM and TE polarizations. The yellow region represents the TMC band that is above the TE potential. The black wavy line presents the TMB mode. (c) Calculated Q factors of the modes versus waveguide widths around 2.3 μm and 9 μm. The red curve represents the Q factor of the hybrid waveguide and the blue curve without the SU8 layer. The modal profiles for the waveguides with widths 2.3 μm, 2.34 μm, and 9.426 μm are, respectively, shown in (d)–(f).

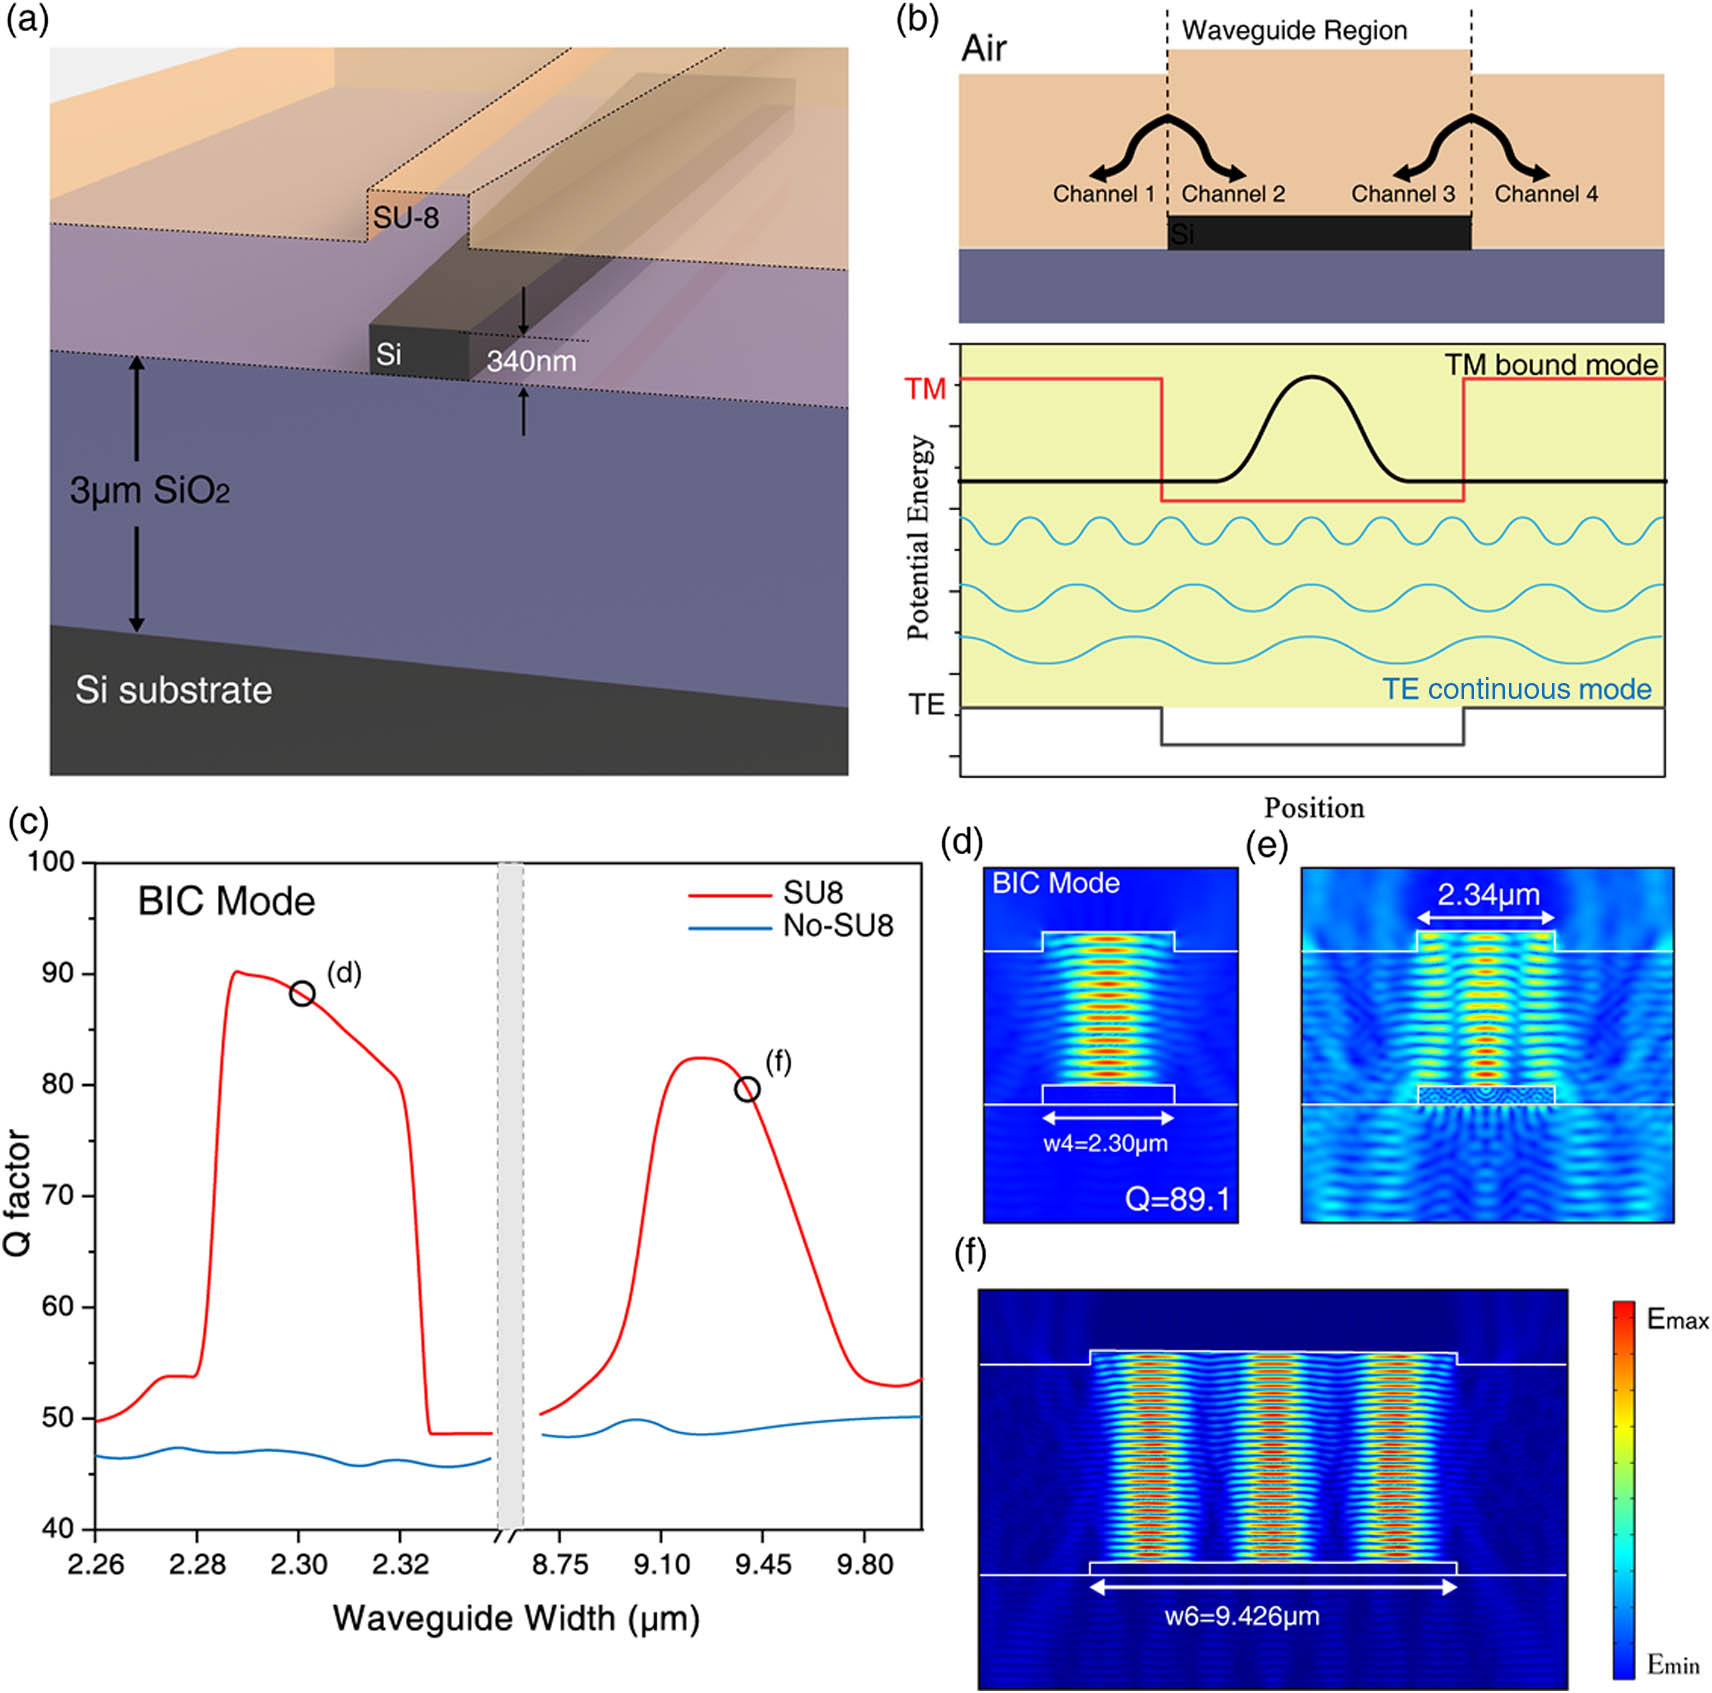
    Figure 1.Quasi-BIC in hybrid refractive-index waveguide. (a) Schematic diagram of hybrid waveguide. The etched SOI is 340 nm thick with a gradually varying width w. SOI was top spin coated with an SU8 polymer. (b) Photonic potential of the hybrid waveguide. The red and dark gray lines plot wells of the TM and TE polarizations. The yellow region represents the TMC band that is above the TE potential. The black wavy line presents the TMB mode. (c) Calculated Q factors of the modes versus waveguide widths around 2.3 μm and 9 μm. The red curve represents the Q factor of the hybrid waveguide and the blue curve without the SU8 layer. The modal profiles for the waveguides with widths 2.3 μm, 2.34 μm, and 9.426 μm are, respectively, shown in (d)–(f).

    In our low–high–low refractive-index hybrid structure, in the vertical direction, the silicon with a high refractive index acts as a reflecting mirror at the bottom, and the upper surface of the low refractive-index material acts as the top mirror to form the vertical SU8-SOI F–P cavity. On the other hand, when the width of the waveguide is suitable, the quasi-BIC is formed based on the photon-bound mechanism. This is because destructive interference occurs between various dissipative channels, leading to the loss of light being greatly reduced. In our hybrid refractive-index waveguide, the effective refractive index of the waveguide region [as shown in Fig. 1(b)] is higher than that of other regions, so a potential well can be effectively formed. Obviously, the light can be confined in this potential well. The refractive index of the upper layer (SU8) is smaller than the refractive index of the lower waveguide material (Si). We know that the electric potential is inversely proportional to the dielectric refractive index. The potential well of the vertical polarization mode should be higher than that of the horizontal polarization mode. By solving the light propagation equation [31] with a wavelength of 655 nm, the potential of the hybrid waveguide with width w=2.30  μm is shown in Fig. 1(b). In the SU8 film, the transverse magnetic bound (TMB) mode exists above the TE continuum (TEC) mode. So, the BICs have been formed. This phenomenon has been confirmed in some studies [31,33]. Constructive and destructive mode interference in the far field depends on the size of the cavity, and the modification of Q factor with the width of the waveguide can be seen in Fig. 1(c). A BIC modal profile is shown in Fig. 1(d). By changing the width of the waveguide, the interference cancellation between the leakage channels [1 and 3, and 2 and 4 in Fig. 1(b)] can occur, which improves the Q factor and produces the quasi-BIC mode. The calculated value of the microcavity Q factor with the waveguide width w=2.3  μm used in the next experiment is 89.1. We also calculated the Q factor of the cavity without the low–high hybrid refractive index, as shown in Fig. 1(c) with the blue curve. When the waveguide width deviates, as shown in Fig. 1(e), the BIC mode cannot form, and the light in the waveguide will leak from the edge of the waveguide. The TMB mode can dissipate through coupling to the TEC mode. This process occurs at the edge of the SU8 part of the upper end of the Si waveguide [Fig. 1(b) channels 1–4]. We regard the SU8-SOI waveguide as an approximately equal width w. The quantization condition for horizontal polarization is kHw=2πl, where l is the modulus with a positive integer value, and kH is the wave vector along the horizontal direction. We know that the effective refractive index is related to the wave vector. Therefore, the effective refractive index nH=nH(w,l) of the TEC mode for the SU8-SOI waveguide is related to the width, while the effective refractive index nV of the TMB mode is a constant. When nH(w,l)nV, the modes resonate. As a result of the interaction, the eigenmode of the waveguide is a hybrid mode of the TMB mode and TEC mode. The TMB mode can dissipate when coupled to the TEC modes, which occur at the edge sides of the waveguide.

    The Hamiltonian for this process can be expressed as [31] H=βbbb+mβmcmcm+mgm(cmb+h.c.).

    Here, integer m is the order of TEC mode, b and cm are, respectively, the annihilation of the TMB mode and mth TEC mode, βb and βm are the corresponding propagation constants, and gm is the coupling strength between the TMB and TEC modes. For the hybrid waveguide with a width w, the total coupling strength of TMB mode with the mth TEC mode gm is proportional to 1eikwww, where kw is the phase difference between the interfering coupling channels. Therefore, we can control the phase difference between the lossy channels to achieve destructive interference by designing the width of the waveguide according to the physical mechanism above. Specifically because of this, the quasi-BIC can only be generated when the width w is appropriate. The generation and disappearance of the BIC mode vary with the width of the waveguide. By our calculations, the quasi-BIC occurs at around 1.2 μm, 2.3 μm, 4.0 μm, and 9.4 μm, and the corresponding calculated Q factors are 82.3, 89.1, 85.6, and 80.0, respectively. As shown in Figs. 1(c)–1(f), we calculated the Q factors and BIC modal profiles with waveguide widths of 2.3 μm and 9.4 μm. Quasi-BIC can be generated at a suitable waveguide width, improving the Q factor. Therefore, in the SU8-SOI structure of the low refractive-index waveguide on a high refractive-index film, the F–P BIC can be generated when the width of the waveguide is appropriate.

    B. Strong Coupling between CQDs and F-P BIC

    Next, we exploited the F–P BIC for strong coupling. Using a calibrated pipette, 0.5 μL CQDs in an N-hexane solvent with a concentration of 1×10⁸  mol/L were drop-casted onto the waveguide structure, as shown in Fig. 2(a). After the solvent evaporates, the area covered by the quantum dots is about 1 cm2. The area is much larger than the size of the microcavity. Therefore, in the center of the area, the concentration of CQDs on the cavity is relatively uniform. The CQD material we used in the experiment was a semiconductor QD named QdotTM 655 ITKTM purchased from Thermo Fisher [34]. The CQDs were composed of a CdSe core and a ZnS shell. The PL and absorption spectra for the CQDs in solution can be found from Ref. [34]. The energy-level structure of the coupled CQDs cavity system is shown in Fig. 2(b), and a picture of the fabricated SU8-SOI waveguide is shown in Fig. 2(c). The CdSe/ZnS CQDs, which have a spectral center wavelength of about 655 nm, were excited at room temperature by a nonresonant continuous wave laser with a wavelength of 532 nm and excitation power of 4.0 mW. The PL spectra were measured in a confocal system with a microscope objective of a 40× magnification and a 0.6 numerical aperture (NA), as shown in Fig. 2(d). The diameter of the focused excitation spot was about 1.5 μm.

    Schematic diagram of waveguide structure and coupled CQD energy level. (a) CQDs were drop-casted onto the polymer waveguide surface. (b) Energy-level structure of the CQD-cavity system with large coupling strength. When strong coupling occurs, the exciton energy level G is split into two sub-energy levels. δ is the energy difference between them. The UP and LP transitions are indicated by red and blue arrows, respectively. ωc is eigenfrequency of the exciton. (c) Microscopic photograph of SU8-SOI waveguides with CQDs. (d) Experiment optical path and spectrum diagram.

    Figure 2.Schematic diagram of waveguide structure and coupled CQD energy level. (a) CQDs were drop-casted onto the polymer waveguide surface. (b) Energy-level structure of the CQD-cavity system with large coupling strength. When strong coupling occurs, the exciton energy level G is split into two sub-energy levels. δ is the energy difference between them. The UP and LP transitions are indicated by red and blue arrows, respectively. ωc is eigenfrequency of the exciton. (c) Microscopic photograph of SU8-SOI waveguides with CQDs. (d) Experiment optical path and spectrum diagram.

    When the CQDs are strongly coupled with the optical microcavity, the system has an energy level structure, as shown in Fig. 2(b) [35,36]. The exciton energy level G will split into two different energy levels with a spacing of δ=2g, where g is the coupling strength. In the case of strong coupling, the lower energy region branch is considered as the lower-polariton (LP) transition, while the upper polariton (UP) results in the high-energy region branch.

    First, we measured the PL spectrum of CQDs at different positions on the waveguide. The results are shown in Figs. 3(a)–3(f), and the waveguide widths are, respectively, w1=0.45  μm; w2=0.9  μm; w3=1.2  μm; w4=2.3  μm; w5=4.0  μm; and w6=9.4  μm. As shown in the previous calculations, the latter four waveguide widths (w3w6) have been proven to be able to generate BIC. The vertical dashed line represents the exciton transition energy of CQD in solution [37], which is 1.893 eV; the corresponding wavelength is 655 nm. In a certain width region [Figs. 3(a) and 3(b) with w1 and w2], the PL spectra of CQDs are represented as a major single spectral peak and two peaks on both sides. Using the multi-Gaussian function to fit the spectral peak, the main spectra occur at energies very close to the exciton transition energy of the CQDs. In Figs. 3(a) and 3(b), the main spectral peak is located, respectively, at 1.894 eV and 1.887 eV with a spectral width of 13.3 nm and 13.6 nm. In this waveguide width region, the small peaks in the high-energy region (the short-wavelength region) and the low-energy region (the long-wavelength region) are not obvious.

    PL spectra of CQDs at different widths on the waveguide, from (a) to (f), and the waveguide widths from w1 to w6 gradually increase. The vertical dashed line is the CQD exciton energy, and the value is 1. 893 eV. The red dotted line is the resulting curve fitted by the multi-Gaussian function.

    Figure 3.PL spectra of CQDs at different widths on the waveguide, from (a) to (f), and the waveguide widths from w1 to w6 gradually increase. The vertical dashed line is the CQD exciton energy, and the value is 1. 893 eV. The red dotted line is the resulting curve fitted by the multi-Gaussian function.

    In the region with an appropriate width w [shown in Figs. 3(c)–3(f)], the PL spectra of CQDs show two or even more peaks, which distribute on both sides of the exciton transition energy (1.893 eV). In Fig. 3(c), the two spectral peaks fitted by the bi-Gaussian function occur at 1.865 eV and 1.923 eV, respectively, both with peak spectral widths of 16.8 nm. The coupling between energy levels g and G of CQD in a microcavity can be represented by [37] H=(ωx+iγx2ggωc+iγc2),which is a Hamiltonian matrix where ωx and ωc are eigenfrequencies of the exciton state and the cavity mode, and γx and γc represent the CQD transition dephasing rate and the cavity decay rate. The condition to determine whether strong coupling occurs is [38] g>|γxγc|4.

    We measured the reflection (RL) spectrum of the cavity without CQDs, as shown in Fig. 3(c) with blue curve. γc corresponds to the line width of the RL spectrum at 1.893 eV with a value of 24.3 meV, and γx of 38.0 meV, and the distance between the two spectral peaks is 2g=58.0  meV>|γxγc|2=18.2  meV. Inequality (3) is satisfied, indicating that strong coupling occurred.

    The relative intensity of PL spectra generated by the LP transition in Fig. 3(c) is higher than that of the UP transition. At this point, there are more carriers at the |1, energy level than at the |1,+ energy level. For Figs. 3(d) and 3(e), the situation is reversed in that width region. The number of electrons for transition to high-energy levels is more than that to low-energy levels, which results in the relative intensity of the PL peak in the high-energy region being higher than that in the low-energy region. As the width w of the waveguide gradually increases, the number of the resonant modes of the microcavity gradually increases. Multiple spectral peaks occur at 1.826 eV, 1.877 eV, 1.917 eV, and 1.966 eV in Fig. 3(f). The spectral widths of the two spectral peaks near the exciton transition energy of CQDs are both 27.1 nm, and those of the two distant peaks are both 41.3 nm.

    The strong coupling between CQDs and cavities led to the splitting of the PL spectra, which depended on the collection angle. The PL spectrum variation of CQDs with the divergence angle of emission could be collected in the experiment. We used a spectrometer with a sensitive CCD to measure the spectral image over a period of time. A raw angle-resolved spectral image with a maximum collection angle of 36.9° could be measured using the microscope objective (40×/0.6NA) described above. The PL spectrum was measured very close to the focal length of the objective, and we took the acquisition angle as the corresponding angle of the NA. Moreover, the imaging plane of the spectrum was the Fourier plane of objective, so different in-plane momenta can represent different acquisition angles from 0° to 36.9°.

    As shown in Fig. 4(a), the brightness of the measured spectral image represents the relative strength of the PL spectrum, the horizontal axis represents the wavelength, and the vertical axis corresponds to the collection angle, which is symmetric at both ends and is centered at zero degrees. The CQDs spectrum corresponds to the width w4, the same as the waveguide in Fig. 3(d). The spectra at several collection angles extracted from the spectral image are shown in Fig. 4. By fitting the angle-resolved spectra with bi-Gaussian function, the relationship between the exciton transition energy and the angle can be obtained, as shown in Fig. 5(a). The peak splitting energies are represented by the block symbols in Fig. 5(a), which are distributed on both sides of exciton energy (1.893 eV).

    Spectral image of CQDs on the waveguide with width w4. (a) The spectral image was captured by PI-CCD, in which the brightness represents the relative intensity, the horizontal axis represents the wavelength, and the vertical axis represents the acquisition angle. Each bright horizontal line can be separated into a spectrum at corresponding angle. The angles corresponding to the spectra of (b), (c), and (d) are marked with red horizontal dotted lines. (b) Spectrum at angle 2.0°, and the red dotted line represents the fitted curve of the bi-Gaussian function. The spectra below are the same. (c) Spectrum at angle 12.3°. (d) Spectrum at angle -22.5°. At this angle, the relative intensity of the UP transition is lower than that of the LP transition.

    Figure 4.Spectral image of CQDs on the waveguide with width w4. (a) The spectral image was captured by PI-CCD, in which the brightness represents the relative intensity, the horizontal axis represents the wavelength, and the vertical axis represents the acquisition angle. Each bright horizontal line can be separated into a spectrum at corresponding angle. The angles corresponding to the spectra of (b), (c), and (d) are marked with red horizontal dotted lines. (b) Spectrum at angle 2.0°, and the red dotted line represents the fitted curve of the bi-Gaussian function. The spectra below are the same. (c) Spectrum at angle 12.3°. (d) Spectrum at angle -22.5°. At this angle, the relative intensity of the UP transition is lower than that of the LP transition.

    Strong coupling between CQDs and SU8-SOI waveguide. At different angles, the peak energies of the PL split spectra change with the angle: (a) at waveguide width w4; (c) at w1; and (d) at w6. The blue and red curves represent UP and LP due to the strong coupling. Colored scatters are the peak energies of the PL spectra. The gray line is the cavity mode. The black crosses represent the experimental cavity modes at different angles. (b) PL spectra on SU8-SiO2 and SU8-SOI under the same experimental conditions. The black curve is the PL spectrum at angle 11.0° of the hybrid index structure, and the PL spectrum split into multiple peaks. At the same angle of 11.0°, the RL spectrum of the SU8-SOI without CQDs is shown by the blue curve.

    Figure 5.Strong coupling between CQDs and SU8-SOI waveguide. At different angles, the peak energies of the PL split spectra change with the angle: (a) at waveguide width w4; (c) at w1; and (d) at w6. The blue and red curves represent UP and LP due to the strong coupling. Colored scatters are the peak energies of the PL spectra. The gray line is the cavity mode. The black crosses represent the experimental cavity modes at different angles. (b) PL spectra on SU8-SiO2 and SU8-SOI under the same experimental conditions. The black curve is the PL spectrum at angle 11.0° of the hybrid index structure, and the PL spectrum split into multiple peaks. At the same angle of 11.0°, the RL spectrum of the SU8-SOI without CQDs is shown by the blue curve.

    For this system, the eigenvalues can be expressed as [37] E±=E1+E22±(E1E2)24+|2g|2,where E1 is the mode energy of the cavity, E2 is the CQDs exciton transition energy, and g is the coupling strength. By fitting the experimental data (two sets of squares) with this formula, the fitted curves of energy can be obtained, which are represented by red and blue lines in Fig. 5(a). The squares represent the spectral peak energies in the experiment, the blue line represents the fitted curve of the upper transition, and the red line represents the lower branch. The gray line represents the F–P mode of the cavity and the horizontal gray dashed line represents the exciton energy of CQDs. We regard the blue curve as the UP transition and the red one as the LP transition. With an increase in the angle, the energy eigenvalues of the UP and the LP increase. As shown in Fig. 5(a), the UP and the LP transitions avoid resonance crossings. By fitting the UP transition and LP transition into the energy formula in Eq. (4), the Rabi splitting energy of the whole angle region can be obtained as 96.0 meV. We found a similar situation in the microcavities with waveguide widths w3 and w5, and the Rabi splitting energies were 58.0 meV and 51.9 meV, respectively.

    The optical cavity formed by the low–high–low refractive-index structure is very important. To prove this, we measured the PL spectrum of CQDs with a concentration of 1×10⁸  mol/L on the structure formed by the SU8 polymer on bulk silica (SiO2) under the same experimental conditions. As shown in Fig. 5(b), the green curve (PL_SU8/SiO2) shows the CQDs spectrum without a hybrid index structure microcavity. The spectrum does not split and shows a single Gaussian peak. The peak energy fitted by the Gaussian function is 1.890 eV and has a line width of 66.4 meV. The peak energy is slightly lower than the CQD exciton energy (1.893 eV), where the redshift emission wavelength may be due to radiative and nonradiative energy transfer in an ensemble of CQDs and the coupling between CQDs and the SU8/SiO2 structure. The black curve is the PL spectrum of CQDs on a low–high–low refractive-index structure (SU8/SOI). The blue curve is the RL spectrum of the same low–high–low refractive-index structure without CQDs. An RL spectral peak is nearly resonant with the exciton energy. The PL spectrum splits into two peaks at 1.858 eV and 1.923 eV. The line widths of the peak are 39.5 meV and 38.5 meV, respectively. This special hybrid index structure resulted in the splitting of the PL spectrum, and the spectral linewidth of the splitting peaks is much narrower than that of the unsplit spectrum.

    3. DISCUSSION

    We observed strong coupling of the CQDs associated with the F–P BIC of the cavity based on a variation-width waveguide. Benefiting from the localization effect of the quasi-BIC mode on the light field, the eigenmode of the cavity can resonate with the exciton transition of the CQDs, resulting in Rabi splitting, which is manifested as the splitting phenomenon of the PL spectrum. It is a strong coupling between the CQDs and the cavity. The Q factor of F–P BIC is not high, calculated as 89.1 in Fig. 1(c) for the width w4 and experimentally obtained as a 24.0 meV width of RL spectrum in Fig. 3(c) for the width w3. The low-Q micro-nano structure can still produce quasi-BIC so that the light of the relevant wavelength is well confined within a certain size [39,40]. The line width of the mode is comparable to that of the PL spectrum of CQDs. The F–P BIC can provide a considerable lifetime of the mode. BIC can occur at the correct wavelength, which is close to the exciton energy of the CQDs (655 nm in our experiments). These are important to generate strong coupling.

    That is why we can only observe strong coupling with a certain waveguide width because, as mentioned above, quasi-BIC can only be formed when the waveguide width is appropriate. For example, in some width regions of the waveguide, the coupling strength between the CQDs and the F–P cavity is not high; therefore, the spectral splitting is not obvious. The peak energies varying with the angle are shown in Fig. 5(c), which corresponds to the spectrum in Fig. 3(a) (w1). The uncoupled emission peaks almost remain unchanged with the angle and are distributed along with the exciton energy level [dotted line in Fig. 5(c)] of the CQDs. In this waveguide width, because of the absence of TEC modes, the quasi-BIC mode cannot be formed.

    As for the bigger widths, the TE mode supports multiple modes in the CQDs’ spectral range. These modes and the F–P BIC mode in the vertical direction jointly act on the exciton emission of CQDs, causing the PL spectrum to produce more peaks, as shown in Figs. 3(e) and 3(f). For width w6, the change of peak energies with the angle is shown in Fig. 5(d). To confirm, we measured the RL spectrum without CQDs with an angle of 11.0° of the cavity, as shown in Fig. 5(b) with the blue curve. It can be seen that the spectrum (green curve) from the exciton transition of the CQDs is very broad, and there are three RL spectral peaks in the PL spectral range. Near the exciton energy level (1.893 eV), the PL spectrum from CQDs on SU8-SOI splits into two peaks at 1.881 eV and 1.911 eV. An RL peak at 1.891 eV with a width of 26.4 meV is located between the two PL spectral peaks. This means that the exciton energy level of the CQDs will resonate with the cavity mode represented by the RL spectrum. Obviously, the PL splitting near the exciton level is due to the strong coupling between this cavity mode and the exciton. The energies of these split peaks are indicated by blue and red dots in Fig. 5(d). We also use the strong coupling formula Eq. (4) to fit, then, as shown by the blue and red curves representing the UP and LP transition, respectively, in Fig. 5(d). The curves show a clear anti-crossing, and the Rabi splitting value can be obtained as 59.8 meV. Using the results of the fitting to the experimental data of PL spectra by Eq. (4), we can draw the change of the cavity mode (Cavity 0) with the angle, as shown by the gray curve in Fig. 5(d). We also measured the cavity modes changed with the angle (RL spectra). The peak energies of RL spectra are shown by the cross symbols in Fig. 5(d). The results of the experimental data are in good agreement with the fitting (gray line). The cavity mode intersects the CQD exciton energy (horizontal dashed line) at approximately 11°. This means that at this angle, the cavity mode resonates with the exciton energy along with the coupling strength exceeding the mean of the decay rates, thus realizing a truly strong coupling.

    However, as shown in Fig. 5(b), the PL spectrum at 11.0° also shows peaks at 1.846 eV and 1.943 eV, and the widths of the spectrum are 16.5 meV and 14.1 meV, respectively. In fact, this is due to the Purcell effect caused by the weak coupling between the CQDs and the microcavity, which results in the enhanced luminescence of the CQDs. At the same energy position, the RL spectrum also has the spectral peak, indicating that there is a microcavity mode. As shown in Fig. 5(b), the RL peaks are located at 1.840 eV and 1.942 eV, which are very close to the peaks of the PL spectrum. In the higher- and lower-energy regions, the variation of the energies of these two peaks with angle is also shown in Fig. 5(d) (RL with cross symbols, PL with circles). The RL and PL spectral peaks appear at very close energy positions with the same changing trend, which shows the weak coupling between the CQDs and the cavity modes. The RL and PL spectra have a slight deviation in position, which may be due to the high concentration of quantum dots that possibly form a thin film on top of the SU8 with a higher refractive index than air. Through simulation, it is found that the CQDs layer will not have a great impact on our model. Therefore, we did not take into account the CQDs in modeling.

    To sum up, in the hybrid material with a low–high–low refractive index, the strong coupling was generated between the CQDs and F–P BIC at room temperature. We have observed Rabi splitting due to strong coupling by measuring the PL spectrum. On a single layer material with a low refractive index (SiO2), there was no such phenomenon. In the hybrid refractive-index waveguide because of the destructive interference between optical leakage channels, the optical loss was significantly reduced. Through the feature, we have achieved the strong coupling between the CQDs and the microcavity at room temperature, and obtained polariton dispersion with the anti-crossing phenomenon and the corresponding Rabi splitting energy.

    4. CONCLUSION

    In conclusion, we fabricated SOI-material waveguides with varying widths. The hybrid low–high–low waveguide was formed by coating the SU8 polymer with a low refractive index (compared to silicon) onto the SOI. The special structure formed F–P BIC. Due to the destructive interference between different loss channels, the optical field is localized in the waveguide. The PL spectra of CQDs on the waveguides were measured and analyzed at different acquisition angles. Because of the strong coupling between the exciton of CQDs and the cavity modes, the PL spectrum split into two or more peaks. Strong coupling was generated between CQDs and F–P BIC, and the Rabi splitting energy reached 96.0 meV. This provides a new idea for the future realization of quantum integrated circuits and the construction of a quantum optical experimental platform.

    Acknowledgment

    Acknowledgment. Projects were supported by the National Natural Science Foundation of China, the Strategic Priority Research Program (A) of Chinese Academy of Sciences, and the National Key Research and Development Program of China.

    References

    [1] A. Zrenner, E. Beham, S. Stufler, F. Findeis, M. Bichler, G. Abstreiter. Coherent properties of a two-level system based on a quantum-dot photodiode. Nature, 418, 612-614(2002).

    [2] S. Stufler, P. Ester, A. Zrenner, M. Bichler. Quantum optical properties of a single InxGa1-xAs-GaAs quantum dot two-level system. Phys. Rev. B, 72, 121301(2005).

    [3] T. Guenther, C. Lienau, T. Elsaesser, M. Glanemann, V. M. Axt, T. Kuhn, S. Eshlaghi, A. D. Wieck. Erratum: coherent nonlinear optical response of single quantum dots studied by ultrafast near-field spectroscopy. Phys. Rev. Lett., 89, 179901(2002).

    [4] H. Takagi, T. Nakaoka, K. Watanabe, N. Kumagai, Y. Arakawa. Coherently driven semiconductor quantum dot at a telecommunication wavelength. Opt. Express, 16, 13949-13954(2008).

    [5] A. L. Efros, M. Rosen. Random telegraph signal in the photoluminescence intensity of a single quantum dot. Phys. Rev. Lett., 78, 1110-1113(1997).

    [6] C. Galland, Y. Ghosh, A. Steinbrück, M. Sykora, J. A. Hollingsworth, V. I. Klimov, H. Htoon. Two types of luminescence blinking revealed by spectroelectrochemistry of single quantum dots. Nature, 479, 203-207(2011).

    [7] M. Kuno, D. P. Fromm, H. F. Hamann, A. Gallagher, D. J. Nesbitt. Nonexponential ‘blinking’ kinetics of single CdSe quantum dots: a universal power law behavior. J. Chem. Phys., 112, 3117-3120(2000).

    [8] H. Gross, J. M. Hamm, T. Tufarelli, O. Hess, B. Hecht. Near-field strong coupling of single quantum dots. Sci. Adv., 4, eaar4906(2018).

    [9] Y. Sato, Y. Tanaka, J. Upham, Y. Takahashi, T. Asano, S. Noda. Strong coupling between distant photonic nanocavities and its dynamic control. Nat. Photonics, 6, 56-61(2012).

    [10] J. D. Thompson, T. G. Tiecke, N. P. de Leon, J. Feist, A. V. Akimov, M. Gullans, A. S. Zibrov, V. Vuletic, M. D. Lukin. Coupling a single trapped atom to a nanoscale optical cavity. Science, 340, 1202-1205(2013).

    [11] M. Keller, B. Lange, K. Hayasaka, W. Lange, H. Walther. Deterministic coupling of single ions to an optical cavity. Appl. Phys. B, 76, 125-128(2003).

    [12] H. X. Leng, B. Szychowski, M. C. Daniel, M. Pelton. Strong coupling and induced transparency at room temperature with single quantum dots and gap plasmons. Nat. Commun., 9, 4012(2018).

    [13] J. Vuckovic, Y. Yamamoto. Photonic crystal microcavities for cavity quantum electrodynamics with a single quantum dot. Appl. Phys. Lett., 82, 2374-2376(2003).

    [14] G. Khitrova, H. M. Gibbs, M. Kira, S. W. Koch, A. Scherer. Vacuum Rabi splitting in semiconductors. Nat. Phys., 2, 81-90(2006).

    [15] X. C. Zhao, Y. H. Yan, Z. Z. Cui, F. Liu, S. W. Wang, L. X. Sun, Y. W. Chen, W. Lu. Realization of strong coupling between 2D excitons and cavity photons at room temperature. Opt. Lett., 45, 6571-6574(2020).

    [16] L. C. Flatten, S. Christodoulou, R. K. Patel, A. Buccheri, D. M. Coles, B. P. L. Reid, R. A. Taylor, I. Moreels, J. M. Smith. Strong exciton–photon coupling with colloidal nanoplatelets in an open microcavity. Nano Lett., 16, 7137-7141(2016).

    [17] R. Chikkaraddy, B. de Nijs, F. Benz, S. J. Barrow, O. A. Scherman, E. Rosta, A. Demetriadou, P. Fox, O. Hess, J. J. Baumberg. Single-molecule strong coupling at room temperature in plasmonic nanocavities. Nature, 535, 127-130(2016).

    [18] M. Wersäll, J. Cuadra, T. J. Antosiewicz, S. Balci, T. Shegai. Observation of mode splitting in photoluminescence of individual plasmonic nanoparticles strongly coupled to molecular excitons. Nano Lett., 17, 551-558(2017).

    [19] G. L. Liu, Y.-T. Long, Y. Choi, T. Kang, L. P. Lee. Quantized plasmon quenching dips nanospectroscopy via plasmon resonance energy transfer. Nat. Methods, 4, 1015-1017(2007).

    [20] X. Wu, S. K. Gray, M. Pelton. Quantum-dot-induced transparency in a nanoscale plasmonic resonator. Opt. Express, 18, 23633-23645(2010).

    [21] Z. J. Yang, T. J. Antosiewicz, T. Shegai. Role of material loss and mode volume of plasmonic nanocavities for strong plasmon-exciton interactions. Opt. Express, 24, 20373-20381(2016).

    [22] J. Bellessa, C. Bonnand, J. C. Plenet, J. Mugnier. Strong coupling between surface plasmons and excitons in an organic semiconductor. Phys. Rev. Lett., 93, 036404(2004).

    [23] J. R. Tischler, M. S. Bradley, V. Bulović, J. H. Song, A. Nurmikko. Strong coupling in a microcavity LED. Phys. Rev. Lett., 95, 036401(2005).

    [24] V. M. Agranovich, M. Litinskaia, D. G. Lidzey. Cavity polaritons in microcavities containing disordered organic semiconductors. Phys. Rev. B, 67, 085311(2003).

    [25] T. Schwartz, J. A. Hutchison, J. Léonard, C. Genet, S. Haacke, T. W. Ebbesen. Polariton dynamics under strong light–molecule coupling. ChemPhysChem, 14, 125-131(2013).

    [26] J. V. Neumann, E. Wigner. On some peculiar discrete eigenvalues. Phys. Z., 30, 465-467(1929).

    [27] X. Gao, B. Zhen, M. Soljačić, H. Chen, C. W. Hsu. Bound states in the continuum in fiber Bragg gratings. ACS Photon., 6, 2996-3002(2019).

    [28] D. C. Marinica, A. G. Borisov, S. V. Shabanov. Bound states in the continuum in photonics. Phys. Rev. Lett., 100, 183902(2008).

    [29] C. W. Hsu, B. Zhen, J. Lee, S.-L. Chua, S. G. Johnson, J. D. Joannopoulos, M. Soljačić. Observation of trapped light within the radiation continuum. Nature, 499, 188-191(2013).

    [30] A. Kodigala, T. Lepetit, Q. Gu, B. Bahari, Y. Fainman, B. Kanté. Lasing action from photonic bound states in continuum. Nature, 541, 196-199(2017).

    [31] C. Zou, J. Cui, F. Sun, X. Xiong, X. Zou, Z. Han, G. Guo. Guiding light through optical bound states in the continuum for ultrahigh-Q microresonators. Laser Photon. Rev., 9, 114-119(2015).

    [32] X. Xu, S. Jin. Strong coupling of single quantum dots with low-refractive-index/high-refractive-index materials at room temperature. Sci. Adv., 6, eabb3095(2020).

    [33] Z. Yu, X. Xi, J. Ma, H. K. Tsang, C. Zou, X. Sun. Photonic integrated circuits with bound states in the continuum. Optica, 6, 1342-1348(2019).

    [34] Thermo Fisher. The Molecular Probes Handbook, Qdot Nanocrystals, Section 6.6.

    [35] T. H. Stievater, X. Li, D. G. Steel, D. Gammon, D. S. Katzer, D. Park, C. Piermarocchi, L. J. Sham. Rabi oscillations of excitons in single quantum dots. Phys. Rev. Lett., 87, 133603(2001).

    [36] A. L. Efros, M. Rosen, M. Kuno, M. Nirmal, D. J. Norris, M. Bawendi. Band-edge exciton in quantum dots of semiconductors with a degenerate valence band: dark and bright exciton states. Phys. Rev. B, 54, 4843-4856(1996).

    [37] J. Wiersig. Formation of long-lived, scarlike modes near avoided resonance crossings in optical microcavities. Phys. Rev. Lett., 97, 253901(2006).

    [38] J. P. Reithmaier, G. Sek, A. Löffler, C. Hofmann, S. Kuhn, S. Reitzenstein, L. V. Keldysh, V. D. Kulakovskii, T. L. Reinecke, A. Forchel. Strong coupling in a single quantum dot-semiconductor microcavity system. Nature, 432, 197-200(2004).

    [39] E. Melik-Gaykazyan, K. Koshelev, J. H. Choi, S. S. Kruk, A. Bogdanov, H. G. Park, Y. Kivshar. From Fano to quasi-BIC resonances in individual dielectric nanoantennas. Nano Lett., 21, 1765-1771(2021).

    [40] K. Koshelev, S. Kruk, E. Melik-Gaykazyan, J. H. Choi, A. Bogdanov, H. G. Park, Y. Kivshar. Subwavelength dielectric resonators for nonlinear nanophotonics. Science, 367, 288-292(2020).

    Zhen Zhen, Si-Yue Jin, Ren Jie, Hai-Yao Liang, Xing-Sheng Xu. Strong coupling between colloidal quantum dots and a microcavity with hybrid structure at room temperature[J]. Photonics Research, 2022, 10(4): 913
    Download Citation