• Photonics Research
  • Vol. 10, Issue 4, 989 (2022)
Lingxiao Shan1, Juanjuan Ren1, Qi Zhang1, Qi Liu1、2, Yun Ma1, Qihuang Gong1、2、3、4, and Ying Gu1、2、3、4、*
Author Affiliations
  • 1State Key Laboratory for Mesoscopic Physics, Department of Physics, Peking University, Beijing 100871, China
  • 2Frontiers Science Center for Nano-optoelectronics & Collaborative Innovation Center of Quantum Matter & Beijing Academy of Quantum Information Sciences, Peking University, Beijing 100871, China
  • 3Collaborative Innovation Center of Extreme Optics, Shanxi University, Taiyuan 030006, China
  • 4Peking University Yangtze Delta Institute of Optoelectronics, Nantong 226010, China
  • show less
    DOI: 10.1364/PRJ.449106 Cite this Article Set citation alerts
    Lingxiao Shan, Juanjuan Ren, Qi Zhang, Qi Liu, Yun Ma, Qihuang Gong, Ying Gu. Generation and modulation of non-classical light in a strongly coupled photon–emitter system[J]. Photonics Research, 2022, 10(4): 989 Copy Citation Text show less
    (a) Schematic diagram of the strongly coupled photonic-crystal–plasmonic-emitter system. The inset depicts the electric field profile of the band-edge mode. (b) Calculated absorption spectrum of AgNP (orange solid curve), and transmission spectra of the system with AgNP (blue dashed curve) and without AgNP (green dotted curve). (c) Coupling strength g, cavity decay rate κ, and emitter decay rate γ as functions of the refractive index n. The inset depicts the output spectrum from transmitted photon S(δ)∝1πRe∫⟨a†(τ)a(0)⟩eiδτdτ showing Rabi splitting. δ is the detuning between the transmitted photon and the pump field. (d) Normalized AgNP absorption spectra under varied refractive indices (n=3.40–3.50) of PhC materials, which describes the shift of the band-edge mode.
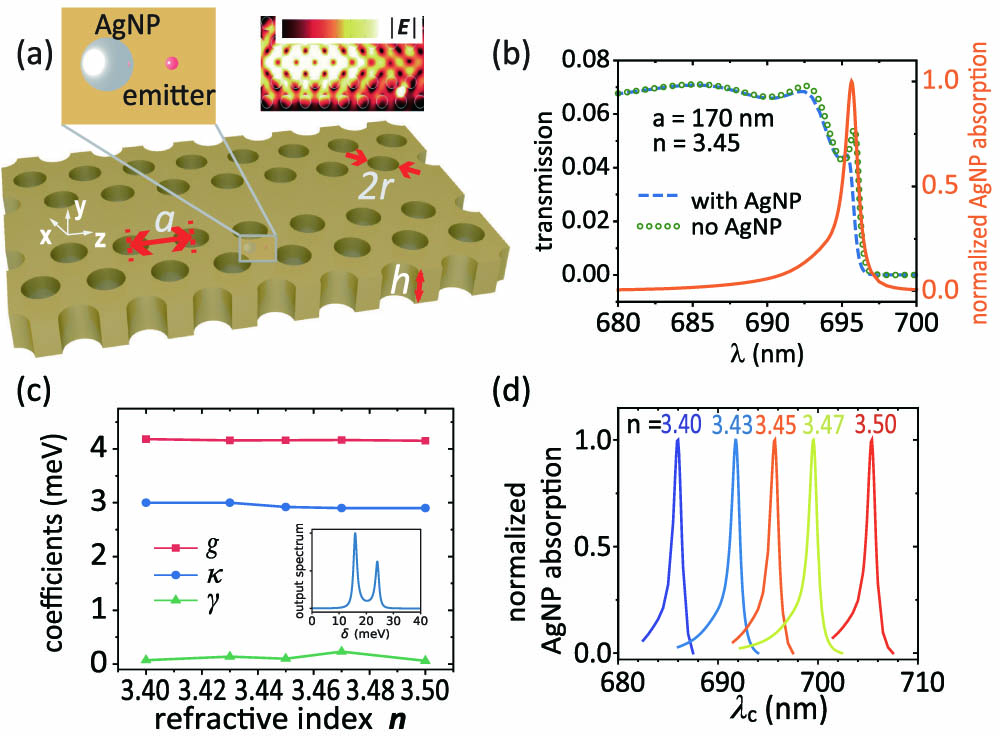
    Fig. 1. (a) Schematic diagram of the strongly coupled photonic-crystal–plasmonic-emitter system. The inset depicts the electric field profile of the band-edge mode. (b) Calculated absorption spectrum of AgNP (orange solid curve), and transmission spectra of the system with AgNP (blue dashed curve) and without AgNP (green dotted curve). (c) Coupling strength g, cavity decay rate κ, and emitter decay rate γ as functions of the refractive index n. The inset depicts the output spectrum from transmitted photon S(δ)1πRea(τ)a(0)eiδτdτ showing Rabi splitting. δ is the detuning between the transmitted photon and the pump field. (d) Normalized AgNP absorption spectra under varied refractive indices (n=3.403.50) of PhC materials, which describes the shift of the band-edge mode.
    Generation of non-classical light with single photon and squeezing properties. (a) Energy-level diagram of the system. Δa (Δc) is the detuning between the emitter ωa (band-edge mode ωc) and pump light ω. g,E represent mode–emitter and pump–emitter couplings. κ, γ denote decays from the mode and emitter. (b) Dressed states of the effective Hamiltonian. Orange (green) arrow denotes that the first photon is resonant (off resonance) with the cavity–emitter system, and the subsequent photon is prohibited (permitted) because it is off (in) resonance with higher dressed states. (c) Calculated second-order correlation function g(2)(0) and (d) normal-ordered quadrature fluctuation ⟨:ΔXπ/22:⟩ from master equation with Quantum Toolbox in Python (solid curve) and from analytical solution [Eqs. (4) and (5)] of effective Hamiltonian (dashed curve).
    Fig. 2. Generation of non-classical light with single photon and squeezing properties. (a) Energy-level diagram of the system. Δa (Δc) is the detuning between the emitter ωa (band-edge mode ωc) and pump light ω. g,E represent mode–emitter and pump–emitter couplings. κ, γ denote decays from the mode and emitter. (b) Dressed states of the effective Hamiltonian. Orange (green) arrow denotes that the first photon is resonant (off resonance) with the cavity–emitter system, and the subsequent photon is prohibited (permitted) because it is off (in) resonance with higher dressed states. (c) Calculated second-order correlation function g(2)(0) and (d) normal-ordered quadrature fluctuation :ΔXπ/22: from master equation with Quantum Toolbox in Python (solid curve) and from analytical solution [Eqs. (4) and (5)] of effective Hamiltonian (dashed curve).
    (a) Calculated second-order correlation function g(2)(0) and (b) minima of normal-ordered quadrature fluctuation ⟨:ΔXθ2:⟩min versus cavity–pump detuning Δc and emitter–pump detuning Δa. First and second rungs of dressed states E1±,E2± are marked by purple curves. (c) Second-order correlation function g(2)(0) and fluctuation correlation functions I0,I1,I2 with varied Δa when Δc−Δa=0.95 meV. (d) Squeezing properties for Δc−Δa=0.95 meV. The optimal single photon and squeezing properties appear at Δc=−3.40 meV and Δa=−4.35 meV, which correspond to white dashed lines in (a) and (b).
    Fig. 3. (a) Calculated second-order correlation function g(2)(0) and (b) minima of normal-ordered quadrature fluctuation :ΔXθ2:min versus cavity–pump detuning Δc and emitter–pump detuning Δa. First and second rungs of dressed states E1±,E2± are marked by purple curves. (c) Second-order correlation function g(2)(0) and fluctuation correlation functions I0,I1,I2 with varied Δa when ΔcΔa=0.95  meV. (d) Squeezing properties for ΔcΔa=0.95  meV. The optimal single photon and squeezing properties appear at Δc=3.40  meV and Δa=4.35  meV, which correspond to white dashed lines in (a) and (b).
    (a) Schematic diagram of every part of the decay rates. (b) Coupling efficiency β and directionality D excited by a linearly polarized emitter (upper inset) and a circularly polarized emitter (lower inset) in our system. Electric field distributions under excitation of (c) linearly polarized emitter and (d) circularly polarized emitter. The guided part γWG and scattering part γfree are denoted by blue arrows and red arrows, respectively.
    Fig. 4. (a) Schematic diagram of every part of the decay rates. (b) Coupling efficiency β and directionality D excited by a linearly polarized emitter (upper inset) and a circularly polarized emitter (lower inset) in our system. Electric field distributions under excitation of (c) linearly polarized emitter and (d) circularly polarized emitter. The guided part γWG and scattering part γfree are denoted by blue arrows and red arrows, respectively.
    (a) Schematic diagram of calculation module of strongly coupled photonic-crystal–plasmonic-emitter system. The silver nanoparticle and the emitter are shown by a red circle and an arrow, respectively. (b) Cross section of the module. The PhC layer is between two air layers. (c) Integral region Σ for calculation of total energy Ξ of the band-edge mode. Most of the field excited by the emitter is included in the integral region.
    Fig. 5. (a) Schematic diagram of calculation module of strongly coupled photonic-crystal–plasmonic-emitter system. The silver nanoparticle and the emitter are shown by a red circle and an arrow, respectively. (b) Cross section of the module. The PhC layer is between two air layers. (c) Integral region Σ for calculation of total energy Ξ of the band-edge mode. Most of the field excited by the emitter is included in the integral region.
    Output spectrum from the transmitted photon S(δ)=1πRe∫⟨a†(τ)a(0)⟩eiδτdτ of the band-edge mode when μ=0.25e nm,0.3e nm, 0.5e nm, 1e nm, where Rabi splitting appears when μ is larger than 0.3e nm. Here, Δ=Δa=Δc is set as 10 meV.
    Fig. 6. Output spectrum from the transmitted photon S(δ)=1πRea(τ)a(0)eiδτdτ of the band-edge mode when μ=0.25e  nm,0.3e  nm,0.5e  nm,1e  nm, where Rabi splitting appears when μ is larger than 0.3e  nm. Here, Δ=Δa=Δc is set as 10 meV.
    (a), (b) g(2)(0) and ⟨:ΔXθ2:⟩min with varied Δa,Δc. Two situations (Δc−Δa=5, 10 meV) are shown by dashed lines, which represent photon bunching with squeezing and without squeezing, respectively. (c), (e) g(2)(0) and I0,1,2 when Δc−Δa=5, 10 meV, respectively. (d), (f) State populations when Δc−Δa=5, 10 meV. The vertical dashed lines in (c)–(f) correspond to the first and second rungs of dressed states.
    Fig. 7. (a), (b) g(2)(0) and :ΔXθ2:min with varied Δa,Δc. Two situations (ΔcΔa=5,10  meV) are shown by dashed lines, which represent photon bunching with squeezing and without squeezing, respectively. (c), (e) g(2)(0) and I0,1,2 when ΔcΔa=5,10  meV, respectively. (d), (f) State populations when ΔcΔa=5,10  meV. The vertical dashed lines in (c)–(f) correspond to the first and second rungs of dressed states.
    g(2)(0) as a function of cavity and emitter decays κ, γ. The single photon property is weakened with increasing cavity and emitter decays.
    Fig. 8. g(2)(0) as a function of cavity and emitter decays κ, γ. The single photon property is weakened with increasing cavity and emitter decays.
    Lingxiao Shan, Juanjuan Ren, Qi Zhang, Qi Liu, Yun Ma, Qihuang Gong, Ying Gu. Generation and modulation of non-classical light in a strongly coupled photon–emitter system[J]. Photonics Research, 2022, 10(4): 989
    Download Citation