• Journal of Infrared and Millimeter Waves
  • Vol. 39, Issue 6, 667 (2020)
Ye YUAN1、2, Xiang-Bin SU1、2, Cheng-ao YANG1、2, Yi ZHANG1、2, Jin-Ming SHANG1、2, Sheng-Wen XIE1、2, Yu ZHANG1、2、*, Hai-Qiao NI1、2, Ying-Qiang XU1、2, and Zhi-Chuan NIU1、2、3、4
Author Affiliations
  • 1State Key Laboratory for Superlattices and Microstructures, Institute of Semiconductors, Chinese Academy of Sciences, Beijing100083, China
  • 2Center of Materials Science and Optoelectronics Engineering,University of Chinese Academy of Sciences, Beijing100049, China
  • 3Beijing Academy of Quantum Information Sciences, Beijing100193, China
  • 4Laboratory of Solid Quantum Material Center, College of Physics and Electronic Engineering, Shanxi University, Taiyuan030006, China
  • show less
    DOI: 10.11972/j.issn.1001-9014.2020.06.001 Cite this Article
    Ye YUAN, Xiang-Bin SU, Cheng-ao YANG, Yi ZHANG, Jin-Ming SHANG, Sheng-Wen XIE, Yu ZHANG, Hai-Qiao NI, Ying-Qiang XU, Zhi-Chuan NIU. Molecular beam epitaxial growth of InAs quantum dots on GaAs for high characteristics temperature lasers[J]. Journal of Infrared and Millimeter Waves, 2020, 39(6): 667 Copy Citation Text show less
    The structure of the QD laser and the structure of the active region
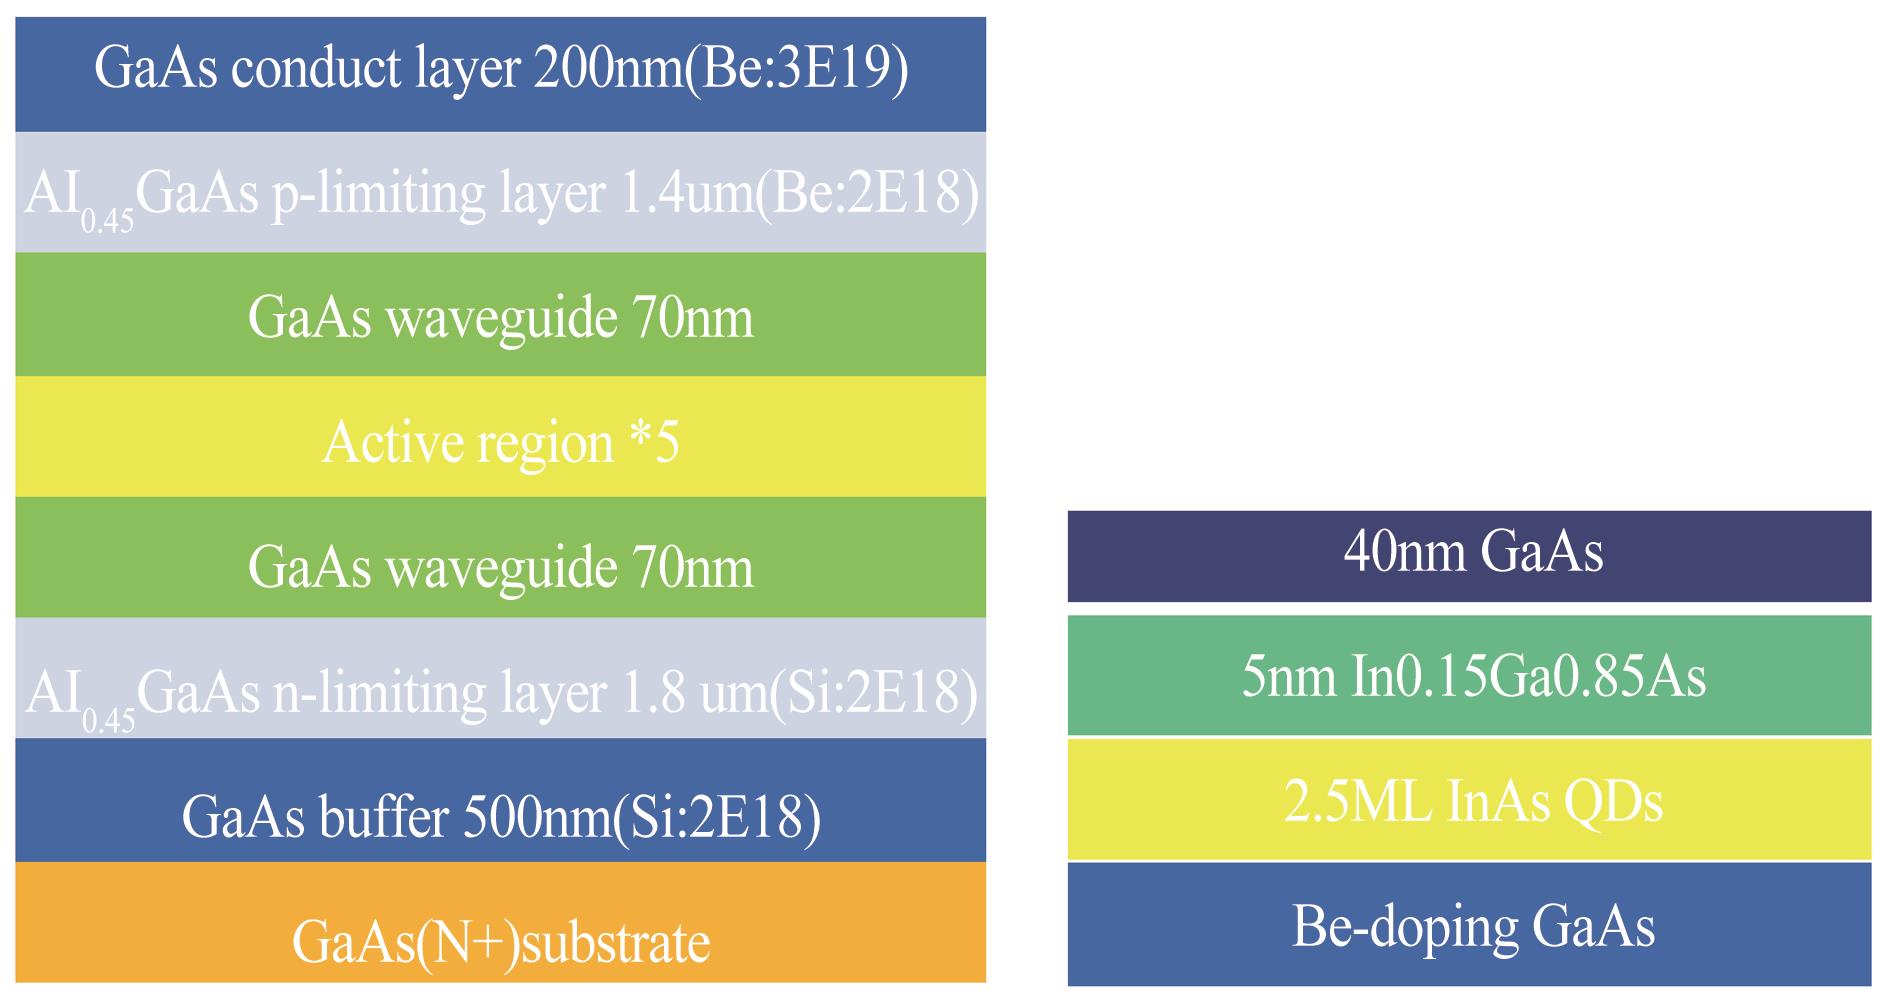
    Fig. 1. The structure of the QD laser and the structure of the active region
    PL spectrum of the three QDs samples with growth temperature of 510℃,520℃ and 530℃
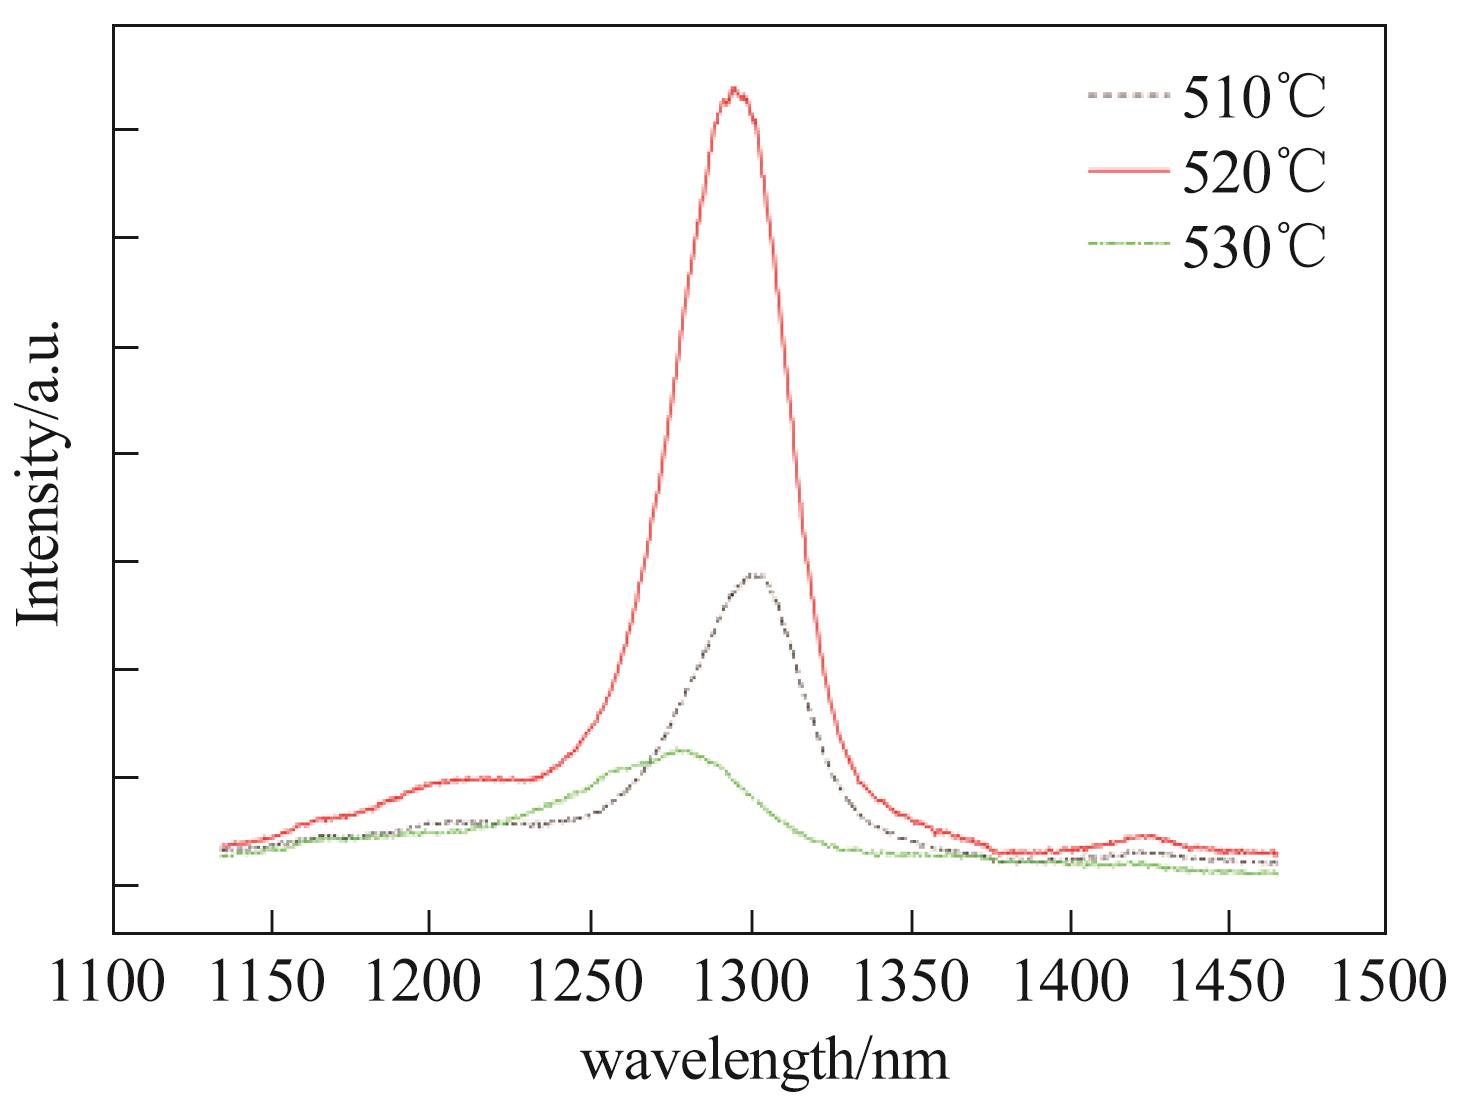
    Fig. 2. PL spectrum of the three QDs samples with growth temperature of 510℃,520℃ and 530℃
    Atomic force microscope (AFM)image of the three QDs samples (a)510 ℃,(b)520 ℃, and (c)530 ℃)
    Fig. 3. Atomic force microscope (AFM)image of the three QDs samples (a)510 ℃,(b)520 ℃, and (c)530 ℃)
    P-I-V and WPE characteristics of the laser at CW mode
    Fig. 4. P-I-V and WPE characteristics of the laser at CW mode
    Lasing spectrum at RT (The central wavelength is 1.3 μm)
    Fig. 5. Lasing spectrum at RT (The central wavelength is 1.3 μm)
    The power-current(P-I) characteristics in different temperature (5∼80℃) and the fitting curve between threshold current and temperature
    Fig. 6. The power-current(P-I) characteristics in different temperature (5∼80℃) and the fitting curve between threshold current and temperature
    Ye YUAN, Xiang-Bin SU, Cheng-ao YANG, Yi ZHANG, Jin-Ming SHANG, Sheng-Wen XIE, Yu ZHANG, Hai-Qiao NI, Ying-Qiang XU, Zhi-Chuan NIU. Molecular beam epitaxial growth of InAs quantum dots on GaAs for high characteristics temperature lasers[J]. Journal of Infrared and Millimeter Waves, 2020, 39(6): 667
    Download Citation