
Xin Cao, Michael Zopf, Fei Ding. Telecom wavelength single photon sources[J]. Journal of Semiconductors, 2019, 40(7): 071901
- Journal of Semiconductors
- Vol. 40, Issue 7, 071901 (2019)
![(Color online) (a) Solar radiation spectrum from UV to near-infrared light. (b) Photon attenuation in optical fiber as a function of wavelength. Wavelengths at 1300 and 1550 nm are called telecom O-band and C-band, respectively, which are commonly used in fiber-based applications. (a) Adapted with permission from Ref. [21]. (Springer Nature) (b) Adapted from Ref. [22].](/richHtml/jos/2019/40/7/071901/img_1.jpg)
Fig. 1. (Color online) (a) Solar radiation spectrum from UV to near-infrared light. (b) Photon attenuation in optical fiber as a function of wavelength. Wavelengths at 1300 and 1550 nm are called telecom O-band and C-band, respectively, which are commonly used in fiber-based applications. (a) Adapted with permission from Ref. [21 ]. (Springer Nature) (b) Adapted from Ref. [22 ].
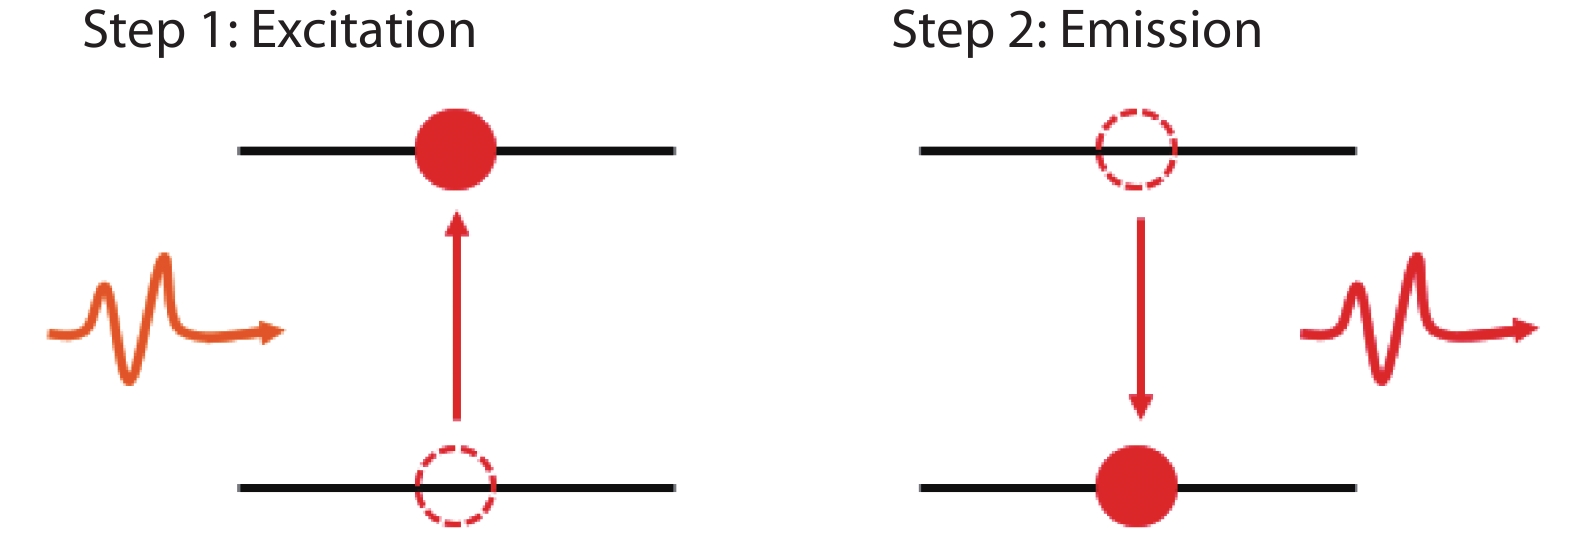
Fig. 2. (Color online) Scheme of single photon excitation and emission in a two-level system.
Fig. 3. (Color online) Scheme of Hanbury Brown and Twiss setup for autocorrelation measurement. The beam of light is sent to a beam splitter with single-photon detectors at the two outputs. An electronic correlator then determines the time delay between the two detector signals. Single photon emission results in the absence of simultaneous detection events on D1 and D2, in contrast to the case of multi-photon emission. Reprinted with permission from Ref. [24 ]. (Springer Nature)
Fig. 4. (Color online) Second order correlation function measured under two types of optical excitations. (a) Continuous wave excitation. (b) Pulsed excitation.
Fig. 5. (Color online) (a) Scheme of single photon emission from Rb atoms. Two pumping lasers are needed for Rb excitation (795 and 1324 nm), and two wavelength of single photons will be emitted (780 and 1367 nm). (b) The configuration of Rb energy levels. Reprinted with permission from Ref. [26 ]. (The Optical Society)
Fig. 6. (Color online) (a) Scheme of SPDC process and phase matching. (b) High purity of single photon emission. The dots are experiment data, the blue and red curves are theoretical fitting with and without considering detector noise. The inset is g (2)(0) = 0.001. Reprinted with permission from Ref. [27 ]. (The Optical Society)
Fig. 7. (Color online) (a) Scheme of experimental setup of ultra-fast heralded single photon source. (b) Selected signal photons (ITU 50) and idler photons (ITU 43) from the SPDC spectrum (black line). Reprinted with permission from Ref. [60 ]. (John Wiley & Sons)
Fig. 8. (Color online) Three types of QDs grown epitaxially on GaAs and InP substrate, respectively. Reprinted with permission from Refs. [77 , 81 , 84 ]. (AIP Publishing)
Fig. 9. (Color online) (a) Confocal map of four single photon emitters in 3C SiC epitaxy layer. (b) Room temperature photoluminescence spectra of three representative single photon emitters. (c) Second order autocorrelation measurement of the single photon emission. Reprinted with permission from Ref. [29 ]. (Springer Nature)
Fig. 10. (Color online) (a) Upper panel: Scheme of single wall carbon nanotube with oxygen-doping (Ether-d and Epoxide groups). Lower panel: Trap energy levels at doped areas. Oxygen-doping creates deep trap states below the E 11 state of the nanotube, leading the localization of excitons near the doping sites. (b) Photoluminescence wavelength distribution of undoped and doped nanotubes. Reprinted with permission from Ref. [106 ]. (Springer Nature)
Fig. 11. (Color online) Photoluminescence spectra of two types of aryl-functionalized carbon nanotubes with different chiralities ((a) (6,5), (b) (7,5), (c) (10,3)) and their corresponding second-order correlation function. Reprinted with permission from Ref. [30 ]. (Springer Nature)
Fig. 12. (Color online) Illustration of satellite based QKD among three ground stations (Xinglong, Nanshan and Graz). Reprinted with permission from Ref. [114 ]. (American Physical Society)
Fig. 13. (Color online) (a) Bird’s-eye view of experiment site in China. (b–d) Illustration of the entangled photon pair generation and distribution from Charlie, single photon state preparation and Bell state measurement from Alice and single photon state reconstruction from Bob. Reprinted with permission from Ref. [119 ]. (Springer Nature)
|
Table 1. Summary of six types of single photon sources emitting at telecom wavelength.

Set citation alerts for the article
Please enter your email address
© Copyright 2018-2021 | Chinese Laser Press. All Rights Reserved 沪ICP备15018463号-20