
H. Zandipour, M. Madani. Design, modelling, and simulation of a floating gate transistor with a novel security feature[J]. Journal of Semiconductors, 2020, 41(10): 102105
- Journal of Semiconductors
- Vol. 41, Issue 10, 102105 (2020)
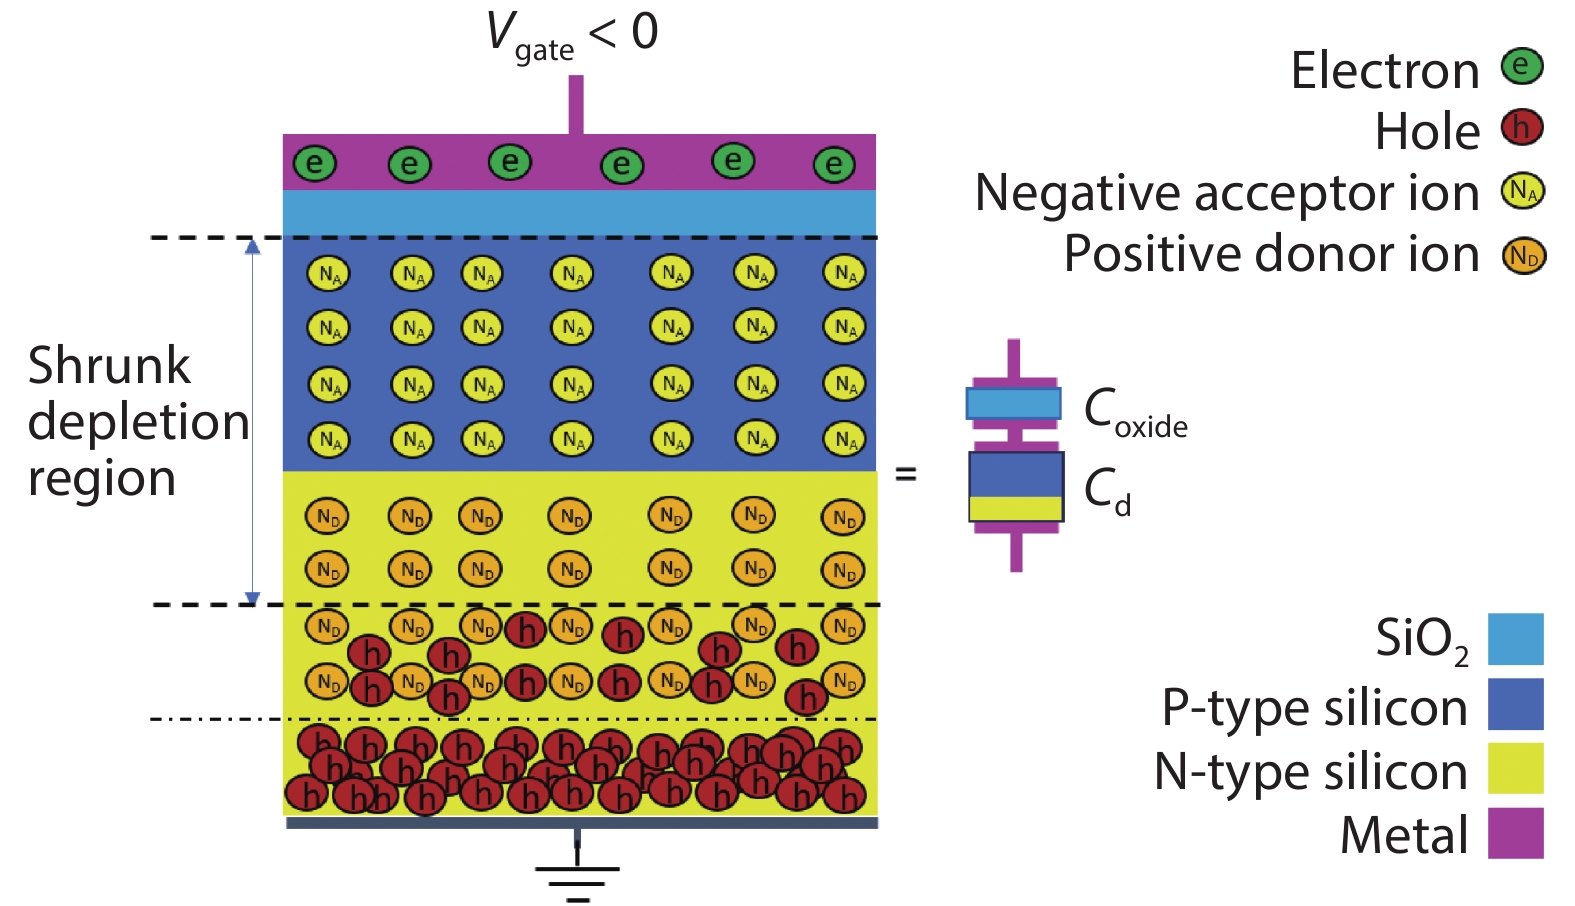
Fig. 1. (Color online) A MOPNS under the influence of small negative voltage applied to its gate.

Fig. 2. (Color online) The upward band bending in energy band diagram when a small negative voltage is applied to the gate of a MOPNS.
Fig. 3. (Color online) Graphical representation of charge density, electric field and electric potential of a MOPNS.
Fig. 4. (Color online) Donor concentration of a simulated MOPNS.
Fig. 5. (Color online) Comparison between the extracted model and simulation results (for HF and LF) of normalized C–V curves for the MOPNS.
Fig. 6. (Color online) Comparison of HF C–V curves of the FG MOPNS and FG MOS with P-type substrate.
Fig. 7. (Color online) Donor concentration of a MOPNS transistor.
Fig. 8. (Color online) Comparison of HF C–V curve of the FG MOPNS with three different dopant concentrations for the oppositely doped region (N-type) when the dopant concentration of the P-type region is constant.
Fig. 9. (Color online) Comparison between I–V characteristics of FG MOPNS and FG MOS (P-type).


Set citation alerts for the article
Please enter your email address

© Copyright 2018-2021 | Chinese Laser Press. All Rights Reserved 沪ICP备15018463号-20