
Yuanyuan Feng, Xianjun Gao, Yuanwei Yang, Fan Deng. Shadow Compensation of High-Resolution Remote Sensing Images Based on Improved Logarithmic Transformation and Local Enhancement[J]. Laser & Optoelectronics Progress, 2020, 57(20): 201006
- Laser & Optoelectronics Progress
- Vol. 57, Issue 20, 201006 (2020)
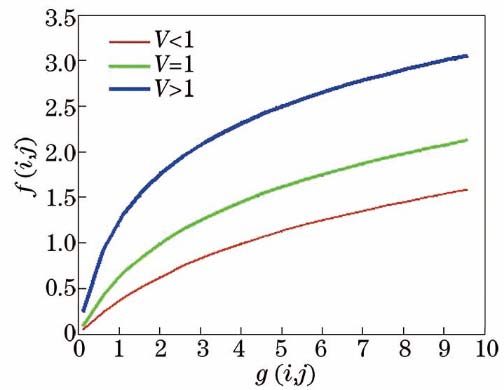
Fig. 1. Influence of parameter V on logarithmic transformation curve
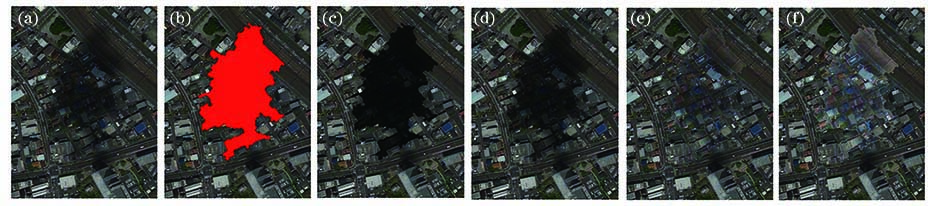
Fig. 2. Influence of parameter V on compensation result. (a) Original image; (b) shadow detection result; (c) compensation effect when V = 0.5; (d) compensation effect when V = 1; (e) compensation effect when V=2.5; (f) compensation effect when V=3
Fig. 3. Compensation results from three methods. (a) Original image; (b) logarithmic transformation result; (c) local compensation result; (d) joint compensation result
Fig. 4. Acquisition diagram of similarity pairs during automatic compensation
Fig. 5. Comparison among compensation results of urban image 1. (a) Original image; (b) selected area of detail comparison map; (c) compensation result by Wallis method; (d) local compensation effect; (e) compensation result by original logarithmic transformation; (f) compensation result by proposed method;(g) detail of compensation result by original logarithmic transformation; (h) detail of compensation result by proposed method
Fig. 6. Comparison among compensation results of urban image 2. (a) Original image; (b) selected area of detail comparison map; (c) compensation result by Wallis method; (d) local compensation effect;(e) compensation result by original logarithmic transformation; (f) compensation result by proposed method;(g) detail of compensation result by original logarithmic transformation; (h) detail of compensation result by proposed method
Fig. 7. Comparison among compensation results of urban image 3. (a) Original image; (b) selected area of detail comparison map; (c) compensation result by Wallis method; (d) local compensation effect;(e) compensation result by original logarithmic transformation; (f) compensation result by proposed method;(g) detail of compensation result by original logarithmic transformation; (h) detail of compensation result by proposed method
Fig. 8. Comparison among shadow compensation results of building image. (a) Original image; (b) compensation result by Wallis method; (c) local compensation result;(d) compensation result by original logarithmic transformation; (e) compensation result by the proposed method
|
Table 1. Experimental data of logarithmic transformation
|
Table 2. Image quality under each compensation method
|
Table 3. Evaluation of shadow compensation results
|
Table 4. Operation performance

Set citation alerts for the article
Please enter your email address
© Copyright 2018-2021 | Chinese Laser Press. All Rights Reserved 沪ICP备15018463号-20