
Yan An, Keyan Dong, Xiang Li, Lun Jiang, Liang Gao. Design of Laser Communication Optical System with Microlens Array Based on 3×3 Optical Matrix[J]. Acta Optica Sinica, 2020, 40(22): 2206003
- Acta Optica Sinica
- Vol. 40, Issue 22, 2206003 (2020)
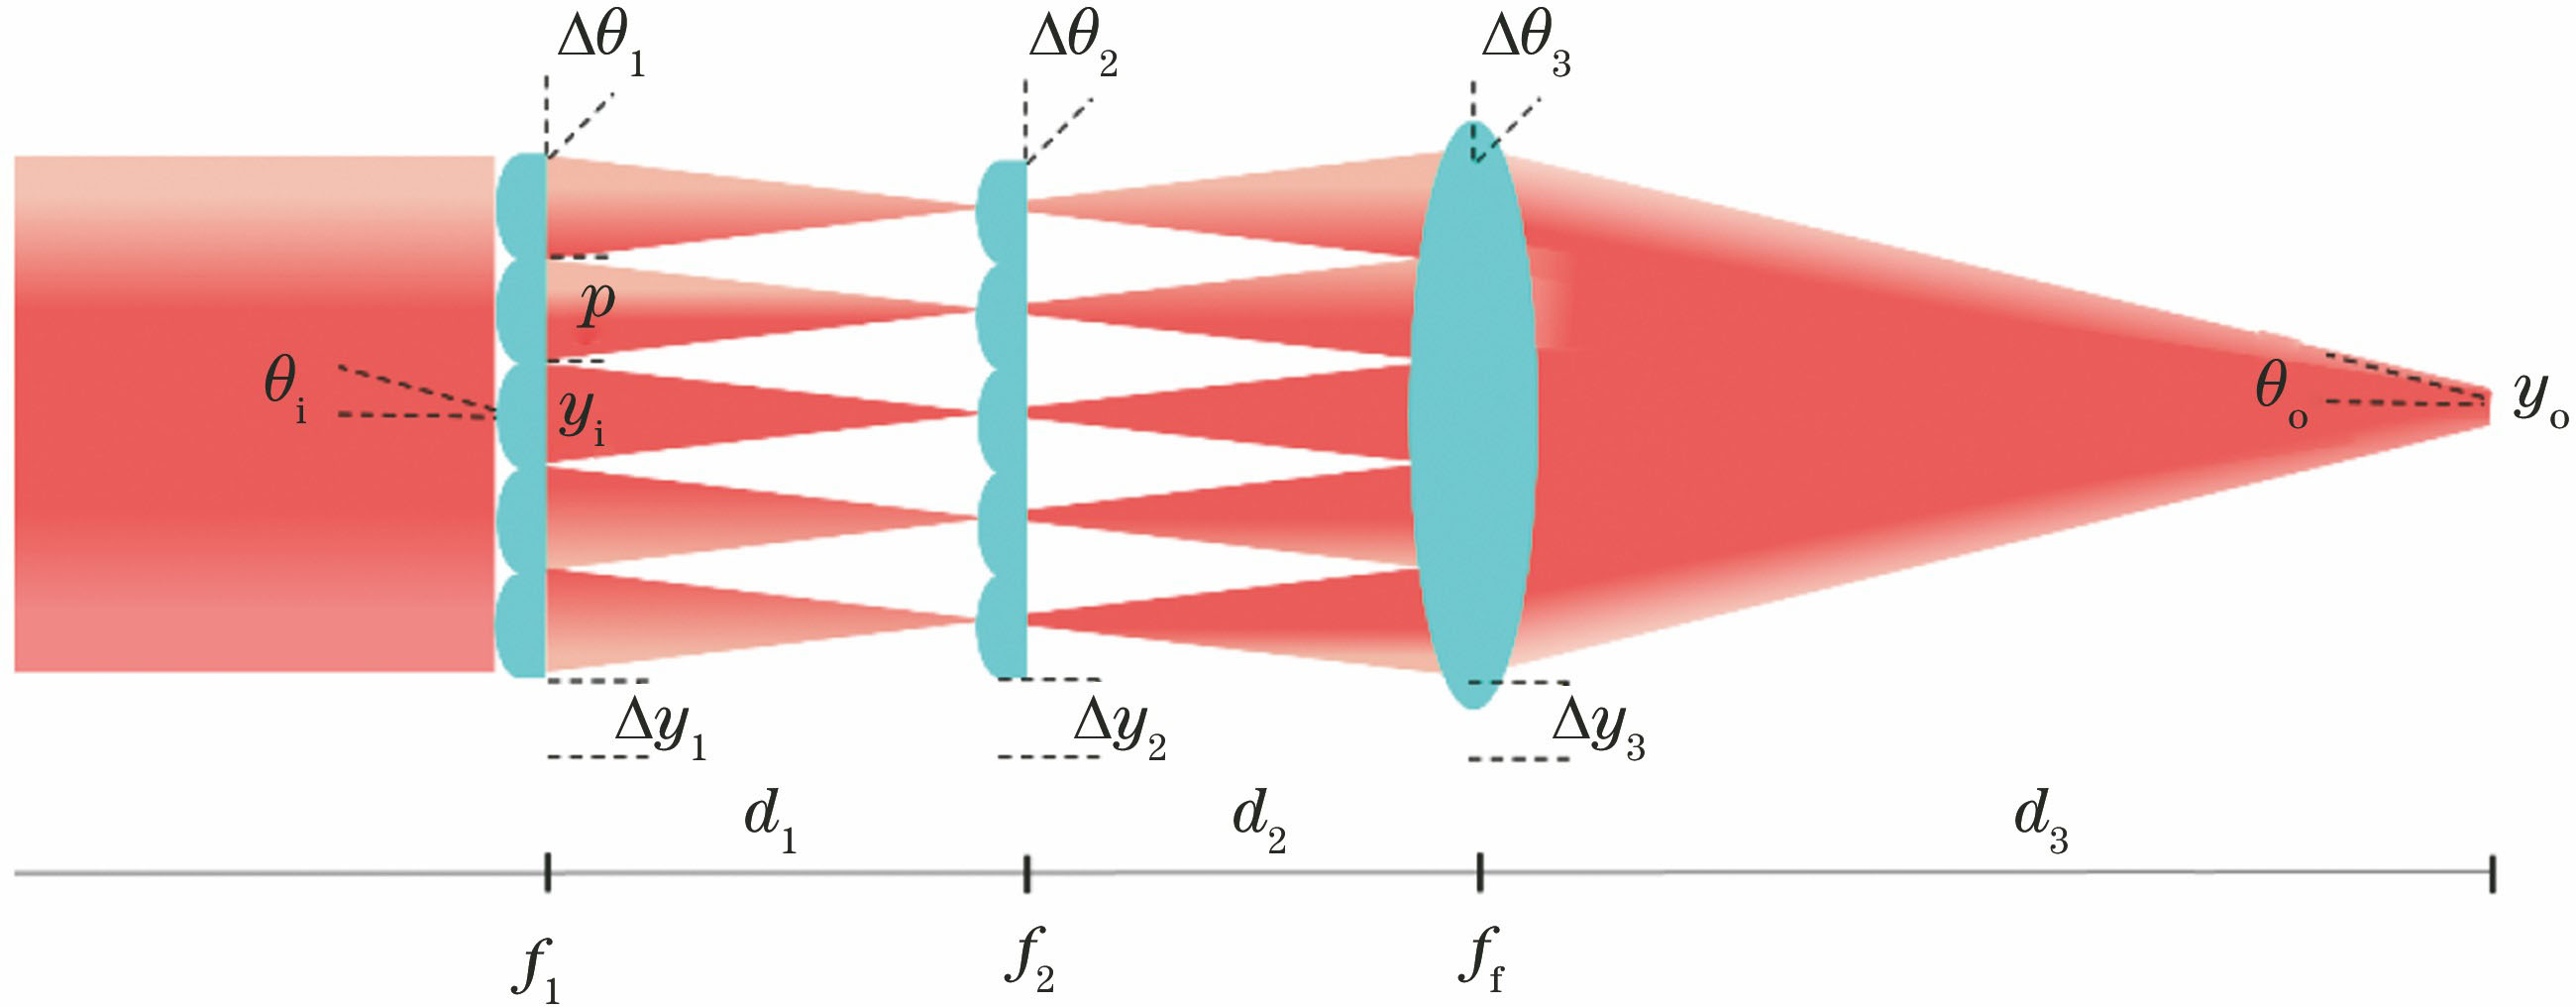
Fig. 1. Schematic diagram of homogenization of light by microlens array
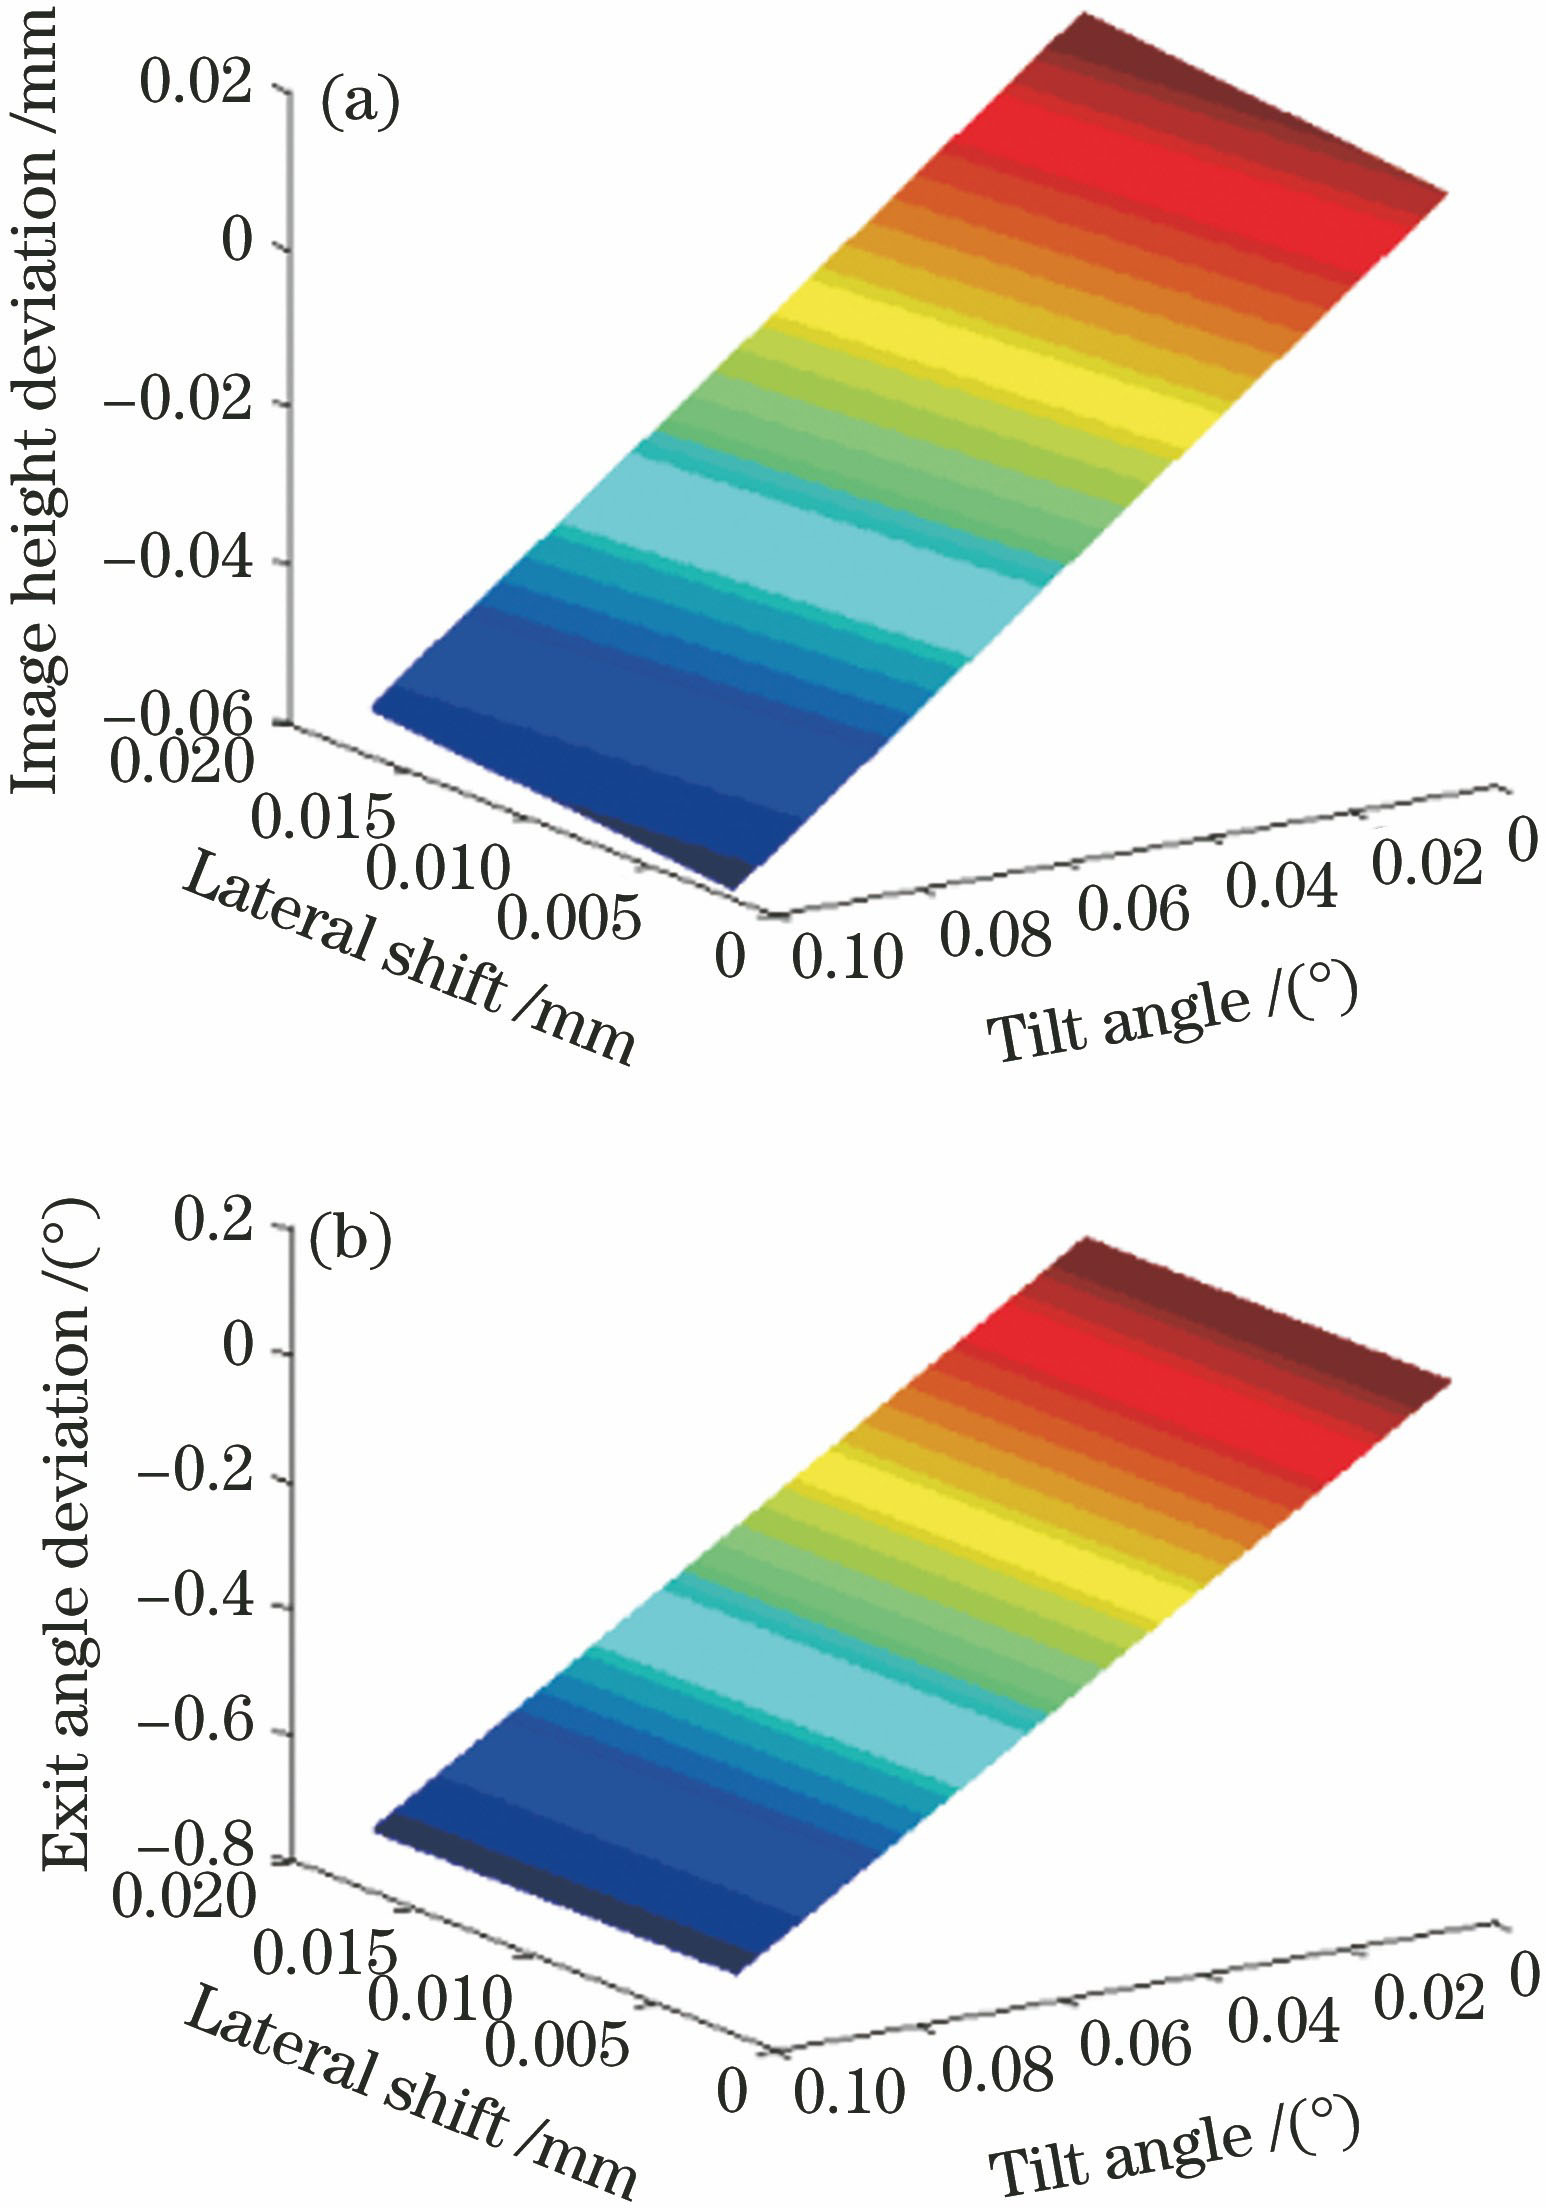
Fig. 2. Deviation values of image height and exit angle under different tilt angle and lateral shift. (a) Image height deviation; (b) exit angle deviation
Fig. 3. Optical path design of integration lens
Fig. 4. Figures of image quality evaluation for integration lens. (a) SPT; (b) distortion; (c) MTF; (d) geometric encircled energy
Fig. 5. Simulation diagram of microlens array optical system
Fig. 6. Simulation diagrams of energy distribution of image spot. (a) Energy distribution of receiving image;(b) intensity distribution in x direction; (c) intensity distribution in y direction
Fig. 7. Simulation diagrams of energy distribution of image spot with certain tilt angle and lateral shift. (a) Energy distribution in receiving image; (b) energy distribution in x direction; (c) energy distribution in y direction
Fig. 8. Principle block diagram of spot homogenization test
Fig. 9. Experimental diagram of beam homogenization test
Fig. 10. Measured energy distributions of image spot. (a) Picture of image spot; (b) energy distribution in x direction; (c) energy distribution in y direction
Fig. 11. Principle block diagram of field of view test
Fig. 12. Experimental diagram of field of view test
Fig. 13. Measured image spot under different field of view. (a) Picture of image spot under lower edge field of view; (b) picture of image spot under upper edge field of view
Fig. 14. Diagram of overlapping area between image spot and detector
|
Table 1. Initial structural parameters of optical system
|
Table 2. Link energy calculation data

Set citation alerts for the article
Please enter your email address
© Copyright 2018-2021 | Chinese Laser Press. All Rights Reserved 沪ICP备15018463号-20