• Advanced Photonics Nexus
  • Vol. 2, Issue 1, 016009 (2023)
Shuhao Shen1,2, E Du1,3, Miao Zhang1, Yuting Wen1..., Kai Long1, Anqi Qiu1,4 and Nanguang Chen1,4,*|Show fewer author(s)
Author Affiliations
  • 1National University of Singapore, Department of Biomedical Engineering, Singapore
  • 2Xidian University, Guangzhou Institute of Technology, Guangzhou, China
  • 3Shenzhen Institute of Information Technology, School of Microelectronics, Shenzhen, China
  • 4National University of Singapore (Suzhou) Research Institute, Suzhou, China
  • show less
    DOI: 10.1117/1.APN.2.1.016009 Cite this Article Set citation alerts
    Shuhao Shen, E Du, Miao Zhang, Yuting Wen, Kai Long, Anqi Qiu, Nanguang Chen, "Confocal rescan structured illumination microscopy for real-time deep tissue imaging with superresolution," Adv. Photon. Nexus 2, 016009 (2023) Copy Citation Text show less
    Confocal rescan SIM. (a) Optical system layout. DB, dichroic beam splitter; HWP, half-wave plate; EOM, electro-optic modulator; WP, Wollaston prism; LCR, liquid crystal retarder; CL, cylindrical lens (focal length:−25 mm); DM, dichroic mirror; EM, fluorescence emission filter; GM, galvo mirror; M1 and M2, mirrors; SL, scan lens (focal length: 40 mm); TL, tube lens (focal length: 200 mm); OBJ, objective lens; L1–L8 are spherical lens with focal lengths of 50, 150, 50, 100, 40, 75, 75, and 200 mm, respectively. Inset, (left) scanning illumination line inside the area of illumination and (right) diagram representations of illumination patterns of three phases. (b) CR-SIM image reconstruction process. I0 deg, I120 deg, and I240 deg, raw images acquired for three structured illumination pattern phases and a rescan ratio of 2; FT, two-dimensional FT; M−1: an inverse matrix used to retrieve the baseband (S0) and modulation-shifted (S+p and S−p) components in the image; Id, image demodulated from the three raw phase images using an optical sectioning SIM algorithm; HP0 and LP0, high-pass and low-pass filters with the same cutoff frequency of P0; for conventional SR-SIM reconstruction, S0, S+p, and S−p are shifted to their correct positions, merged using generalized Wiener filters, and transformed into the spatial domain to obtain the SR-SIM image. For the proposed OS-SR-SIM reconstruction, the operation remains the same except that the baseband S0 is corrected by merging S0 with the spectrum of Id using Eq. (3). Finally, the CR-SIM image is obtained by rescan inversion with a factor of 2.
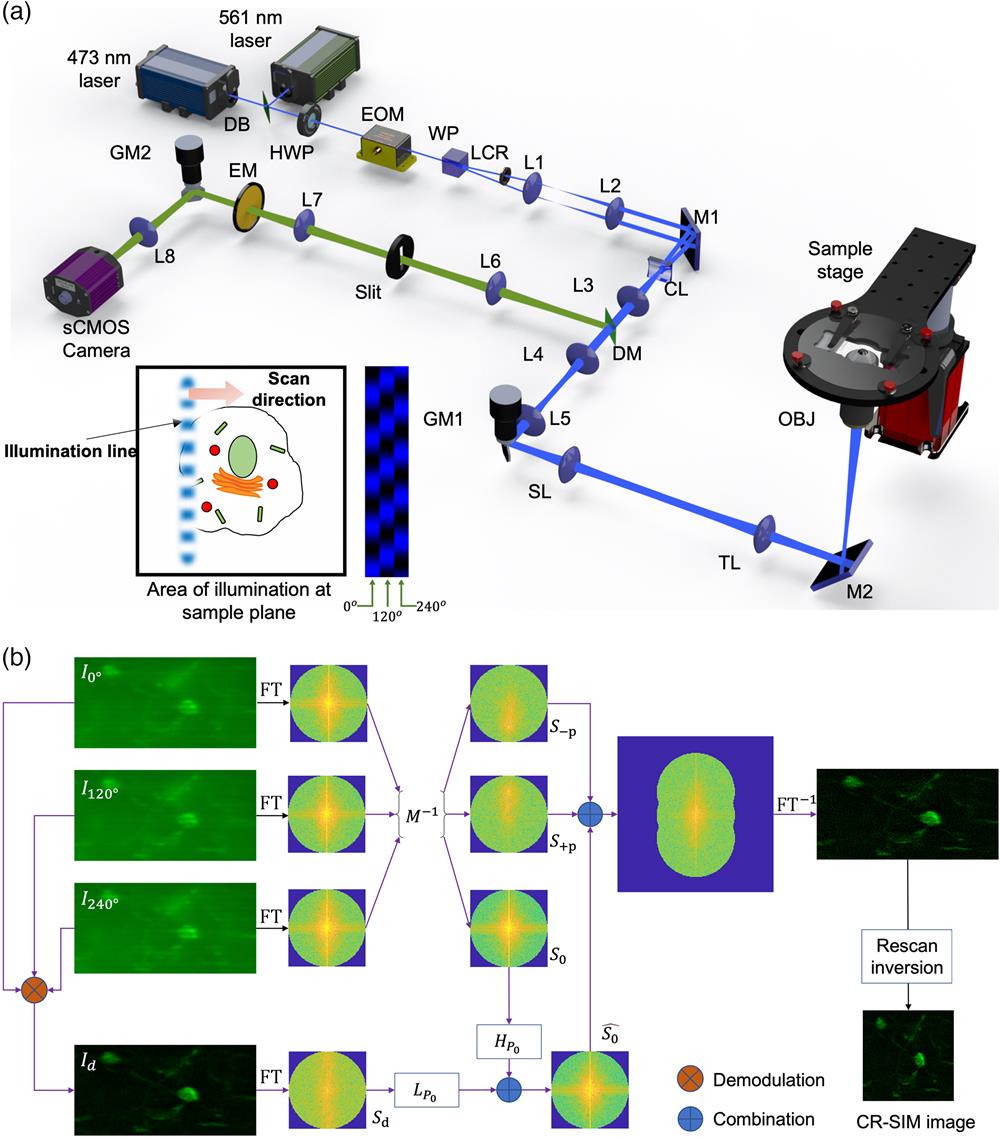
    Fig. 1. Confocal rescan SIM. (a) Optical system layout. DB, dichroic beam splitter; HWP, half-wave plate; EOM, electro-optic modulator; WP, Wollaston prism; LCR, liquid crystal retarder; CL, cylindrical lens (focal length:25  mm); DM, dichroic mirror; EM, fluorescence emission filter; GM, galvo mirror; M1 and M2, mirrors; SL, scan lens (focal length: 40 mm); TL, tube lens (focal length: 200 mm); OBJ, objective lens; L1–L8 are spherical lens with focal lengths of 50, 150, 50, 100, 40, 75, 75, and 200 mm, respectively. Inset, (left) scanning illumination line inside the area of illumination and (right) diagram representations of illumination patterns of three phases. (b) CR-SIM image reconstruction process. I0  deg, I120  deg, and I240  deg, raw images acquired for three structured illumination pattern phases and a rescan ratio of 2; FT, two-dimensional FT; M1: an inverse matrix used to retrieve the baseband (S0) and modulation-shifted (S+p and Sp) components in the image; Id, image demodulated from the three raw phase images using an optical sectioning SIM algorithm; HP0 and LP0, high-pass and low-pass filters with the same cutoff frequency of P0; for conventional SR-SIM reconstruction, S0, S+p, and Sp are shifted to their correct positions, merged using generalized Wiener filters, and transformed into the spatial domain to obtain the SR-SIM image. For the proposed OS-SR-SIM reconstruction, the operation remains the same except that the baseband S0 is corrected by merging S0 with the spectrum of Id using Eq. (3). Finally, the CR-SIM image is obtained by rescan inversion with a factor of 2.
    Fluorescent imaging of thick-tissue phantom made of 2-μm fluorescence beads. (a) Cross-sectional images acquired by WF-SIM, LSCM, and CR-SIM at the depths of 0, 250, and 500 μm, respectively; Scale bar: 10 μm. The plot of the (b) SBR and (c) SNR values of the fluorescent beads imaged by WF-SIM, LSCM, and CR-SIM at different depths from surface to 500 μm.
    Fig. 2. Fluorescent imaging of thick-tissue phantom made of 2-μm fluorescence beads. (a) Cross-sectional images acquired by WF-SIM, LSCM, and CR-SIM at the depths of 0, 250, and 500  μm, respectively; Scale bar: 10  μm. The plot of the (b) SBR and (c) SNR values of the fluorescent beads imaged by WF-SIM, LSCM, and CR-SIM at different depths from surface to 500  μm.
    High-resolution imaging of fixed HeLa cells: (a) LSCM image of F-actin structures in a single HeLa cell using a 60×/1.2 NA OBJ lens; (b) CR-SIM image of the same sample area; (c) comparison of the normalized intensity profiles along the yellow solid lines in (a) and (b); (d) magnified LDCM image in the region of interest (ROI) marked by the blue box in (a); (e) magnified CR-SIM image in the ROI marked by the yellow box in (b).
    Fig. 3. High-resolution imaging of fixed HeLa cells: (a) LSCM image of F-actin structures in a single HeLa cell using a 60×/1.2NA OBJ lens; (b) CR-SIM image of the same sample area; (c) comparison of the normalized intensity profiles along the yellow solid lines in (a) and (b); (d) magnified LDCM image in the region of interest (ROI) marked by the blue box in (a); (e) magnified CR-SIM image in the ROI marked by the yellow box in (b).
    CR-SIM imaging of Thy1-EGFP transgenic mouse brain slice. (a) Volumetric rendering of a CR-SIM image stack 138 μm in thickness; (b) side-by-side comparison between (left) LSCM and (right) CR-SIM images at Z=23 μm; (c) zoom-in view of the region enclosed in the blue square box in (b) with a side length of 2.4 μm; (d) intensity profiles along the horizontal (blue) and vertical (green) solid lines in (c); (e) 3D rendering view of a partial volumetric scan of the tissue stack with detailed neural structural information of axons, dendrites, and spines; (f)–(h) example image slices at imaging depths of 113, 132, and 197 μm, respectively. They are taken from another 3D stack comprising 209 layers. Scale bar, 5 μm; (i)–(k) selected areas [enclosed in green/yellow/blue dashed boxes in (f)–(h)] magnified by a factor of 4.
    Fig. 4. CR-SIM imaging of Thy1-EGFP transgenic mouse brain slice. (a) Volumetric rendering of a CR-SIM image stack 138  μm in thickness; (b) side-by-side comparison between (left) LSCM and (right) CR-SIM images at Z=23  μm; (c) zoom-in view of the region enclosed in the blue square box in (b) with a side length of 2.4  μm; (d) intensity profiles along the horizontal (blue) and vertical (green) solid lines in (c); (e) 3D rendering view of a partial volumetric scan of the tissue stack with detailed neural structural information of axons, dendrites, and spines; (f)–(h) example image slices at imaging depths of 113, 132, and 197  μm, respectively. They are taken from another 3D stack comprising 209 layers. Scale bar, 5  μm; (i)–(k) selected areas [enclosed in green/yellow/blue dashed boxes in (f)–(h)] magnified by a factor of 4.
    Shuhao Shen, E Du, Miao Zhang, Yuting Wen, Kai Long, Anqi Qiu, Nanguang Chen, "Confocal rescan structured illumination microscopy for real-time deep tissue imaging with superresolution," Adv. Photon. Nexus 2, 016009 (2023)
    Download Citation