
Shuhao Shen, E Du, Miao Zhang, Yuting Wen, Kai Long, Anqi Qiu, Nanguang Chen. Confocal rescan structured illumination microscopy for real-time deep tissue imaging with superresolution[J]. Advanced Photonics Nexus, 2023, 2(1): 016009
- Advanced Photonics Nexus
- Vol. 2, Issue 1, 016009 (2023)
Abstract
1 Introduction
For the past few decades, fluorescence microscopy has been commonly used for the observation of morphological features as well as biological processes in cells and tissues as a consequence of its molecular specificity, high sensitivity, and subcellular resolution. Fluorescence microscopes fall into two general categories: wide-field fluorescence microscopes and laser scanning microscopes. Wide-field fluorescence microscopy typically uses a constant and homogeneous illumination pattern and instantaneously acquires images with a two-dimensional image sensor. It is a popular tool in biological research owing to its simple implementation and high imaging speed.1 However, the wide-field technique is usually confined to image thin samples such as cultured cells or thinly sliced tissue. This is because when imaging thick samples, the illumination light excites the fluorescence photons from both in-focus and out-of-focus areas of the sample. These photons all arrive at the image sensor, and therefore, the in-focus information is blurred by the out-of-focus background.2 In other words, standard wide-field fluorescence microscopy does not have the optical sectioning ability and is not the method of choice when imaging complex three-dimensional (3D) biological samples. Laser scanning microscopy is a modern imaging technique for thick tissue imaging.3 It features the use of a condensed illumination pattern, which is scanned across the field of view for sequential signal acquisition and consequential image formation. In the case of one-photon excitation, a spatial filter is placed in a location conjugate to the illumination pattern to reject unwanted background photons. The spatial filter could be a pinhole in a point-scan confocal microscope3 or a slit in a line-scan confocal microscope (LSCM).4 Point-scan confocal microscopy provides an effective mechanism to strongly suppress the out-of-focus light from specimens, which results in decent optical sectioning. The background can be further reduced by spatiotemporally modulating the excitation beam, leading to a penetration depth of up to in strong scattering biological tissue.5 Nonetheless, the point-to-point scanning process is time-consuming and typically limits the imaging speed to a few hertz. It is also associated with more severe photobleaching and photodamage to biological samples.6 In an LSCM, the excitation beam is condensed in one dimension to form an illumination line, which only needs to be scanned along the orthogonal direction. This configuration makes it possible to achieve an imaging speed of over 100 frames per second. On the other hand, there are more background photons leaking through the confocal slit in comparison with a pinhole. The resultant optical sectioning capability and contrast become less desirable. Recently, line-scan focal modulation microscopes7 have been developed to overcome this shortcoming.
Many variants of wide-field fluorescence microscopy have been reported in the last two decades, including structured illumination microscopy (SIM)8 and selected plane illumination microscopy (SPIM).9 Both SIM and SPIM can provide optical sectioning in relatively thin and/or transparent samples while enjoying the usual benefits of wide-field microscopy, such as high speed and low photobleaching. Among them, SIM is relatively easier to implement and is less demanding in terms of sample preparation and handling.
SIM was first proposed by Neil et al.8 in a wide-field microscope, where a known high-frequency structured pattern of light is projected on the sample for excitation. Since the high spatial frequency pattern attenuates rapidly with increasing defocus, only the sample structure in the focal plane is subject to the strongest modulation. As a result, unstructured background fluorescent emission signals can be differentiated from the targeted signals by computational image processing. In general, three raw images are acquired sequentially when the illumination pattern is phase-shifted with a step size of 120 deg. An optically sectioned image is then created with a demodulation algorithm that finds the local modulation amplitudes. Recently, the development of optical sectioning SIM (OS-SIM) reduced the number of raw images required for reconstruction. Hybrid illumination microscopy10 requires only two images of the sample under uniform and structured illumination. The structured illumination pattern can be either a grid pattern11 or a speckle pattern.12 Another OS-SIM reconstruction method also used only two raw patterned images with different phases and sequence Hilbert transform.13
Sign up for Advanced Photonics Nexus TOC. Get the latest issue of Advanced Photonics Nexus delivered right to you!Sign up now
SIM has become increasingly popular, since its superresolution capability was demonstrated by Gustafsson et al.14 In addition to phase stepping, the raw image acquisition process is repeated for at least three angular orientations of the structured illumination pattern to provide nearly isotropic high-frequency expansion. A superresolution SIM (SR-SIM) reconstruction algorithm is needed to reconstruct the original object spectrum from its frequency-shifted (due to spatial modulation) versions in the captured raw images. Consequently, the lateral resolution limit can be enhanced by a factor of up to 2 in comparison with normal wide-field microscopes.
Although existing SIM techniques have found a wide range of applications, they are primarily used to visualize thin biological samples. When imaging deep into biological tissue, however, the overwhelming background photons arriving at the image sensor pose a serious challenge for proper image reconstruction. The unattenuated background photons could saturate the image sensor, resulting in an elevated noise level, and magnify the artifacts in the reconstructed images due to model inaccuracy. As a result, the image quality degrades rapidly with increasing imaging depth.15
In this paper, we present a confocal rescan structured illumination microscope (CR-SIM) to address the limitation of existing SR-SIM techniques in terms of background rejection, noise suppression, and imaging speed. An image rescan technique16 originally developed for a point-scan system is adapted to the line-scan configuration and combined with SIM to obtain superresolution in two orthogonal directions. Compared with conventional SIM implementations, there is no need to rotate the modulated illumination pattern for multiple angular orientations, and therefore, the image acquisition speed can be improved by at least threefold. Our implementation includes a confocal slit that is standard in an LSCM. The slit prevents a significant number of background photons from arriving at the image sensor. This helps suppress the noise in the reconstructed images, as the shot noise and the laser intensity noise can be substantially reduced. Such an advantage would be unavailable with a computational, model-based approach toward background removal.17 A revised SIM reconstruction algorithm is then employed to further eliminate the residual background leaking through the slit, leading to a signal-to-background ratio much superior to both LSCM and wide-field (WF)-SIM.
2 Methods and Materials
2.1 Optical Setup
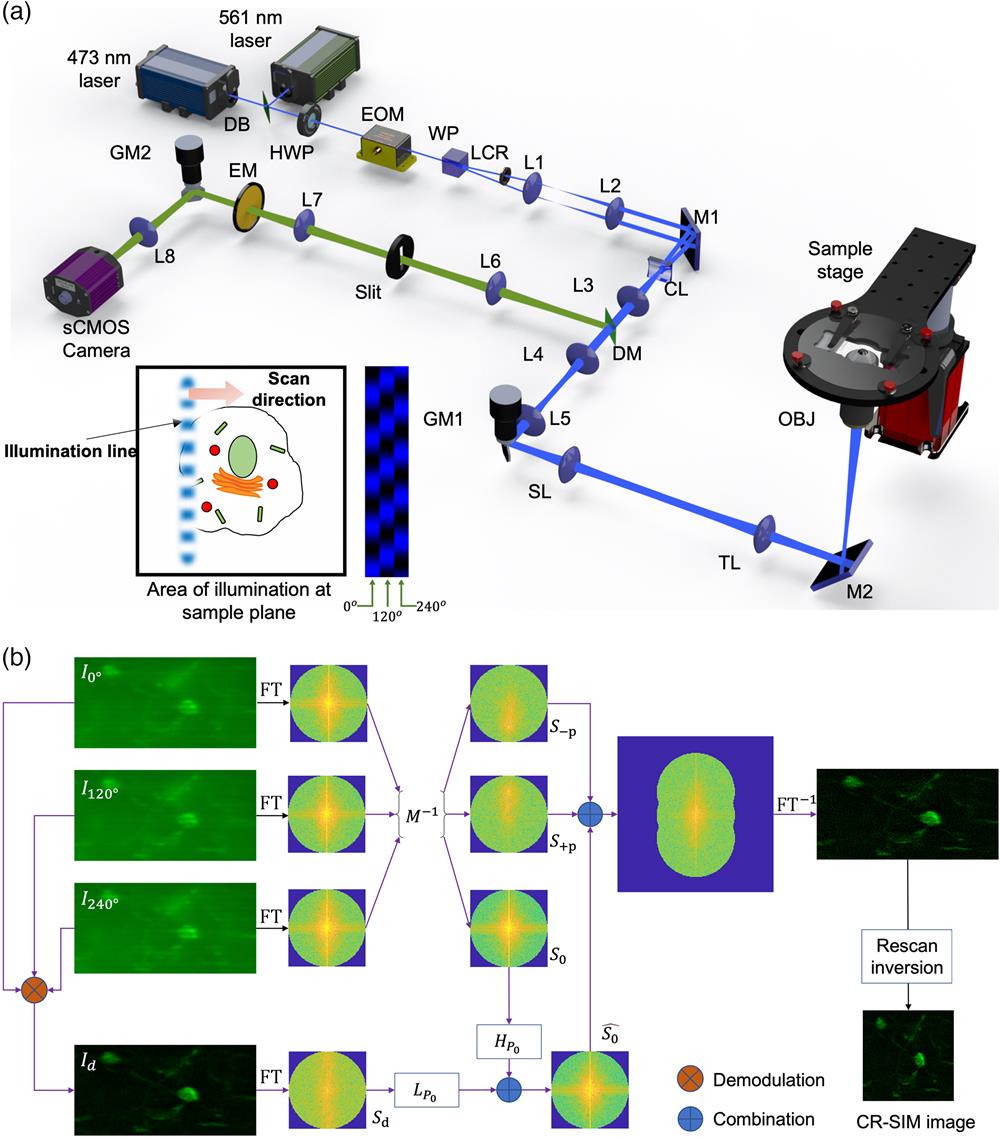
The optical design of the CR-SIM system is illustrated in Fig. 1(a). Similar to an LSCM, the CR-SIM system forms a line focus to illuminate the sample and scan the illumination line along the orthogonal direction to cover a two-dimensional field of view. To achieve structured illumination, the excitation light is split into two half-beams, which are angularly separated with a Wollaston prism (WP), condensed with the same cylindrical lens (CL), and brought to the focal plane by the objective (OBJ), intersecting with each other at a large angle. The interference between the half-beams creates an intensity-modulated line [see the inset cartoon in Fig. 1(a)]. The spatial frequency of the modulation pattern is typically set to greater than half of the cutoff frequency of the OBJ, while the phase of the pattern can be rapidly shifted with an electro-optic modulator (EOM), which introduces a variable optical phase delay depending on the voltage applied to the radio frequency (RF) input. A one-dimensional image rescan is implemented with two synchronized galvo mirrors (GMs) and a scientific complementary metal oxide semiconductor (CMOS) camera. The excitation GM1 is responsible for shifting the vertical excitation line in the horizontal direction and descanning the fluorescence emission from the sample, whereas the rescan GM2 maps the emission photons on the two-dimensional image sensor. In a conventional line-scan microscope, the angular velocities of these two GMs are kept identical.7 In the CR-SIM setup, however, GM2 is operated to have its angular velocity increased by a so-called rescan ratio in comparison with GM1. The optimal resolution enhancement can be reached when we choose (see Note S1 in the Supplementary Material for detailed theoretical treatment of one-dimensional image rescan with a slit). A confocal slit is included in the detection light path, functioning as a spatial filter that rejects out-of-focus fluorescence emissions. This is an essential feature for improved background rejection and noise suppression, which are desirable for thick tissue imaging.
![]()
Figure 1.Confocal rescan SIM. (a) Optical system layout. DB, dichroic beam splitter; HWP, half-wave plate; EOM, electro-optic modulator; WP, Wollaston prism; LCR, liquid crystal retarder; CL, cylindrical lens (focal length:
As shown in Fig. 1(b), the image processing process starts with three raw images captured by the camera for three illumination pattern phases, i.e., 0 deg, 120 deg, and 240 deg. They are all stretched in the horizontal direction due to the rescan ratio of . The two-dimensional Fourier transform (FT) of these raw images results in three raw spectra, from which the baseband spectrum (), and two frequency-shifted spectra ( and ) can be retrieved by the use of the inverse of the modulation matrix (). In a standard SR-SIM reconstruction process, and are shifted to their original frequency centers and recombined with to generate a reconstructed spectrum expanded beyond the diffraction-limited range. In our approach, however, there is an additional step to remove the background in . An OS-SIM demodulation method is employed to generate a standard-resolution image , in which the out-of-focus emission and the system bias (such as camera dark current) are substantially suppressed. The low-frequency part of its spectrum replaces the corresponding region in to produce a corrected, background-free baseband spectrum , which is then combined with and to create a synthesized spectrum with its frequency range extended in the vertical direction. In the final steps of image processing, the synthesized spectrum is inverse Fourier transformed (), and then the resultant image is resized to have its horizontal dimension reduced by half. The resizing step is simply the inversion procedure to correct the distorted aspect ratio due to image rescan with a nonunity rescan ratio. Essentially, it leads to frequency doubling and superresolution in the horizontal direction.
2.2 Principle of CR-SIM Image Reconstruction
For each set of three-phase raw images, image processing procedures are followed to reconstruct one superresolution image. In the first step of image processing, an SR-SIM reconstruction algorithm is needed to properly separate the frequency components shifted by spatial modulation and recombine them in an appropriate way. This step leads to an enhanced resolution in the modulation direction (parallel to the slit). The conventional SR-SIM reconstruction algorithm18 has been well established for thin samples. Its mathematical model, however, does not take into account any background offset, which is far from negligible in thick tissue imaging. Therefore, we have modified the conventional algorithm for enhanced background rejection and optical sectioning.
In a conventional SR-SIM reconstruction framework, the spatial spectra of the raw images , , and are linked to the sample spectrum by
In thick tissue imaging, the background fluorescence emission from out-of-focus regions is not adequately modeled by the OTF alone. After reconstruction with the above standard algorithm, the background will distort the spectral estimates, especially the baseband spectrum estimate . As a result, the effective resolution and image quality may deteriorate appreciably. On the other hand, there have been standard SIM reconstruction algorithms established for optical sectioning, but no superresolution.
We have developed an OS-SR-SIM algorithm that combines both methods. It is based on the following hypothesis: the background is dominated by low-frequency components, and it is independent of the modulation phase. It is therefore assumed that the estimated spectra and with Eq. (1) are not significantly biased by the background, which instead concentrates on the center portion of . In our approach, a low cutoff frequency is empirically chosen to define a circular frequency range, in which the spectrum needs to be corrected. One of the standard demodulation methods for OS-SIM can be used to retrieve the background-free low-frequency content from its frequency-shifted spectra. For example, a demodulated image can be obtained by
In this demodulated image, the background is essentially canceled by the subtraction operations. The corrected version of is now given by
Eventually, the estimated spectra , , and are recombined in the same way as in the standard algorithm to create a reconstructed SIM image with superresolution along the modulation direction and suppressed background.
The rescan ratio is set to 2 for superresolution image acquisition. Consequently, the raw images are stretched by a factor of 2 in the scanning direction (orthogonal to the slit). The next step in image processing is a rescan inversion process, in which the reconstructed SIM images are resized (shrinking by a factor of 2) in the scanning direction to restore the original aspect ratio. This process leads to a CR-SIM image with superresolution in both lateral directions.
3 Results
3.1 Quantitative Validation of CR-SIM
One of the main technical advantages of CR-SIM is its imaging speed. Conventional SR-SIM systems need to acquire at least nine raw images and involve the rotation of the illumination pattern. In contrast, CR-SIM only requires three raw images to reconstruct one superresolution image. A significantly improved imaging speed is achieved without compromising the image quality. The resolution enhancement offered by CR-SIM has been verified and characterized with 100 nm yellow-green fluorescent beads and using a OBJ lens. The CR-SIM image resolutions were measured at 175 and 179 nm in the horizontal and vertical directions, respectively, which were 1.47 to 1.51 times better than the diffraction limit. After Richardson–Lucy deconvolution, the resolution improvement could reach 1.93 to 1.99 times (see Note S2 in the Supplementary Material for details).
Another essential technical improvement of CR-SIM is its strong optical sectioning capability, which is desirable for deep-tissue imaging. The fixed orientation of the illumination pattern makes it possible to include a slit to block a substantial amount of background emissions. This physical spatial filter, coupled with additional background rejection afforded by the CR-SIM reconstruction algorithm, leads to an outstanding signal-to-background ratio (SBR) and signal-to-noise ratio (SNR). A thick-tissue phantom made of fluorescence beads in 2% lipid emulsion was used for quantifying these two specifications. The phantom was scanned three-dimensionally with CR-SIM, LSCM, and WF-SIM from the surface down to in depth at an increment of , using a NA(XLUMPLFLN, Olympus) OBJ lens. To simplify the comparison, the WF-SIM images were acquired using the same CR-SIM imaging platform but with the slit wide open. For a fair comparison, the exposure time for each raw image of WF-SIM/CR-SIM was set to 100 ms, whereas the exposure time for LSCM image was set to 300 ms. Image acquisition time of the whole volumetric stack was 200 s. Example images at the depths of 0, 250, and are provided in Fig. 2(a), whereas the SBR and SNR are plotted as functions of depth in Figs. 2(b) and 2(c), respectively. The imaging data presented in Fig. 2 suggested that WF-SIM, obtained with a reconstruction algorithm enabling optical sectioning, were able to remove a similar amount of low-frequency background as LSCM did, and both provided closely matched SBR. However, the computational approach failed to suppress the random noises associated with the background, which could be more effectively eliminated by a physical slit. At the depth of , microbeads could hardly be differentiated from the noisy background in the WF-SIM image. On the other hand, they are still visible in the LSCM image, even though the contrast was rather low and the effective resolution was very poor. As the CR-SIM technique combined two background rejection mechanisms together, the SBR was further improved by roughly 20 dB over the entire depth range. It was striking that the SBR for CR-SIM at the depth beyond could match those of WF-SIM and LSCM at the surface. In addition, CR-SIM also inherited the strong noise reduction afforded by the slit integrated into the system. Although its SNR was slightly lower than that of LSCM due to the modulation and demodulation losses, it was approximately enhanced by 8.9 to 19.6 dB over WF-SIM. The 3D volumetric rendering visualization of the entire beads phantom stack is provided and compared in Fig. S4 in the Supplementary Material.
![]()
Figure 2.Fluorescent imaging of thick-tissue phantom made of
3.2 Cellular Sample Imaging
The performance of our technique in biological sample imaging was first validated using fixed HeLa cells, whose F-actin was stained with Texas Red™-X Phalloidin (emission peak at 608 nm). The laser (561 nm) power arriving at the sample surface was , and a NA OBJ was used. It took 300 ms to acquire three raw images. The CR-SIM [Fig. 3(a)] and LSCM [Fig. 3(b)] images of the same F-actin structures are compared in Fig. 3. Magnified images within the corresponding regions of interest (ROI) marked by a blue or yellow box in Figs. 3(a) and 3(b) are shown in Figs. 3(d) and 3(e). The LSCM image was formed by simply finding the average of three raw images. It included a background component due to the camera’s dark current. Although such a homogeneous background could be numerically removed in postprocessing, a certain amount of heterogeneous background manifested itself in the LSCM image, even though the sample was very thin. They should have been caused by the residual out-of-focus light leaking through the slit. The CR-SIM image, on the other hand, was largely free from background contamination. Furthermore, the resolution is isotropically enhanced in comparison with the LSCM image. For a more quantitative assessment of image quality improvement, line profiles were obtained along the yellow lines and plotted in Fig. 3(c). The LSCM intensity was substantially above zero in the supposedly dark regions. The smallest distance between peaks that could be barely identified in the LSCM profile was 317 nm, which closely matched the diffraction-limited resolution of 309 nm. The CR-SIM profile, in contrast, proved that CR-SIM automatically and efficiently removed all types of background signals. F-actin fibers with a separation of could be readily separated, suggesting a resolution enhancement of more than 1.55 times.
![]()
Figure 3.High-resolution imaging of fixed HeLa cells: (a) LSCM image of F-actin structures in a single HeLa cell using a
3.3 Ex Vivo Imaging of GFP Mouse Brain Thick Sections
We eventually carried out superresolution fluorescence imaging experiments with thick Thy1-EGFP transgenic mouse brain sections, in which neurons were labeled with EGFP. The 473-nm laser and a (UPlanFLN, Olympus) OBJ lens were used to acquire CR-SIM images. The fluorescence emission passed through a bandpass filter centered at 520 nm, and the corresponding diffraction-limited resolution was 244 nm. An image stack [volumetric rendering shown in Fig. 4(a)] was captured from an imaging region of (width × height × depth). The depth range was scanned at an increment of , resulting in 138 en face image slices. The exposure time for acquiring one raw image was 100 ms, and in total it took 45 s to complete the 3D volumetric scanning process. A neuron soma, axon segments, and numerous dendrites/dendrite spines were clearly visible with high definition throughout the entire depth range. The fluorescence-labeled structures were densely packed in the space, which would lead to an overwhelming background in WF-SIM images. A combo image (LSCM versus CR-SIM) of the neuron soma at was formed [Fig. 4(b)] to provide a side-by-side image quality comparison. The background emissions from the sample were so strong that a noticeable number of photons leaked through the slit and compromised the contrast and effective resolution in the LSCM image. On the other hand, CR-SIM provided much richer and more detailed morphological information. Figure 4(c) shows a zoom-in view of a region near the soma center [enclosed in the blue box in Fig. 4(b)], which has an overall size of . In the example intensity profiles [Fig. 4(d)] along the horizontal and vertical lines (blue and green lines in Fig. 4(c), respectively), one can readily identify many peaks separated by a distance of , corresponding to an enhancement of more than 1.5 times beyond the diffraction limit.
![]()
Figure 4.CR-SIM imaging of Thy1-EGFP transgenic mouse brain slice. (a) Volumetric rendering of a CR-SIM image stack
In a separate imaging experiment with a different tissue section, we acquired another image stack in thickness (see Video 1 for volumetric rendering). Figure 4(e) demonstrates a partial volumetric scan of the tissue stack with detailed neuronal structures. The connection of axons, dendrites, and spines can be clearly visualized in the 3D rendering view. Figures 4(f)–4(h) show representative images at , , and , respectively. To better illustrate finer structures in these images, some small areas are selected (indicated by the colored dashed boxes) and magnified [Figs. 4(i)–4(k)] by 4 times. Relatively thin dendrites with small apparent diameters but a strong SNR were chosen for size estimation. The smallest apparent diameter in each panel was estimated and directly labeled in the image. The medium value of 160 nm was in good agreement with the spatial resolution estimated from Fig. 4(d). The thick tissue imaging results provided concrete evidence that CR-SIM was capable of imaging deep into biological tissue with superresolution and excellent contrast.
4 Discussion
CR-SIM effectively combines structured illumination, image rescan, and confocal detection to achieve remarkable technical breakthroughs in both imaging speed and imaging depth. It can perform high-quality, superresolved fluorescence imaging in cellular samples as well as in thick tissue. For thin biological samples, the enhanced background rejection may not be critical. However, the significantly reduced image acquisition time is highly desirable for capturing fast dynamic biological processes, deferring fading in time-lapse imaging experiments, and minimizing phototoxicity. In addition, the computational load for SIM reconstruction becomes considerably lower. This may enable the real-time rendering of superresolved images.
Among superresolution light microscopy techniques, stimulated emission depletion (STED) depends on nonlinear light–matter interactions and has inherent optical sectioning capability. STED allows imaging in brain tissue down to around tissue depth.20,21 However, STED is a much more expensive and complex technique than SIM. It is also associated with an elevated risk of photobleaching and phototoxicity due to the light intensity required to achieve high resolution. Moreover, the image acquisition speed of STED is low, which is typically 20 to 40 s per frame.22 In contrast, SIM is easy to implement and enjoys advantages such as affordability and imaging speed. Therefore, a SIM-based superresolution microscope with deep tissue imaging capability will significantly expand its application landscape.
Similar to WF-SIM, CR-SIM can achieve a better resolution in the modulation direction by the use of a higher modulation frequency, which was set to the resolution limit for ex vivo imaging experiments reported in this paper. The expense will be a lower modulation depth in the modulation pattern and an elevated noise level in reconstructed images. Moreover, the resolution along the image rescan dimension can also be further improved with appropriate deconvolution procedures. The enhancement (Note S1 in the Supplementary Material) is estimated based on the full-width at half-maximum of the point spread function. Although the OTF is attenuated more in the high-frequency range, the nonzero bandwidth is still extended to double the diffraction limit. It is, therefore, feasible to reshape the OTF numerically and achieve the maximal resolution enhancement of . In practice, this has to be done carefully to find the optimal compromise between the spatial resolution and the SNR.
5 Conclusion
To conclude, we have designed, implemented, and demonstrated a CR-SIM for superresolution imaging of biological samples with significantly improved imaging speed, SBR, and SNR. High-quality, superresolved fluorescence images of EGFP-labeled neuronal structures have been obtained from mouse brain tissue sections with a depth range as large as , a territory beyond the reach of conventional WF-SIM. Our approach is built on top of a standard LSCM with relatively straightforward modifications, making the system robust and easy to operate. The above technical advantages make our technique an excellent candidate for a wide range of biomedical applications that involve cellular samples as well as small animal models.
Biographies of the authors are not available.
References
[2] J.-A. Conchello, J. W. Lichtman. Optical sectioning microscopy. Nat. Methods, 2, 920-931(2005).
[6] J. B. Pawley. Fundamental limits in confocal microscopy. Handbook of Biological Confocal Microscopy, 20-42(2006).
[7] S. Pant et al. Line-scan focal modulation microscopy. J. Biomed. Opt., 22, 050502(2017).

Set citation alerts for the article
Please enter your email address
© Copyright 2018-2021 | Chinese Laser Press. All Rights Reserved 沪ICP备15018463号-20