• Acta Optica Sinica
  • Vol. 38, Issue 6, 0616001 (2018)
Qinglan Ma1、3、*, Shuqing Ma2, Haibao Shao1、3, Honghai Deng1、3, Zhiliang Wang1、3, Jing Huang1、3, Haihong Yin1、3, and Zhenjuan Zhang1、3
Author Affiliations
  • 1 School of Electronics and Information, Nantong University, Nantong, Jiangsu 226019, China
  • 2 Watang Teaching Affairs Department, Xingxian Bureau of Education, Xingxian, Shanxi 0 33600, China
  • 3 School of General Microelectronics, Nantong University, Nantong, Jiangsu 226000, China
  • show less
    DOI: 10.3788/AOS201838.0616001 Cite this Article Set citation alerts
    Qinglan Ma, Shuqing Ma, Haibao Shao, Honghai Deng, Zhiliang Wang, Jing Huang, Haihong Yin, Zhenjuan Zhang. Photoluminescence Performance of Morphology-Tunable Eu 3+-doped Zinc Molybdenum Oxide Hydrate [J]. Acta Optica Sinica, 2018, 38(6): 0616001 Copy Citation Text show less
    XRD spectra of Eu3+-doped ZMO. (a) Thermal annealing treatments at different temperatures; (b) comparison between spectra before thermal annealing and after thermal annealing of 2 h at 200 ℃ temperature
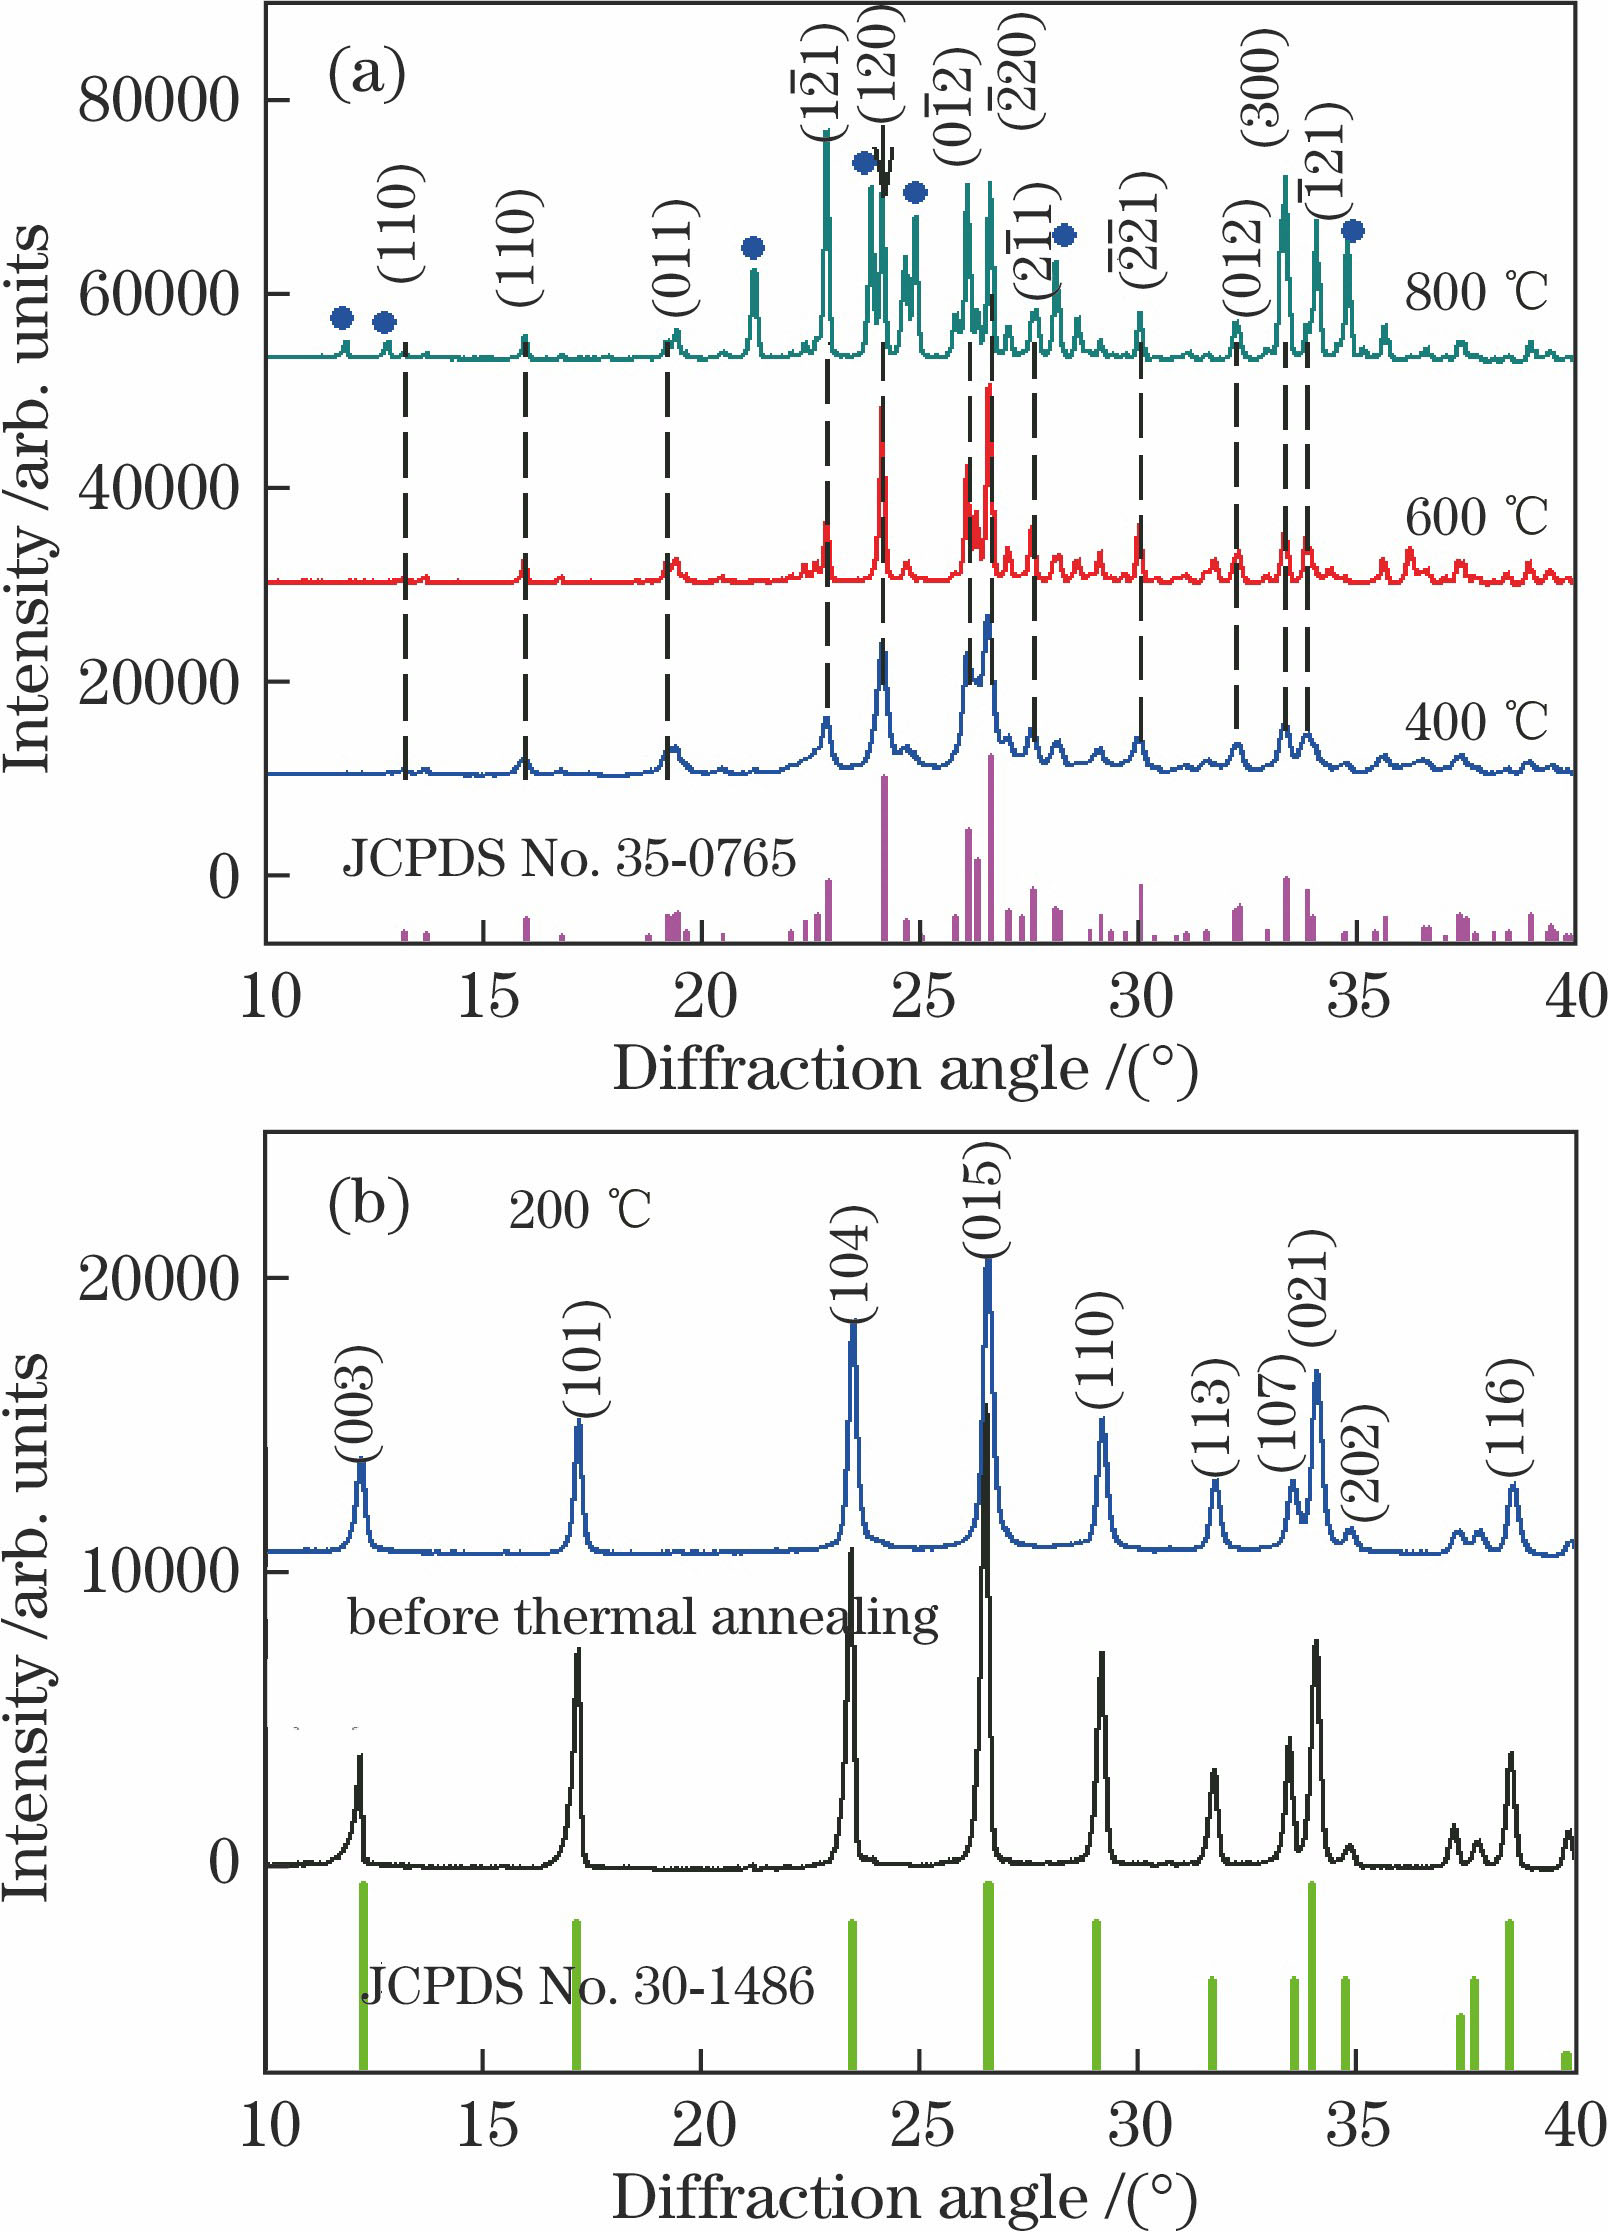
    Fig. 1. XRD spectra of Eu3+-doped ZMO. (a) Thermal annealing treatments at different temperatures; (b) comparison between spectra before thermal annealing and after thermal annealing of 2 h at 200 ℃ temperature
    SEM images of Eu3+-doped ZMO precursor after thermal annealing at different temperatures. (a) 200 ℃; (b) 400 ℃; (c) 600 ℃; (d) 800 ℃
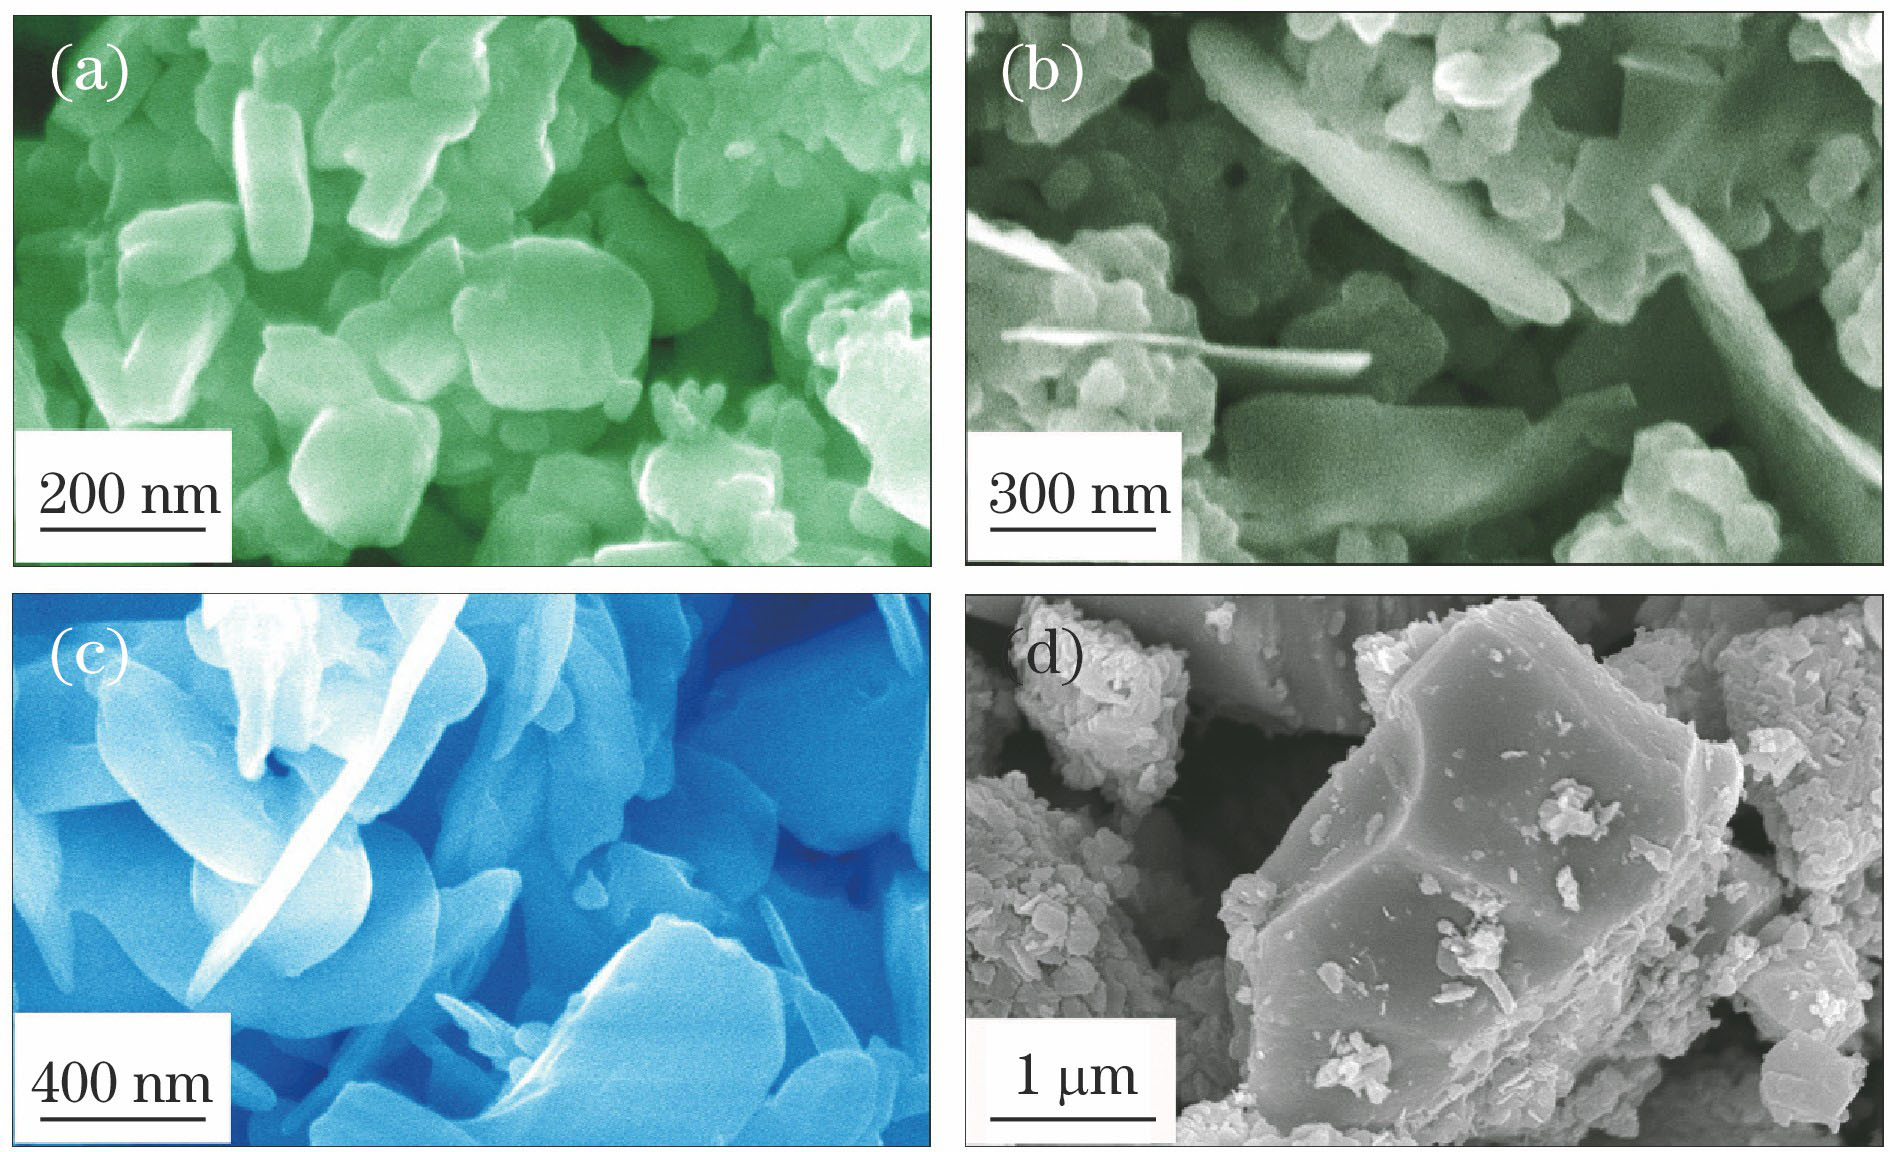
    Fig. 2. SEM images of Eu3+-doped ZMO precursor after thermal annealing at different temperatures. (a) 200 ℃; (b) 400 ℃; (c) 600 ℃; (d) 800 ℃
    Experimental results of Eu3+-doped ZMO. (a) TG curve; (b) DSC curve
    Fig. 3. Experimental results of Eu3+-doped ZMO. (a) TG curve; (b) DSC curve
    PL spectra of Eu3+-doped ZMO after thermal annealing of 2 h at different temperatures. (a) 200 ℃; (b) 400 ℃; (c) 600 ℃; (d) 800 ℃
    Fig. 4. PL spectra of Eu3+-doped ZMO after thermal annealing of 2 h at different temperatures. (a) 200 ℃; (b) 400 ℃; (c) 600 ℃; (d) 800 ℃
    CIE chromaticity diagram of color of PL from Eu3+-doped ZMO after thermal annealing at different temperatures
    Fig. 5. CIE chromaticity diagram of color of PL from Eu3+-doped ZMO after thermal annealing at different temperatures
    Experimental spectra of Eu3+-doped ZMO after sintering of 2 h at 600 ℃. (a) EDX spectrum; (b) PL excitation spectrum
    Fig. 6. Experimental spectra of Eu3+-doped ZMO after sintering of 2 h at 600 ℃. (a) EDX spectrum; (b) PL excitation spectrum
    Absorption spectra of undoped and Eu3+-doped ZMO nanosheets
    Fig. 7. Absorption spectra of undoped and Eu3+-doped ZMO nanosheets
    Semi-log graph of PL attenuation curve of Eu3+-doped ZMO nanosheet excited by 375 nm laser at room temperature. (a) Emission wavelength of 550 nm; (b) emission wavelength of 615 nm
    Fig. 8. Semi-log graph of PL attenuation curve of Eu3+-doped ZMO nanosheet excited by 375 nm laser at room temperature. (a) Emission wavelength of 550 nm; (b) emission wavelength of 615 nm
    Conditiona /nmb /nmc /nma /(°)b /(°)γ /(°)Phase
    As-prepared0.61000.61002.16409090120Zn5Mo2O11·5H2O
    Annealed at 200 ℃0.61100.61102.16309090120Zn5Mo2O11·5H2O
    Annealed at 400 ℃0.83720.97020.6964106.80101.8196.80Triclinic ZnMoO4
    Annealed at 600 ℃0.83640.96890.6960106.86101.7796.75Triclinic ZnMoO4
    Annealed at 800 ℃0.83530.96730.6954106.84101.7696.73ZnMoO4(primary)
    Table 1. Lattice parameters of Eu3+-doped ZMO before and after thermal annealing treatment
    Qinglan Ma, Shuqing Ma, Haibao Shao, Honghai Deng, Zhiliang Wang, Jing Huang, Haihong Yin, Zhenjuan Zhang. Photoluminescence Performance of Morphology-Tunable Eu 3+-doped Zinc Molybdenum Oxide Hydrate [J]. Acta Optica Sinica, 2018, 38(6): 0616001
    Download Citation