• Photonics Research
  • Vol. 10, Issue 7, 1661 (2022)
Changkun Feng1, Yonggui Zhang1, Honghao Ma1, Hui Li1、2、*, and Lishuang Feng1、3、*
Author Affiliations
  • 1School of Instrumentation and Optoelectronics Engineering, Beihang University, Beijing 100191, China
  • 2e-mail: lihui@buaa.edu.cn
  • 3e-mail: fenglishuang_cn@hotmail.com
  • show less
    DOI: 10.1364/PRJ.456321 Cite this Article Set citation alerts
    Changkun Feng, Yonggui Zhang, Honghao Ma, Hui Li, Lishuang Feng. Improving long-term temperature bias stability of an integrated optical gyroscope employing a Si3N4 resonator[J]. Photonics Research, 2022, 10(7): 1661 Copy Citation Text show less
    Relationship between gyroscope sensitivity and coupling coefficient at different waveguide propagation losses.
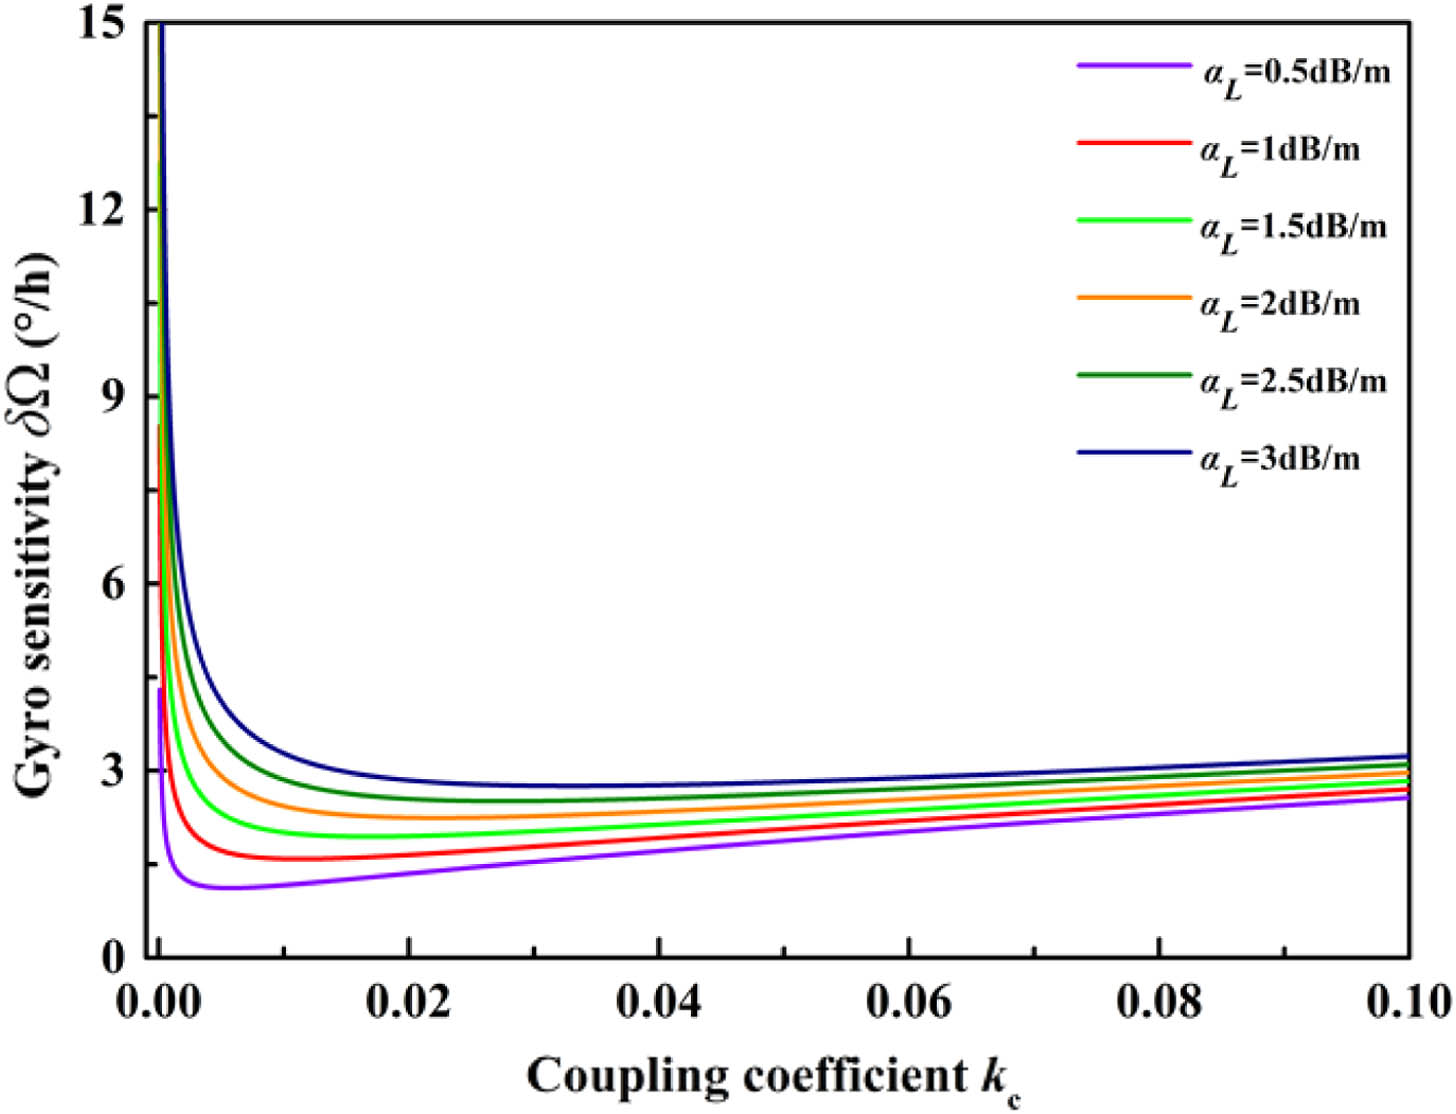
    Fig. 1. Relationship between gyroscope sensitivity and coupling coefficient at different waveguide propagation losses.
    Variation of the peak value of the resonance curve at different propagation losses.
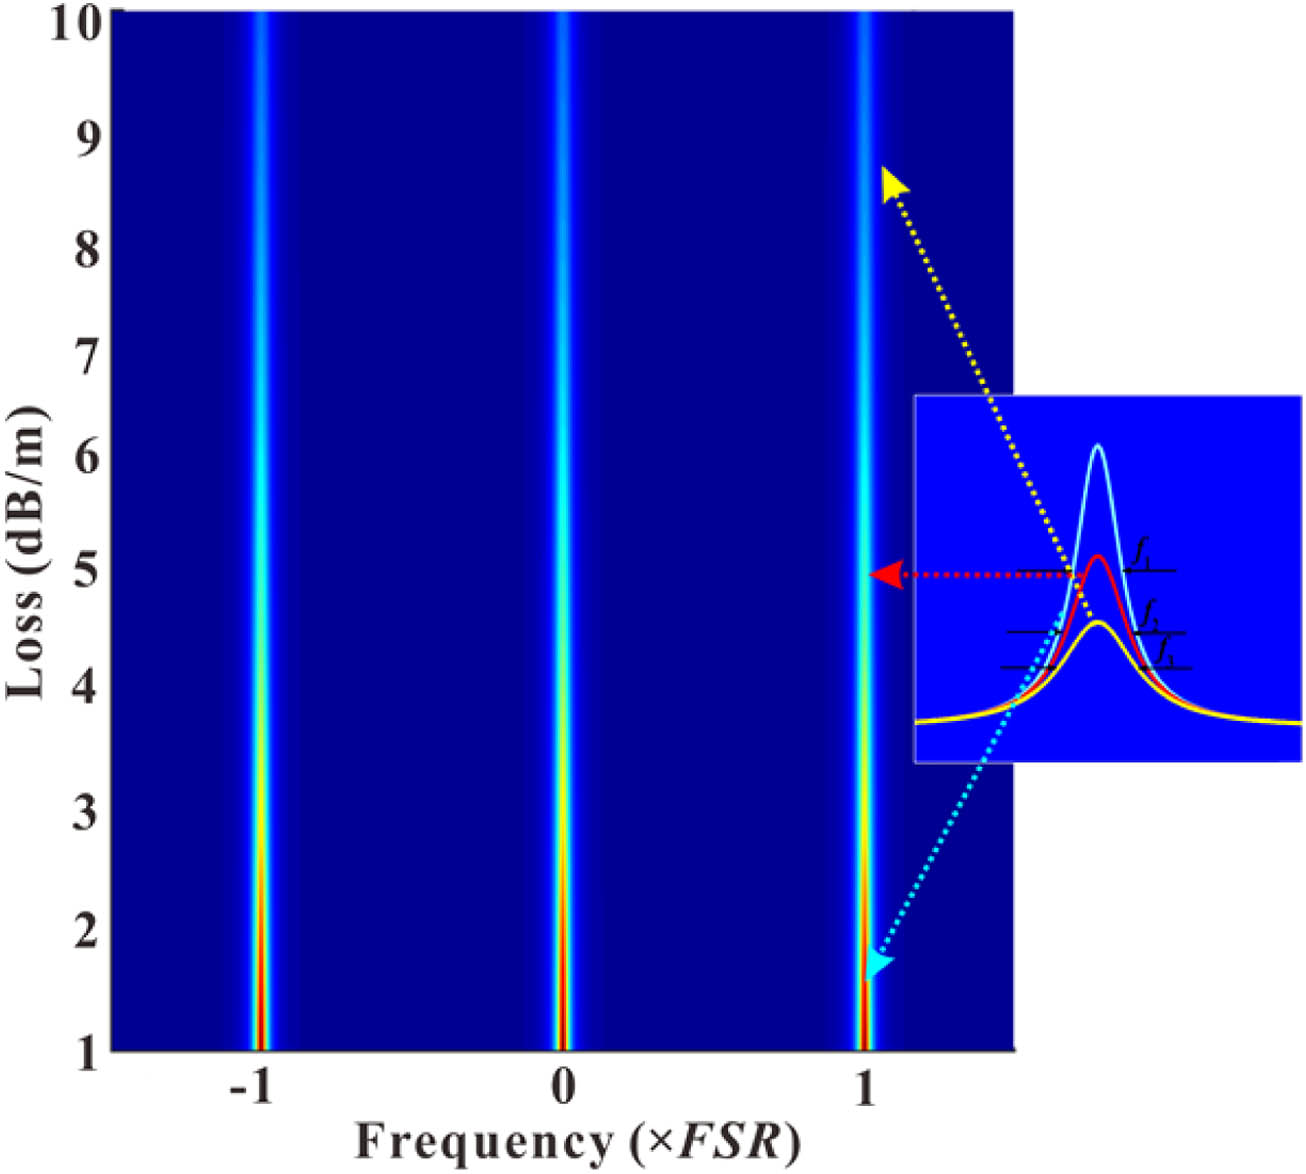
    Fig. 2. Variation of the peak value of the resonance curve at different propagation losses.
    (a) According to the polarization model [19] calculated three-dimensional resonance curve output at different birefringences; D=35 mm, σ=30°, ε=3°, αx=αy=0.5 dB/m, kx=ky=0.05, αCx=αCy=0.01 dB. (b) The relationship between the resonance curve of the resonator and the polarization axis error of the incident light; D=35 mm, ε=0°, αx=αy=0.5 dB/m, kx=ky=0.05, αCx=αCy=0.01 dB. (c) When the polarization-dependent loss αy=800 dB/m, the relationship between the resonance curve of the resonator and the polarization axis error of the incident light; D=35 mm, ε=10°, αx=0.5 dB/m, kx=ky=0.05, αCx=αCy=0.01 dB.
    Fig. 3. (a) According to the polarization model [19] calculated three-dimensional resonance curve output at different birefringences; D=35  mm, σ=30°, ε=3°, αx=αy=0.5  dB/m, kx=ky=0.05, αCx=αCy=0.01  dB. (b) The relationship between the resonance curve of the resonator and the polarization axis error of the incident light; D=35  mm, ε=0°, αx=αy=0.5  dB/m, kx=ky=0.05, αCx=αCy=0.01  dB. (c) When the polarization-dependent loss αy=800  dB/m, the relationship between the resonance curve of the resonator and the polarization axis error of the incident light; D=35  mm, ε=10°, αx=0.5  dB/m, kx=ky=0.05, αCx=αCy=0.01  dB.
    (a) Structure diagram of the Si3N4 waveguide resonator, (b) TE mode, (c) TM mode.
    Fig. 4. (a) Structure diagram of the Si3N4 waveguide resonator, (b) TE mode, (c) TM mode.
    Infrared photograph of the Si3N4 waveguide resonator with rear illumination showing scattered light.
    Fig. 5. Infrared photograph of the Si3N4 waveguide resonator with rear illumination showing scattered light.
    Relative test curve of the Si3N4 waveguide resonator. SG, signal generator; ISO, isolator; PM, phase modulator; PD, photodetector; OSC, oscilloscope. (a) Resonance curve test system, (b) transmission curve, (c) reflection curve, and (d) backscattering curve.
    Fig. 6. Relative test curve of the Si3N4 waveguide resonator. SG, signal generator; ISO, isolator; PM, phase modulator; PD, photodetector; OSC, oscilloscope. (a) Resonance curve test system, (b) transmission curve, (c) reflection curve, and (d) backscattering curve.
    Measured resonance curves at different temperatures: (a) Si3N4 waveguide resonator, (b) silica waveguide resonator.
    Fig. 7. Measured resonance curves at different temperatures: (a) Si3N4 waveguide resonator, (b) silica waveguide resonator.
    RIOG measurement system based on the Si3N4 waveguide resonator. ISO, isolator; LiNbO3, lithium niobate; OC, optical circulator; PD, photodetector; ADC, analog digital converter; DAC, digital analog converter; Dem, demodulation; PI, proportional integral; FSD, frequency shift driver.
    Fig. 8. RIOG measurement system based on the Si3N4 waveguide resonator. ISO, isolator; LiNbO3, lithium niobate; OC, optical circulator; PD, photodetector; ADC, analog digital converter; DAC, digital analog converter; Dem, demodulation; PI, proportional integral; FSD, frequency shift driver.
    Measurement results of the RIOG based on the Si3N4 waveguide resonator at rest from the Allan variance analysis result: (a) at room temperature, (b) at 40°C, (c) at 50°C, and (d) at 60°C.
    Fig. 9. Measurement results of the RIOG based on the Si3N4 waveguide resonator at rest from the Allan variance analysis result: (a) at room temperature, (b) at 40°C, (c) at 50°C, and (d) at 60°C.
    Changkun Feng, Yonggui Zhang, Honghao Ma, Hui Li, Lishuang Feng. Improving long-term temperature bias stability of an integrated optical gyroscope employing a Si3N4 resonator[J]. Photonics Research, 2022, 10(7): 1661
    Download Citation