• Acta Optica Sinica
  • Vol. 40, Issue 15, 1523002 (2020)
Shoulong Xu1、2、*, Kuicheng Lin3, Yongchao Han4、**, Shuliang Zou1、***, Xiuwu Yu1, Qifan Wu2, Yantao Qu4, Hongtao Quan5, and Zengyan Li6
Author Affiliations
  • 1School of Resource Environment and Safety Engineering, University of South China, Hengyang, Hunan 421001, China
  • 2Department of Engineering Physics, Tsinghua University, Beijing 100084, China
  • 3Instituted of Materials, China Academy of Engineering Physics, Mianyang, Sichuan 621700, China
  • 4CNNC New Energy Company Limited, Beijing 102413, China
  • 5School of Mechanical and Electrical Engineering, University of Electronic Science and Technology of China, Chengdu, Sichuan 611731, China
  • 6Northwest Institute of Nuclear Technology, Xi′an, Shaanxi 710024, China
  • show less
    DOI: 10.3788/AOS202040.1523002 Cite this Article Set citation alerts
    Shoulong Xu, Kuicheng Lin, Yongchao Han, Shuliang Zou, Xiuwu Yu, Qifan Wu, Yantao Qu, Hongtao Quan, Zengyan Li. Study on γ-Ray Irradiation Damage Mode and Characterization of CMOS APS Camera[J]. Acta Optica Sinica, 2020, 40(15): 1523002 Copy Citation Text show less
    Schematic diagram of sensor Bayer array
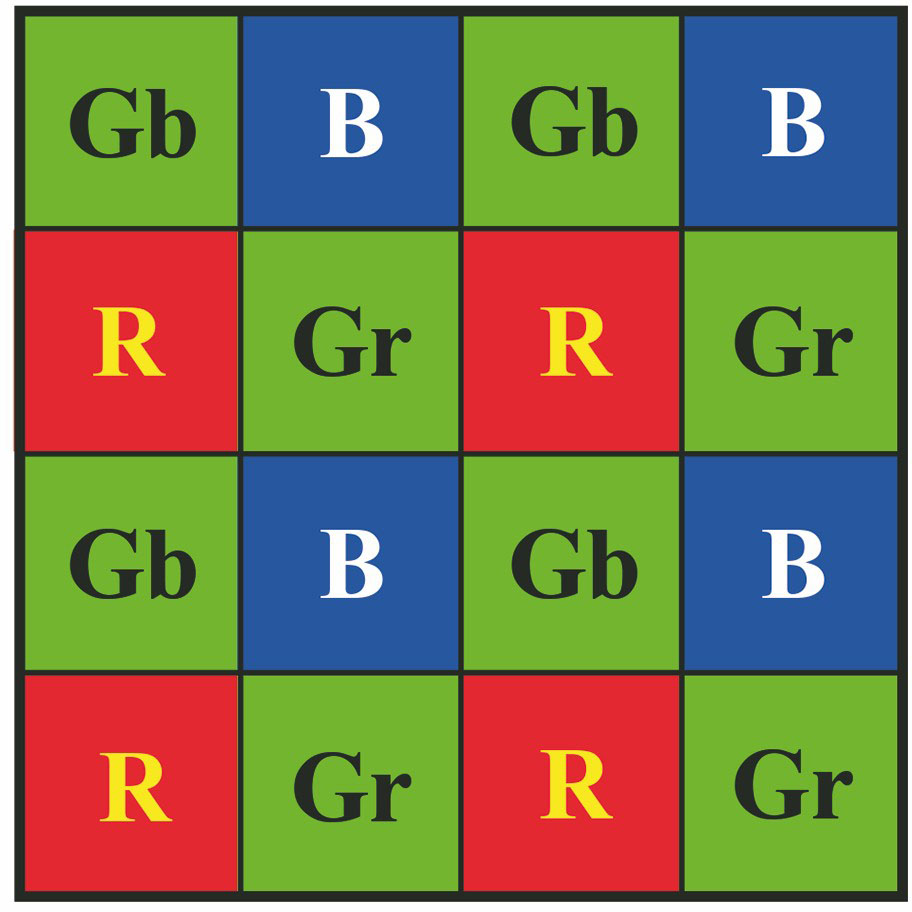
    Fig. 1. Schematic diagram of sensor Bayer array
    Schematic of experimental system
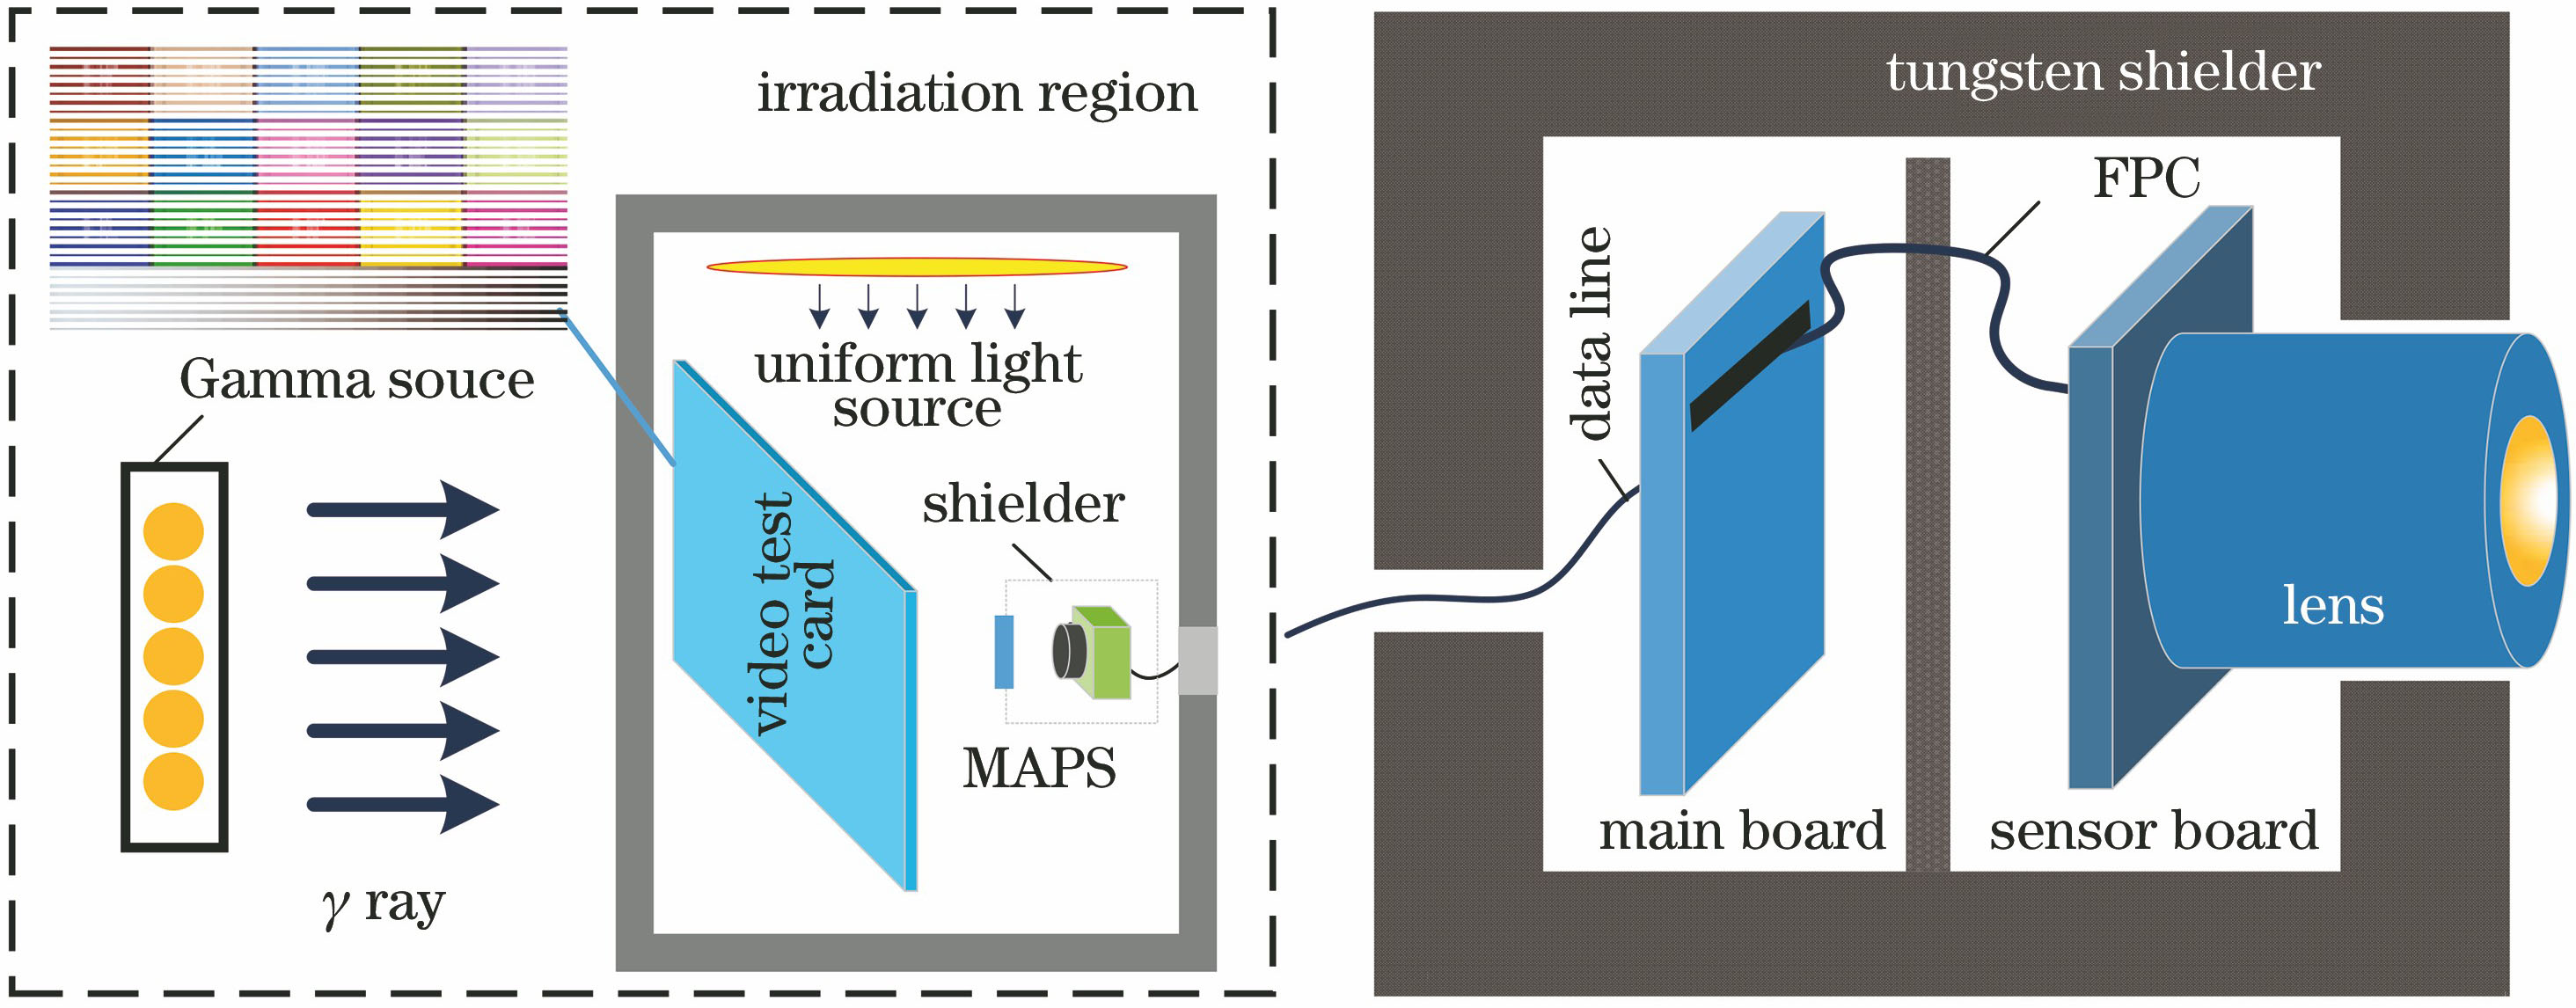
    Fig. 2. Schematic of experimental system
    Radiation damage of dark and color image
    Fig. 3. Radiation damage of dark and color image
    Distribution of dark current noise in dark image
    Fig. 4. Distribution of dark current noise in dark image
    Scatter diagram of radiation life of main board and sensor board
    Fig. 5. Scatter diagram of radiation life of main board and sensor board
    Gray scale stripe of video test card before and after irradiation. (a) Before irradiation; (b) 50 Gy; (c) 101 Gy; (d) 154 Gy
    Fig. 6. Gray scale stripe of video test card before and after irradiation. (a) Before irradiation; (b) 50 Gy; (c) 101 Gy; (d) 154 Gy
    Logic block diagram of fixed image denoising algorithm
    Fig. 7. Logic block diagram of fixed image denoising algorithm
    Grid images of pixel values for each channel of the frame image before and after noise reduction. (a) Color grid image before noise reduction; (b) color grid image after noise reduction; (c) gray scale stripe before noise reduction; (d) gray scale stripe after noise reduction
    Fig. 8. Grid images of pixel values for each channel of the frame image before and after noise reduction. (a) Color grid image before noise reduction; (b) color grid image after noise reduction; (c) gray scale stripe before noise reduction; (d) gray scale stripe after noise reduction
    Relationship between pixel value and total ionizing dose for gray scale stripe image. (a) Gray value; (b) red pixel; (c) green pixel; (d) blue pixel
    Fig. 9. Relationship between pixel value and total ionizing dose for gray scale stripe image. (a) Gray value; (b) red pixel; (c) green pixel; (d) blue pixel
    Scatterplot of color image pixel value with total dose
    Fig. 10. Scatterplot of color image pixel value with total dose
    Scatterplot of the average pixel value for each gray channel after correction with the total dose
    Fig. 11. Scatterplot of the average pixel value for each gray channel after correction with the total dose
    No.NameTotal ionizing dose /%
    0 Gy88.4 Gy1010 Gy
    1#Filter97.795.292.3
    2#98.295.693.3
    3#3.6 mm lens85.276.019.4
    4#84.874.819.9
    5#4 mm lens87.478.920.7
    6#86.578.318.8
    Table 1. Relationship between the transmittance of lens and filter with total radiation dose
    No.y0t1A1R2
    1178.4743.13198.360.9982
    2181.6441.33189.120.9975
    3185.8933.84146.910.9969
    4179.0236.53162.380.9982
    5172.8037.59180.150.9983
    6167.7338.07184.310.9982
    7152.2145.34215.530.9982
    8143.6146.99226.860.9968
    9109.7473.85364.450.9964
    10120.7254.28233.580.9925
    11101.2862.56266.950.9908
    12102.2749.97189.240.9870
    1393.9044.53155.250.9887
    1480.7043.19151.730.9894
    1567.7937.55147.120.9878
    1654.3234.97155.620.9856
    1741.6532.86135.580.9889
    1831.8323.85154.060.9826
    1920.7116.44138.590.9809
    209.046.13117.300.8786
    Table 2. Scatter index fitting results
    Shoulong Xu, Kuicheng Lin, Yongchao Han, Shuliang Zou, Xiuwu Yu, Qifan Wu, Yantao Qu, Hongtao Quan, Zengyan Li. Study on γ-Ray Irradiation Damage Mode and Characterization of CMOS APS Camera[J]. Acta Optica Sinica, 2020, 40(15): 1523002
    Download Citation