• Photonics Research
  • Vol. 11, Issue 5, 817 (2023)
Zhenhui Zhang1、2, Wei Chen1、2, Dandan Cui1、2, Jie Mi1、2, Gen Mu1、2, Liming Nie3、4、5、*, Sihua Yang1、2, and Yujiao Shi1、2、6、*
Author Affiliations
  • 1MOE Key Laboratory of Laser Life Science & Institute of Laser Life Science, South China Normal University, Guangzhou 510631, China
  • 2Guangdong Provincial Key Laboratory of Laser Life Science, College of Biophotonics, South China Normal University, Guangzhou 510631, China
  • 3School of Medicine, South China University of Technology, Guangzhou 510006, China
  • 4Research Center of Medical Sciences, Guangdong Provincial People’s Hospital, Guangdong Academy of Medical Sciences, Guangzhou 510080, China
  • 5e-mail: limingnie@gmail.com
  • 6e-mail: shiyuj@scnu.edu.cn
  • show less
    DOI: 10.1364/PRJ.485022 Cite this Article Set citation alerts
    Zhenhui Zhang, Wei Chen, Dandan Cui, Jie Mi, Gen Mu, Liming Nie, Sihua Yang, Yujiao Shi. Collagen fiber anisotropy characterization by polarized photoacoustic imaging for just-in-time quantitative evaluation of burn severity[J]. Photonics Research, 2023, 11(5): 817 Copy Citation Text show less
    Schematic representation of burn assessment. (a) Schematic diagram of the relationship between the optical axis orientation ϕ of single-collagen fiber and the electric vector E(φ) of incident light. θ is the angle between ϕ and E, and Δθn is the wobbling angle of ϕ. (b) Schematic of burn model. (c) Angular extent 2Δθ of multiple collagen fibers’ average optical axis orientation pointing direction in different burn severity situations. The worse the order of the whole, the greater the value of Δθ. Optical absorption of collagen fibers becomes more isotropic as the burn severity increases, and for multiple-collagen fibers, the change of the PA signal amplitude with angle θ under different Δθ conditions.
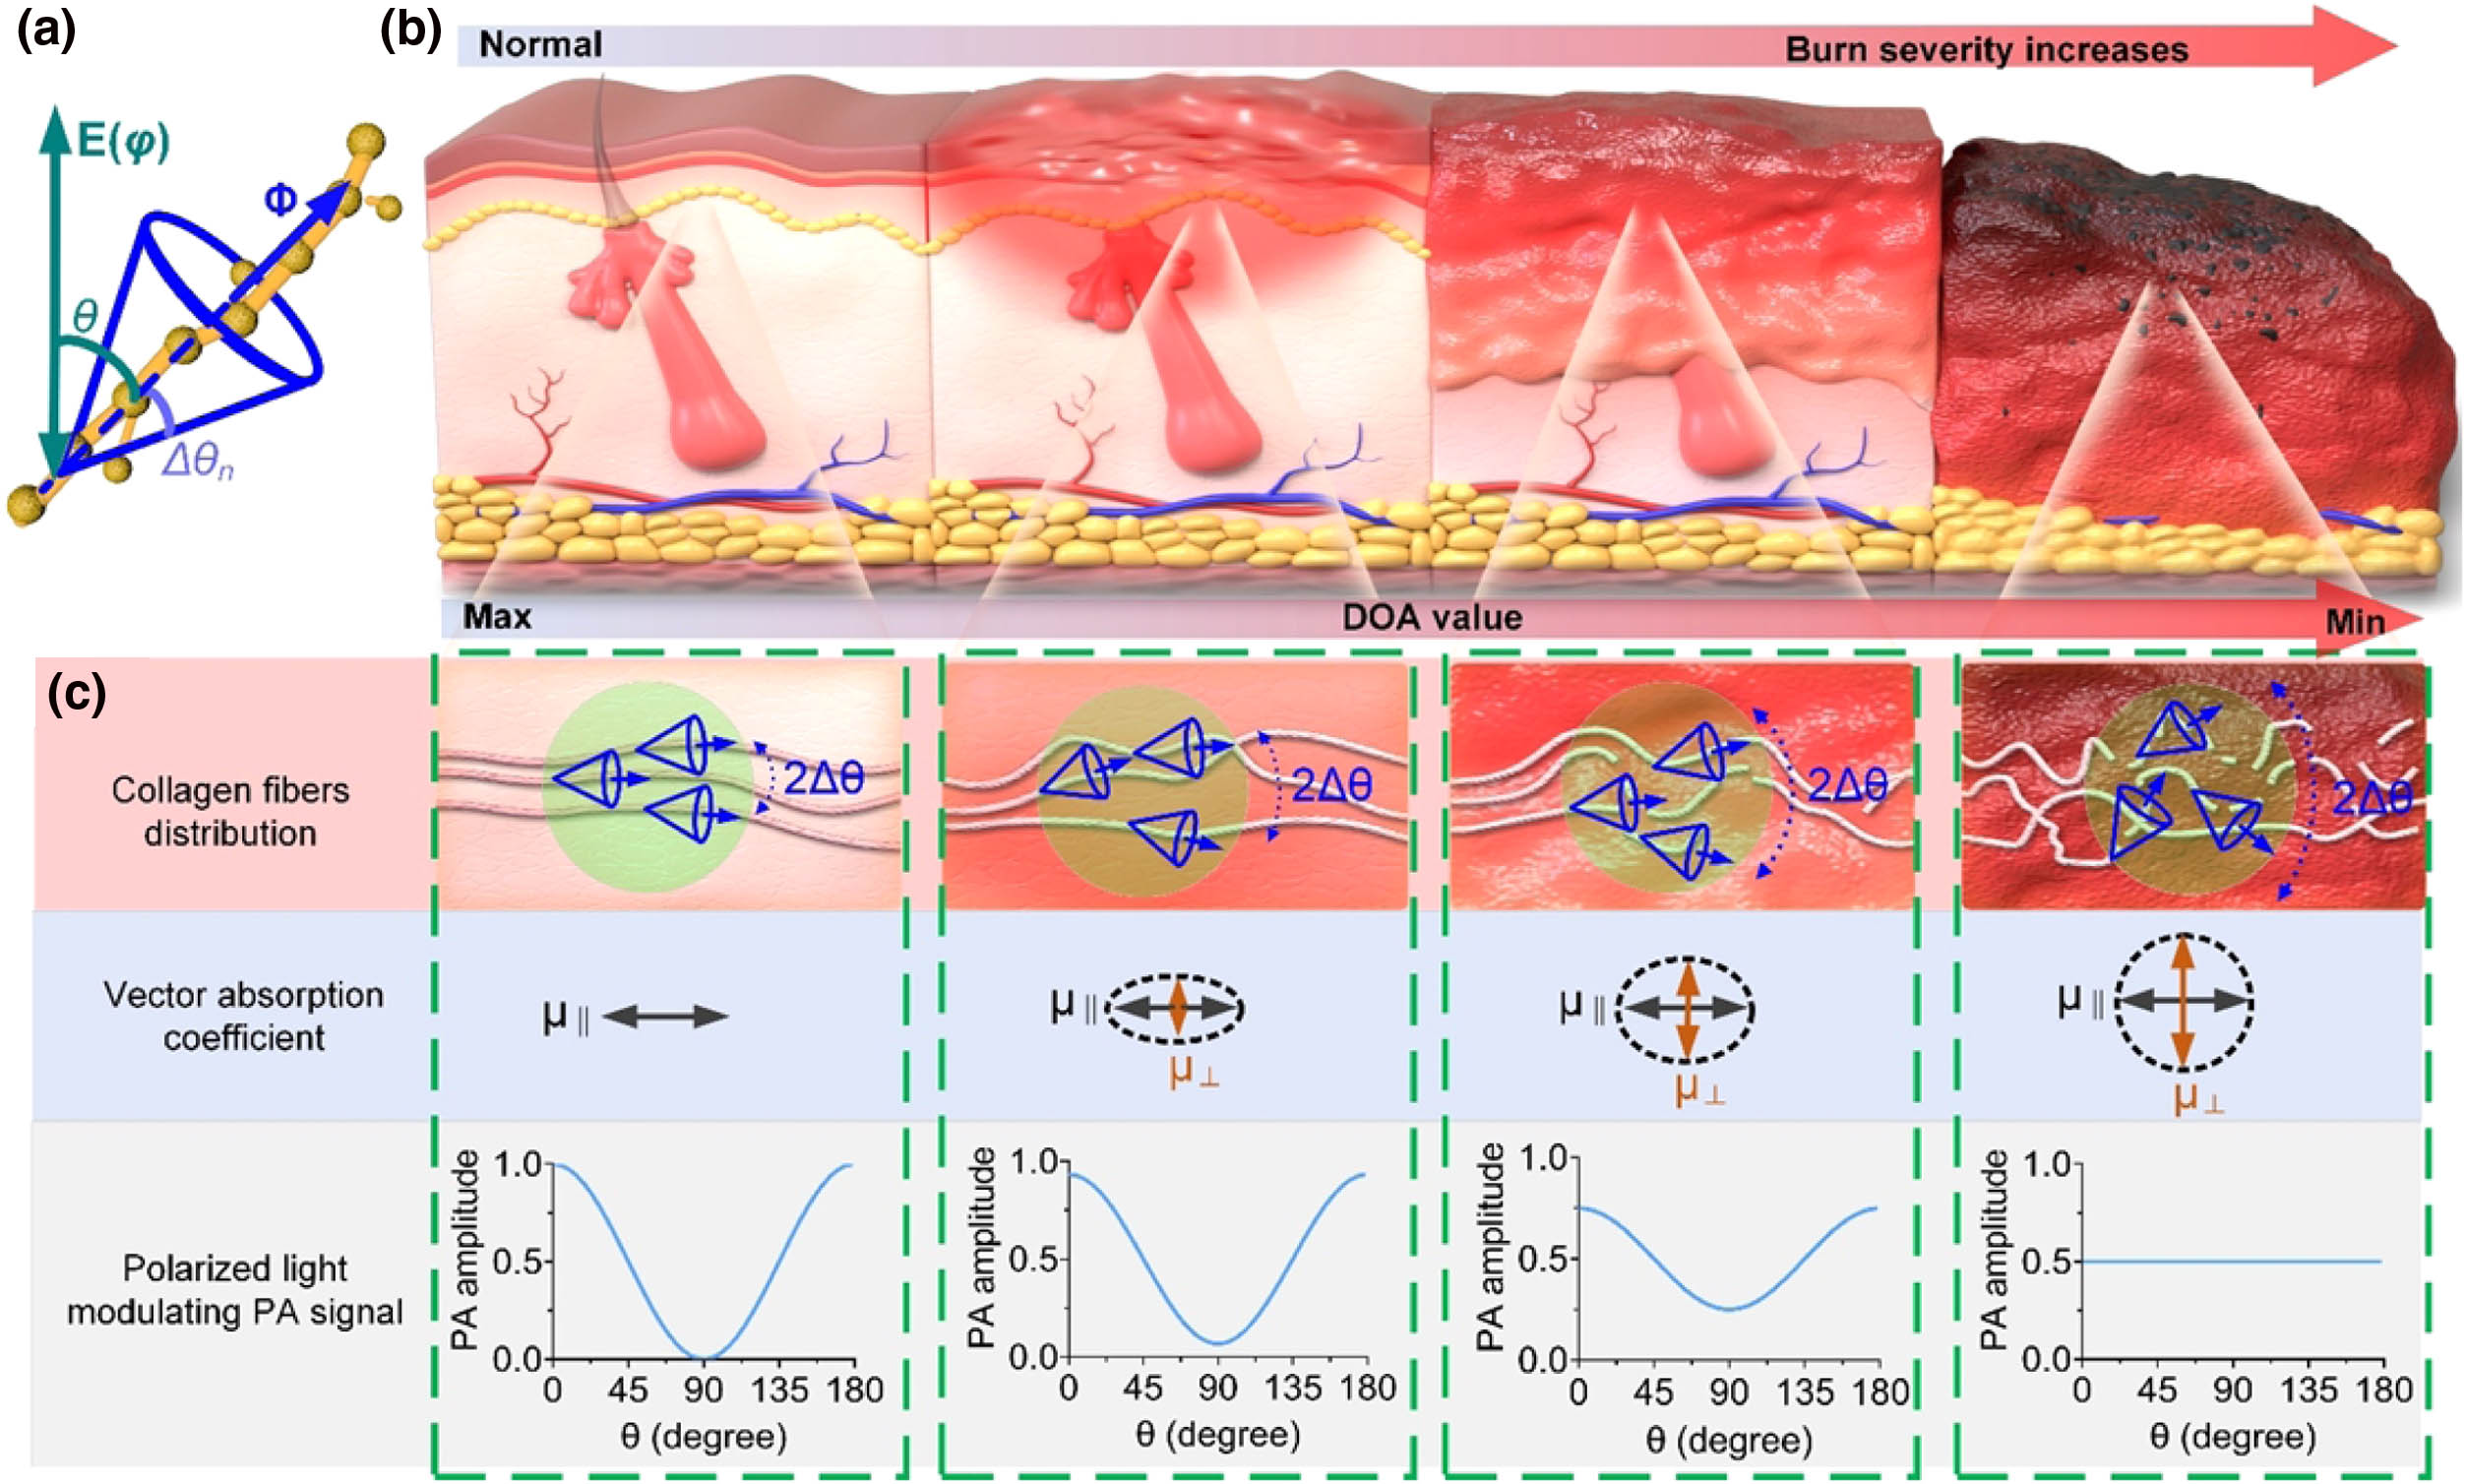
    Fig. 1. Schematic representation of burn assessment. (a) Schematic diagram of the relationship between the optical axis orientation ϕ of single-collagen fiber and the electric vector E(φ) of incident light. θ is the angle between ϕ and E, and Δθn is the wobbling angle of ϕ. (b) Schematic of burn model. (c) Angular extent 2Δθ of multiple collagen fibers’ average optical axis orientation pointing direction in different burn severity situations. The worse the order of the whole, the greater the value of Δθ. Optical absorption of collagen fibers becomes more isotropic as the burn severity increases, and for multiple-collagen fibers, the change of the PA signal amplitude with angle θ under different Δθ conditions.
    Fundamental characteristics of the PPAT imaging system. (a) PPAT imaging experimental setup: L1, L2, lenses; PBS, polarizing beam splitter cubes; PD, photodiode; 2D-GS, 2D galvo mirrors system; P, polarizer; HWP, half-wave plate; OB, objective; UT, ultrasonic transducer; AMP, broadband amplifier; DAQ, data acquisition system. (b) Excitation laser power stability; the power fluctuation is 1.0% when the laser operates for 30 min (repetition rate of 1 kHz). (c) Polarization diagrams of laser power obtained by rotating the polarizer and HWP respectively. (d) Lateral resolutions of PPAT imaging system near the light focus. (e) Axial profiles of a 20 μm diameter tungsten by PPAT imaging system. FWHM of the profile is 64.5 μm at acoustic focus.
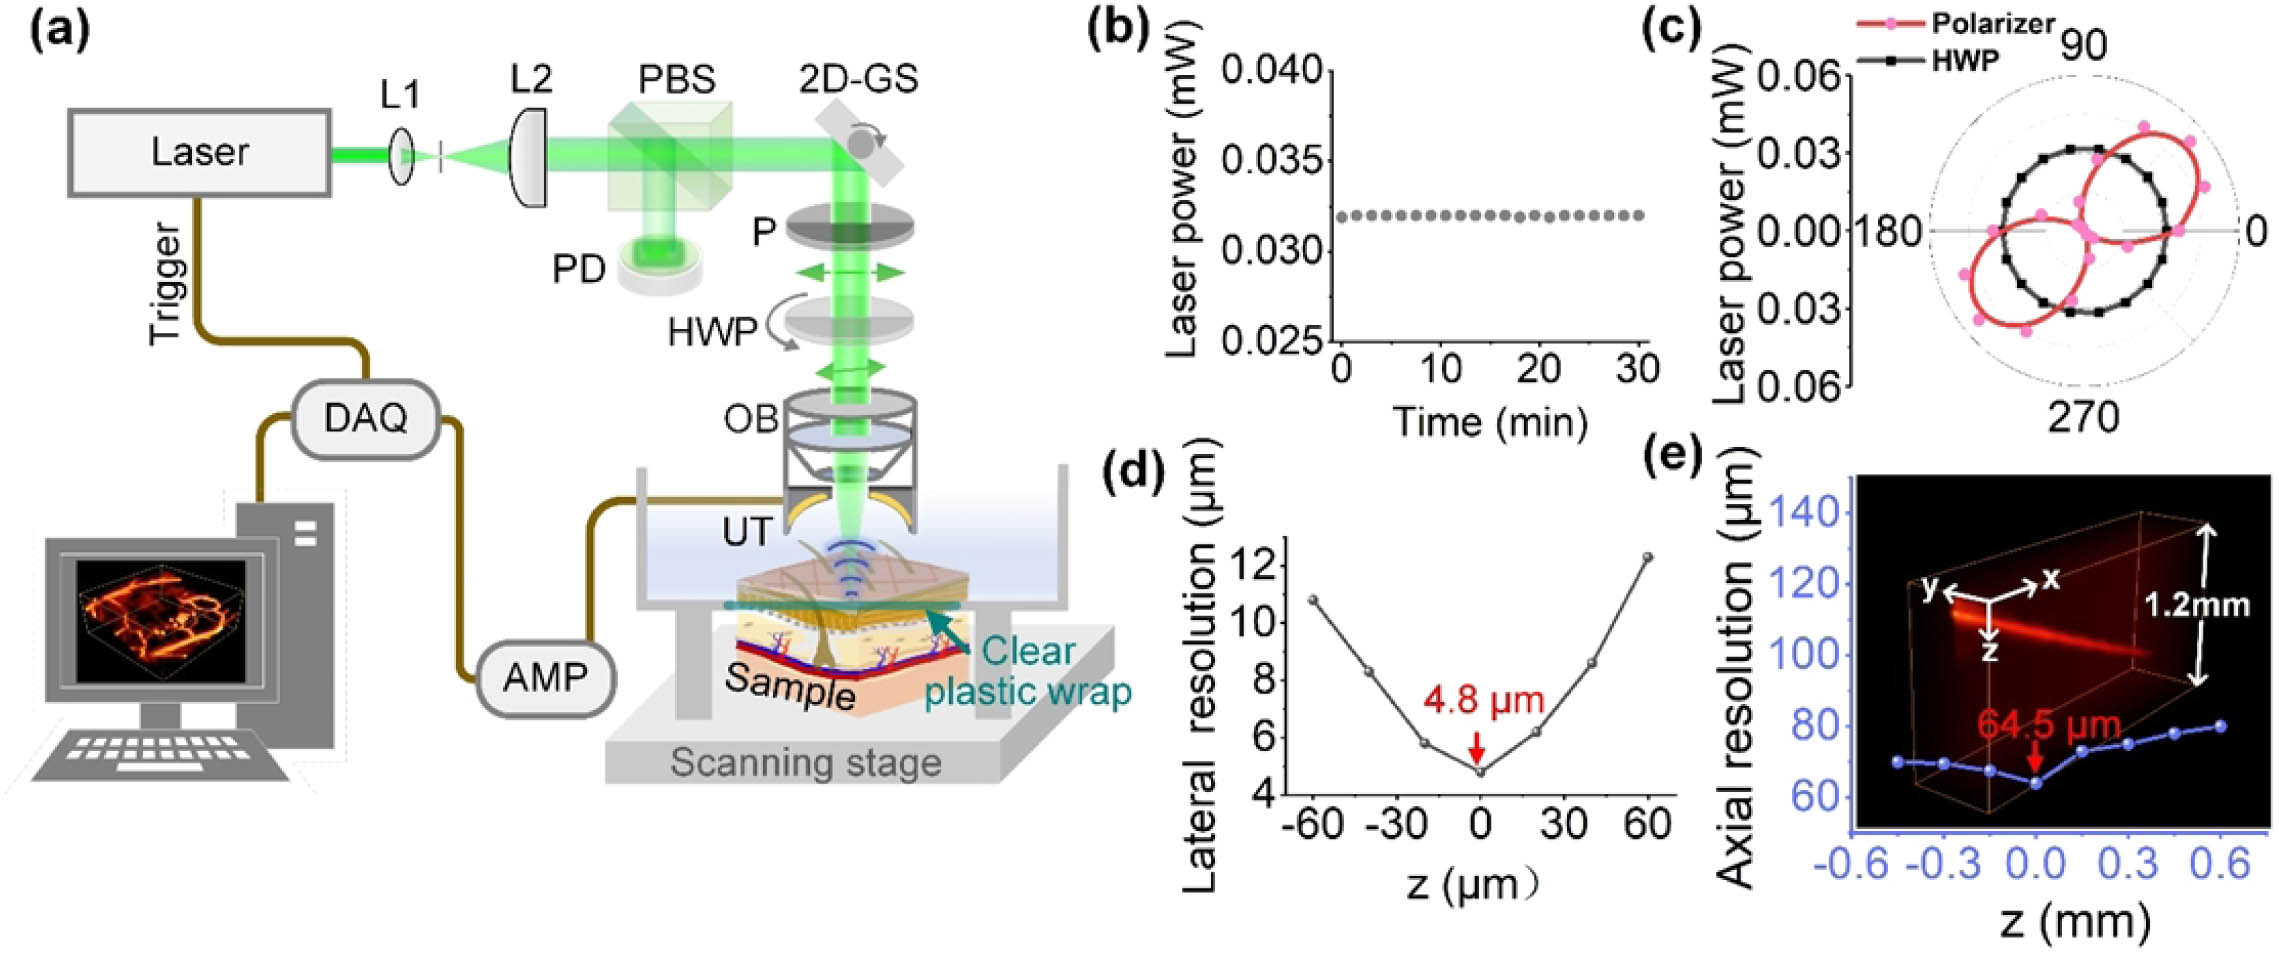
    Fig. 2. Fundamental characteristics of the PPAT imaging system. (a) PPAT imaging experimental setup: L1, L2, lenses; PBS, polarizing beam splitter cubes; PD, photodiode; 2D-GS, 2D galvo mirrors system; P, polarizer; HWP, half-wave plate; OB, objective; UT, ultrasonic transducer; AMP, broadband amplifier; DAQ, data acquisition system. (b) Excitation laser power stability; the power fluctuation is 1.0% when the laser operates for 30 min (repetition rate of 1 kHz). (c) Polarization diagrams of laser power obtained by rotating the polarizer and HWP respectively. (d) Lateral resolutions of PPAT imaging system near the light focus. (e) Axial profiles of a 20 μm diameter tungsten by PPAT imaging system. FWHM of the profile is 64.5 μm at acoustic focus.
    PPAT quantitatively characterizes the change in microstructural anisotropy. (a) Schematic illustration of the fabricated sample. (b)–(d) are polarized PA image, PA image, and DOA image, respectively. The black arrow in (b) indicates the direction of the incident light electric vector. (e) DOA profiles along the dashed lines in (d). (f) Polarization diagrams of PA amplitude at positions 1–4 in (d). (g) Schematic diagram of the sample covering the scattering material (the transport mean free path ∼4 mm): PVA, polyvinyl alcohol (anisotropic absorption); PVC, polyvinyl chloride (isotropic absorption). (h) and (i) are PA image and DOA image corresponding to (g), respectively. (j) Statistics of PA amplitude and DOA values at difference depth in (h) and (i), respectively.
    Fig. 3. PPAT quantitatively characterizes the change in microstructural anisotropy. (a) Schematic illustration of the fabricated sample. (b)–(d) are polarized PA image, PA image, and DOA image, respectively. The black arrow in (b) indicates the direction of the incident light electric vector. (e) DOA profiles along the dashed lines in (d). (f) Polarization diagrams of PA amplitude at positions 1–4 in (d). (g) Schematic diagram of the sample covering the scattering material (the transport mean free path 4  mm): PVA, polyvinyl alcohol (anisotropic absorption); PVC, polyvinyl chloride (isotropic absorption). (h) and (i) are PA image and DOA image corresponding to (g), respectively. (j) Statistics of PA amplitude and DOA values at difference depth in (h) and (i), respectively.
    Anisotropic characteristics of collagen fibers and whole blood. (a) The experimental setup was used to measure the depolarization of linearly polarized light after passing through a certain depth of blood. Blood was diluted 1:5 with PBS. (b) Polarization diagrams of linearly polarized light after passing through a certain depth of diluted blood. (c) Variations of laser power and degree of linear polarization (DLP) with the depth of diluted blood increase. (d) Optical absorption spectra of fresh whole blood, purified collagen (collagen from bovine Achilles tendon, type I, CAS-number 9007-34-5), and fresh bovine Achilles tissue, respectively. (e) PA signal amplitude of whole blood and fresh bovine Achilles tissue over time, respectively. (f) PA signal amplitude of whole blood and fresh bovine Achilles tissue varying with the direction of the electric vector, respectively. (g) Sample photograph of bovine Achilles and minced beef. (h) and (i) PA image and DOA image for (g). (j) Signal amplitude profiles along the white dashed lines in (h) and (i).
    Fig. 4. Anisotropic characteristics of collagen fibers and whole blood. (a) The experimental setup was used to measure the depolarization of linearly polarized light after passing through a certain depth of blood. Blood was diluted 1:5 with PBS. (b) Polarization diagrams of linearly polarized light after passing through a certain depth of diluted blood. (c) Variations of laser power and degree of linear polarization (DLP) with the depth of diluted blood increase. (d) Optical absorption spectra of fresh whole blood, purified collagen (collagen from bovine Achilles tendon, type I, CAS-number 9007-34-5), and fresh bovine Achilles tissue, respectively. (e) PA signal amplitude of whole blood and fresh bovine Achilles tissue over time, respectively. (f) PA signal amplitude of whole blood and fresh bovine Achilles tissue varying with the direction of the electric vector, respectively. (g) Sample photograph of bovine Achilles and minced beef. (h) and (i) PA image and DOA image for (g). (j) Signal amplitude profiles along the white dashed lines in (h) and (i).
    PPAT quantitative imaging of fresh ex vivo burn tissue. (a) Burn photos of pig skin tissue. (b) H&E staining of normal and burn tissues. (c), (d) PA image and DOA image, respectively. (e) Three-dimensional (3D) polarized PA imaging of normal tissue area. (f) 3D-DOA imaging corresponding to (e). (g) 3D-polarized PA imaging of burn tissue area. (h) 3D-DOA imaging corresponding to (g). (i) Statistical results of DOA average values in (f) normal and (h) burn areas.
    Fig. 5. PPAT quantitative imaging of fresh ex vivo burn tissue. (a) Burn photos of pig skin tissue. (b) H&E staining of normal and burn tissues. (c), (d) PA image and DOA image, respectively. (e) Three-dimensional (3D) polarized PA imaging of normal tissue area. (f) 3D-DOA imaging corresponding to (e). (g) 3D-polarized PA imaging of burn tissue area. (h) 3D-DOA imaging corresponding to (g). (i) Statistical results of DOA average values in (f) normal and (h) burn areas.
    PPAT quantitative imaging of burn tissue. (a) Burn photo of pig skin tissue. (b)–(d) PA image, DOA image, and overlay of PA image and DOA image at x−z cross section along the white dashed line in (a), respectively. (e), (f) PA and DOA images at different imaging depths, respectively. (g) H&E staining of the x−z section corresponding to the position of the white dashed line in (a). (h) Statistical diagrams of PA amplitude and DOA value with depth along the white dashed line in the burn areas 1, 2, and 3 of (a), respectively. (i) Linear fitting of the burn depth identified from the PA signal peak and the depth identified from the H&E staining, linear fitting of the burn depth identified from the DOA imaging, and depth identified from the H&E staining. R is the Pearson correlation coefficient. (j) Change of the burn area identified by PA imaging with the depth of burn (it is considered that the amplitude of photoacoustic signal in the burn area is more than 5 times greater than that in the normal area). (k) Change of burn area identified by DOA imaging with the depth of burn (areas with DOA values less than 0.62 are burn areas).
    Fig. 6. PPAT quantitative imaging of burn tissue. (a) Burn photo of pig skin tissue. (b)–(d) PA image, DOA image, and overlay of PA image and DOA image at xz cross section along the white dashed line in (a), respectively. (e), (f) PA and DOA images at different imaging depths, respectively. (g) H&E staining of the xz section corresponding to the position of the white dashed line in (a). (h) Statistical diagrams of PA amplitude and DOA value with depth along the white dashed line in the burn areas 1, 2, and 3 of (a), respectively. (i) Linear fitting of the burn depth identified from the PA signal peak and the depth identified from the H&E staining, linear fitting of the burn depth identified from the DOA imaging, and depth identified from the H&E staining. R is the Pearson correlation coefficient. (j) Change of the burn area identified by PA imaging with the depth of burn (it is considered that the amplitude of photoacoustic signal in the burn area is more than 5 times greater than that in the normal area). (k) Change of burn area identified by DOA imaging with the depth of burn (areas with DOA values less than 0.62 are burn areas).
    In vivo imaging of burn tissue. (a) Sample photo. (b), (c) 3D-PA image and overlay of PA and DOA image, respectively. (d) PA imaging and overlay of PA and DOA imaging of x−z section corresponding to (c) 1–4 positions, respectively. (e) Box plot result of DOA values of (d). For all boxes, the central line represents the median, and the square represents the mean. n.s., not significant, ***,P<0.001. (f) Cross-sectional histological images (H&E staining) of the positions 1–4.
    Fig. 7. In vivo imaging of burn tissue. (a) Sample photo. (b), (c) 3D-PA image and overlay of PA and DOA image, respectively. (d) PA imaging and overlay of PA and DOA imaging of xz section corresponding to (c) 1–4 positions, respectively. (e) Box plot result of DOA values of (d). For all boxes, the central line represents the median, and the square represents the mean. n.s., not significant, ***,P<0.001. (f) Cross-sectional histological images (H&E staining) of the positions 1–4.
    Anisotropy of collagen fibers in the early stage of burn can predict the dynamic changes of the wound after burn. (a)–(c) are the results of DOA and PA imaging at different times after the dorsal skin of three rats was exposed to different high temperatures (100°C, 150°C, and 200°C) for 5 s; (d) changes in burn area over time in three rats; (e) fit between the mean value of DOA of the burn area at the time of initial burn and the wound change rate, where Pearson correlation coefficient R=−0.96.
    Fig. 8. Anisotropy of collagen fibers in the early stage of burn can predict the dynamic changes of the wound after burn. (a)–(c) are the results of DOA and PA imaging at different times after the dorsal skin of three rats was exposed to different high temperatures (100°C, 150°C, and 200°C) for 5 s; (d) changes in burn area over time in three rats; (e) fit between the mean value of DOA of the burn area at the time of initial burn and the wound change rate, where Pearson correlation coefficient R=0.96.
    Zhenhui Zhang, Wei Chen, Dandan Cui, Jie Mi, Gen Mu, Liming Nie, Sihua Yang, Yujiao Shi. Collagen fiber anisotropy characterization by polarized photoacoustic imaging for just-in-time quantitative evaluation of burn severity[J]. Photonics Research, 2023, 11(5): 817
    Download Citation