Just-in-time burn severity assessment plays a vital role in burn treatment and care. However, it is still difficult to quantitatively and promptly evaluate burn severity by existing medical imaging methods via initial burn depth measurement since burn wounds are usually dynamically developed. As an elastic skeleton of skin, the degree of conformational changes of collagen fibers caused by overheating can reflect the burn severity in a timelier manner. Herein, the polarized photoacoustic technique (PPAT) for just-in-time quantitative evaluation of burn severity via collagen fiber anisotropy assessment is proposed. First, phantom experiments demonstrate the ability of PPAT for deep imaging in a transport mean free path and accurately quantify changes in microstructural order by thermal damage. Then, the Pearson correlation coefficient of the PPAT in assessing burn severity is shown to be up to 0.95, validated by burn skin samples. The PPAT provides a just-in-time quantitative strategy for burn severity evaluation.
1. INTRODUCTION
Burn is a common injury, with estimated 11 million injuries requiring medical attention worldwide each year, 180,000 of which are fatal [1]. Accurate assessment of the burn severity in human skin is critically important for burn technicians and physicians when making treatment decisions [2,3]. Currently, the diagnosis of burn severity is primarily based on visual pattern recognition skills and expertise of the doctors by observing the appearance of burn wound, the refilling of capillaries, and the feeling of touch and acupuncture pain [3–6]. Clinically, according to the depth and scope of the burn tissue in patients, burn is usually divided into I, II, and III degrees [7]. However, the stasis zone of a burn wound is dynamic and may develop and transform into deeper wounds in the early stage after a burn, which may take several days to finalize, leading to difficulties in accurately assessing the initial burn severity by the depth of burn wounds. It is difficult for even experienced doctors to judge the burn severity only based on clinical manifestations, and the accuracy rates in the evaluation of burn grade of clinical visual observation are only 50%–76% [4,8,9]. Currently, biopsy and histology are still the gold standard for diagnosing burn severity, which, however, are invasive diagnostic methods that cannot be evaluated in real time and require an experienced pathologist. Therefore, many researchers have tried to design less subjective diagnostic methods, where various diagnostic techniques for burn severity have emerged. Laser Doppler imaging (LDI) is the method approved by the U.S. Food and Drug Administration to diagnose burn severity, and commercial LDI systems have been used for clinical burn severity diagnosis, which enable non-contact, wide-area measurement [10]. However, this method determines the burn severity according to the blood flow velocity of the wound; however, the blood flow signals do not involve quantitative depth information of burn in principle [9]. Biological tissues are highly scattering media of electromagnetic waves in the optical range of visible and near-infrared (NIR) wavelength spectra [11]. Therefore, optical coherence tomography (OCT), orthogonal polarization spectral imaging (OPSI), and second harmonic imaging of skin are limited in depth [10,12,13]. In addition, terahertz imaging has been widely studied for the evaluation of burns because many molecules have fingerprint spectra in this frequency region [14–16], while its imaging depth is usually limited to a few hundred micrometers owing to the strong terahertz absorption of water molecules in tissue [4,17,18]. For ultrasound (US) imaging, although there is a deep imaging depth, the poor resolution and the lack of specific parameters to evaluate burns limit its application in burn diagnosis [19,20]. The current methods still cannot satisfy non-invasive, high-resolution, deep-penetration imaging to quantitative and accurate assessment of the burn severity.
Photoacoustic (PA) imaging has been a rapidly developing medical imaging technology in recent years [21–27]. Biomolecules absorb photons and undergo non-radiative transitions to produce instantaneous temperature rise, which in turn causes thermal elastic expansion of biological tissues to produce pressure waves and then realizes the conversion of light into ultrasonic signal [28,29]. The three-dimensional (3D) volumetric tomography of biological absorption distribution is reconstructed using the ultrasonic signals received by the ultrasonic transducer (UT). PA imaging naturally inherits the high contrast of optical imaging and the deep-penetration of US imaging and, therefore, possesses great potential to image the depth of burn tissue in the diagnosis of burn [2,9,13,30–32]. PA technology can perform two-dimensional (2D) or 3D imaging of biological tissue and distinguish the depth of burn, and it could clearly define the zone of hyperemia by observing the change of the overall image. However, the PA signal amplitude depends on the absorption coefficient of the tissue and is not directly related to tissue burns. Therefore, it is impossible to distinguish whether the tissue is burned or the specific burn severity by relying only on the PA signal amplitude. As a result, the reported PA imaging lacks standard parameters for quantifying the burn severity [13]. Moreover, it is initially difficult to accurately assess burn depth because burns are dynamic and may develop and transform into deeper wounds, which may take several days to finalize [33]. Therefore, it is not comprehensive to evaluate the burn severity only by the burn depth, which leads to a decrease in the accuracy of using conventional PA imaging to assess the burn severity at the initial moment of burn. There is an urgent need for a quantitative 3D imaging technique that can accurately quantify the burn severity in a timely manner.
The collagen family consists of 28 different proteins, accounting for 25%–35% of the total protein of mammals [34]. In the human body, 80%–90% of collagen exists in the form of collagen fibers. Multiple triple helices tightly pack together to form a collagen fibril, and multiple collagen fibrils assemble to form a larger collagen fiber that is mostly found in fibrous tissues such as skin, tendons, and ligaments. Collagen is especially important in the skin, accounting for 70% to 80% of the weight of dry skin [35]. Collagen in the extracellular matrix of skin tissue exists together with elastin to form a dense network in the whole dermis. The main function of this network is to provide structural support for the epidermis and cause the skin to have structure, elasticity, and firmness. The ordered structure of collagen and elastic fibers makes them show strong dichroism, but this ordered structure is very vulnerable to high temperature damage. Based on this, we used the polarized photoacoustic technique (PPAT) previously reported [36], which is based on the dichroic absorption of collagen fiber, is inherently sensitive to microstructure, and inherits the high resolution and deep penetration of conventional PA imaging. The PPAT immediately and precisely quantifies the change of the collagen fiber alignment anisotropy at the initial moment of burn, and it has a proven ability to accurately assess the grading of burn severity just-in-time in the present paper. This paper demonstrates that the degree of anisotropy (DOA), as an effective parameter to accurately and quantitatively express the degree of tissue order, can quantitatively well-distinguish different burn severity, with a Pearson correlation coefficient of up to 0.95. Combined with the unique ability of PA imaging in 3D volumetric imaging, the PPAT has good prospects for application in the fields of burn diagnosis.
Sign up for Photonics Research TOC. Get the latest issue of Photonics Research delivered right to you!Sign up now
2. METHODS
A. Theoretical Foundations
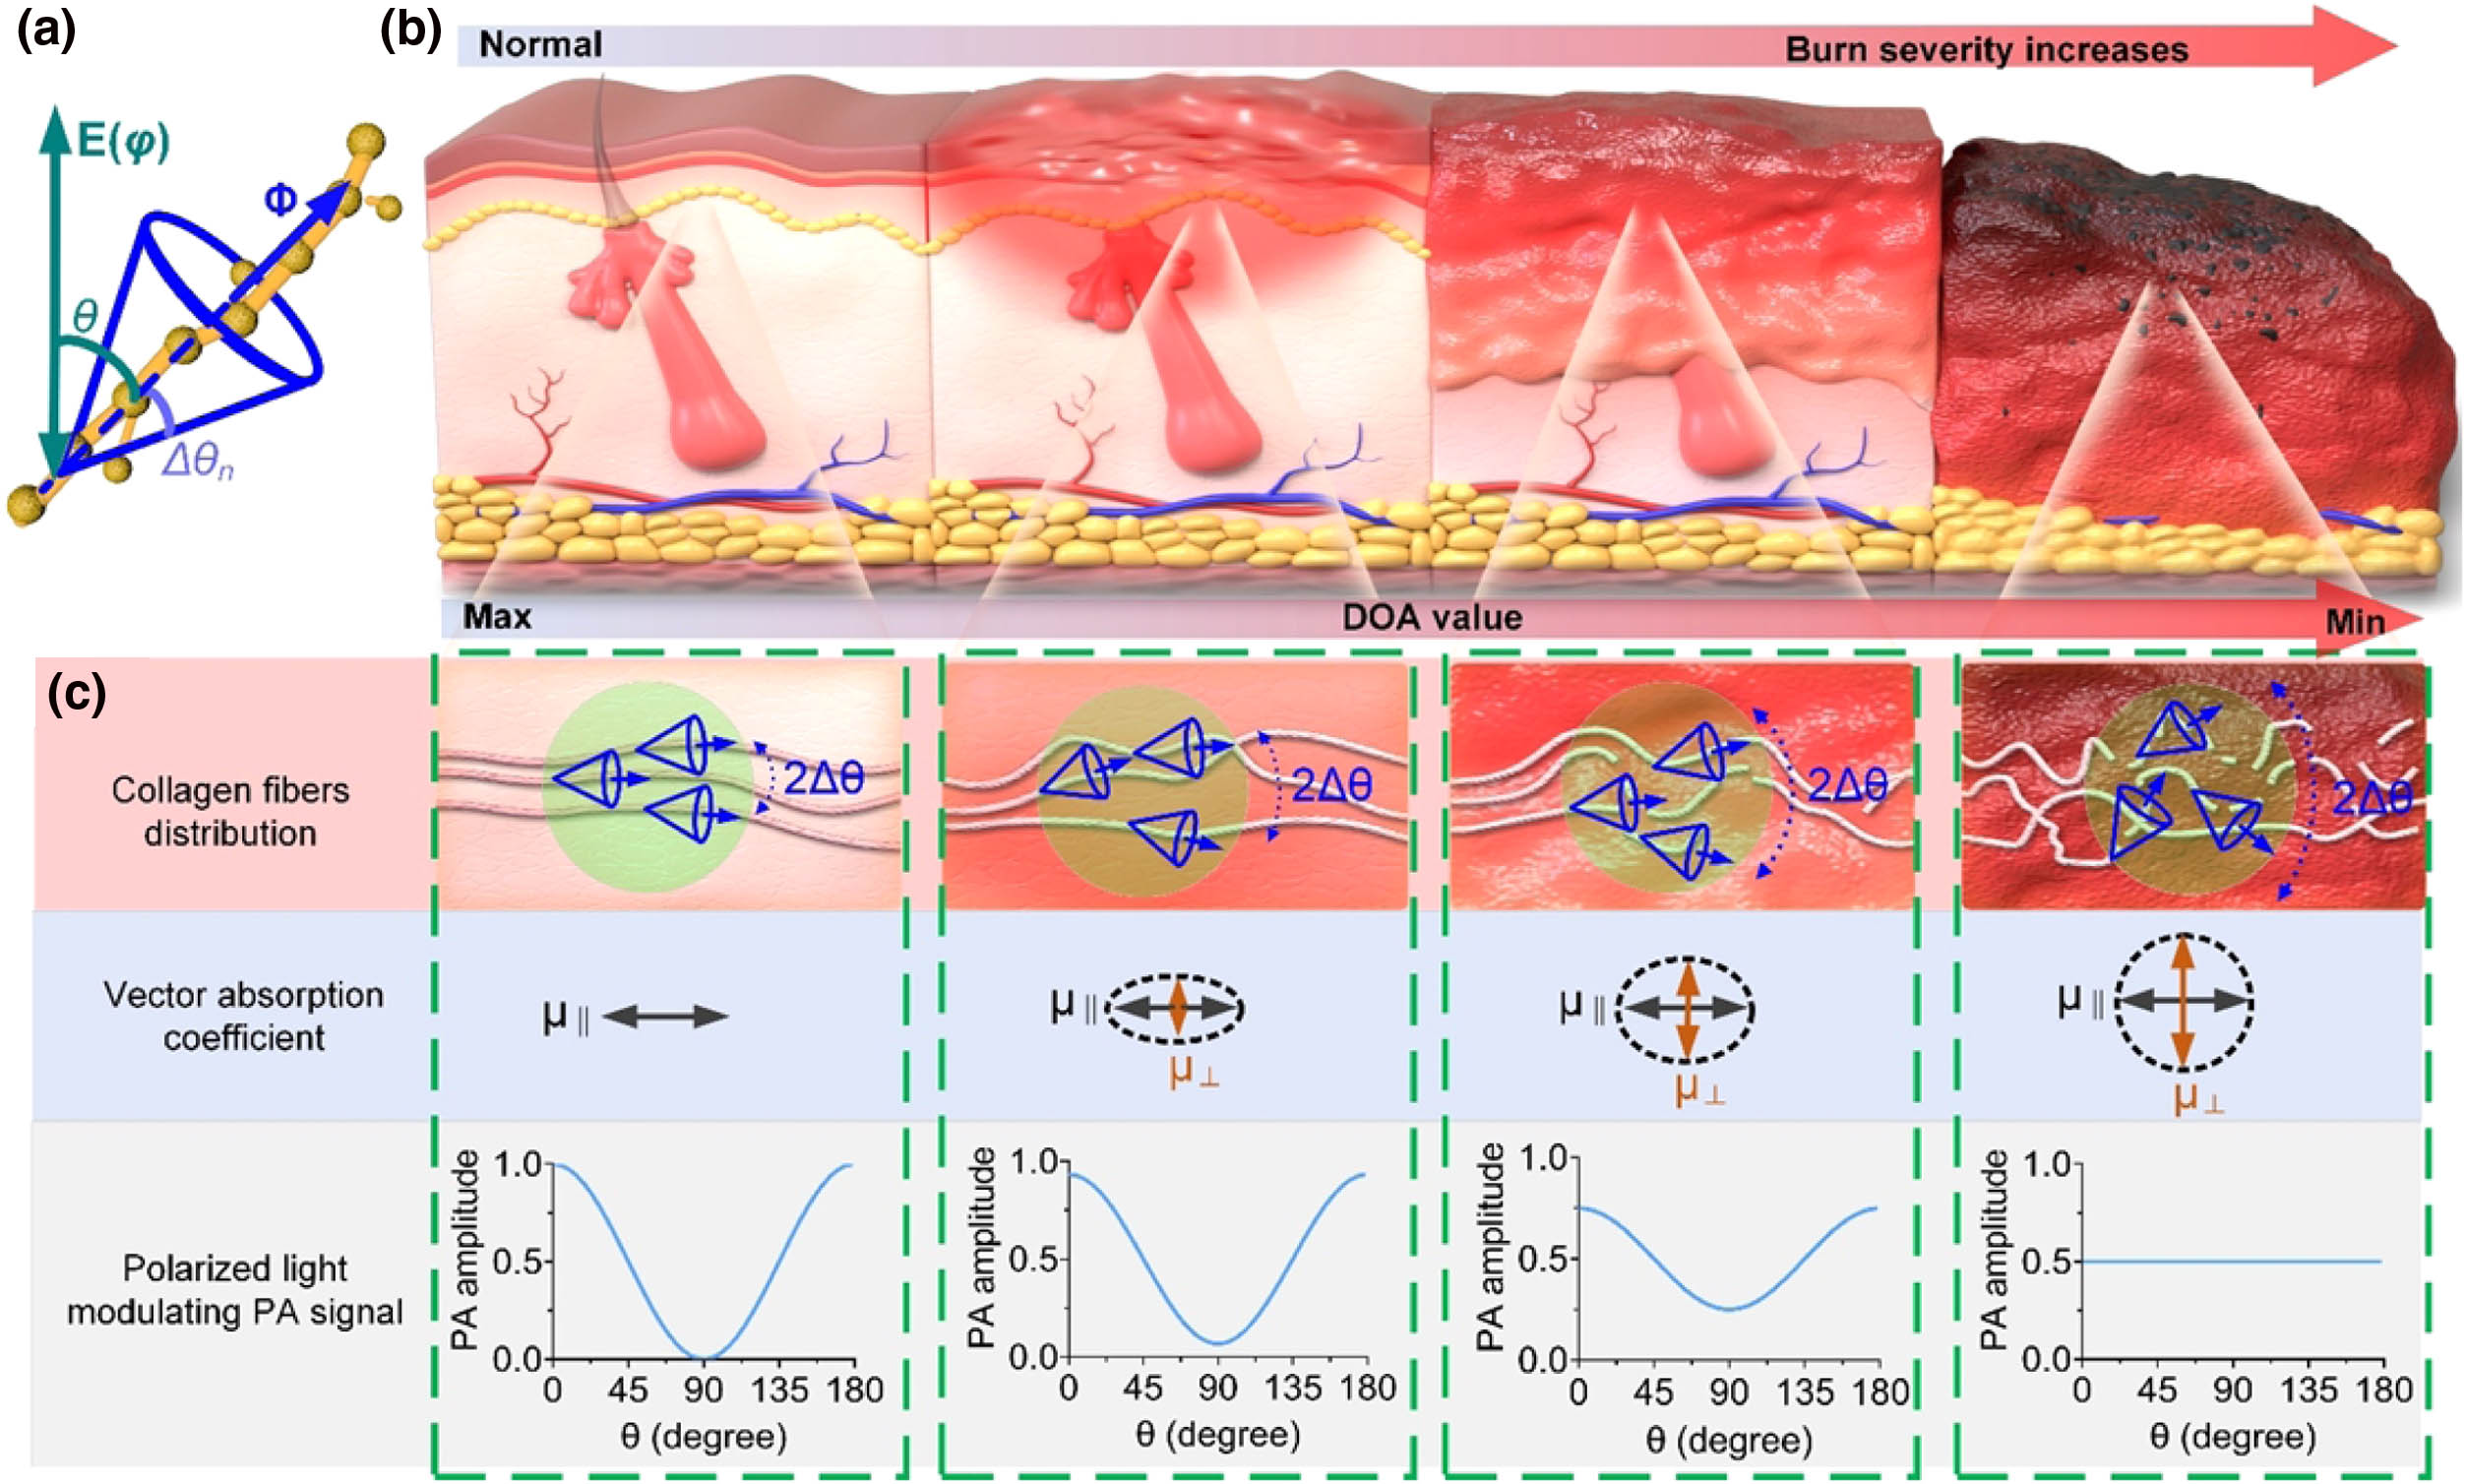
When the linearly polarized light with electric vector orientation interacts with collagen fiber with uniaxial structure, it will show strong vector absorption characteristics. In order to explain the vector absorption characteristics of the absorber more vividly, the vector absorption model is shown in Fig. 1(a), in which the target’s optical axis orientation of a single chromophore and electric vector orientation of incident light are shown. Ignoring the small change of the refractive index of the sample, the absorption coefficient of the collagen fiber can be expressed as [37]
Figure 1.Schematic representation of burn assessment. (a) Schematic diagram of the relationship between the optical axis orientation of single-collagen fiber and the electric vector of incident light. is the angle between and , and is the wobbling angle of . (b) Schematic of burn model. (c) Angular extent of multiple collagen fibers’ average optical axis orientation pointing direction in different burn severity situations. The worse the order of the whole, the greater the value of . Optical absorption of collagen fibers becomes more isotropic as the burn severity increases, and for multiple-collagen fibers, the change of the PA signal amplitude with angle under different conditions.
Absorption probability is the largest when and are parallel and the smallest when and are vertical [38,39]. It is further analyzed that there are multiple collagen fibers within the irradiation range of incident light. In this situation, an average optical absorption coefficient is defined, which is the vector sum of multiple collagen fibers’ optical absorption coefficient , i.e., , and the distribution of has a dispersion angle , as shown in Fig. 1(c). It is noteworthy that the larger the (i.e., the more disordered the structural ordering of the collagen fibers), the weaker the anisotropic absorption. In order to study the anisotropic absorption characteristics of collagen fibers, we define the optical absorption coefficient in parallel and vertical directions as , , respectively,
It can be predicted that the vector absorption characteristics of the collagen fibers will lead to different PA signals generated by the excitation light of different electric vectors. The amplitude of the generated PA signal can be approximately expressed as [36,37]
Here, is the optical fluence of the linearly polarized laser, is the Grüneisen parameter, and is the heat conversion efficiency. As shown in Fig. 1(b), when there are multiple collagen fibers in the excitation region, the dependence of PA amplitude on angle is different due to the different degrees of molecular orientation order. The PA amplitude depends on both the angle and the dispersion angle , and the larger the , the weaker the anisotropic absorption characteristics.
To quantify the anisotropy of the collagen fibers, similarly to the Stokes formalism, the Stokes-PA (SPA) is defined as [36]
The four Stokes parameters (, , , ) describe the absorption intensity and vector absorption difference, where , , , and correspond to PA signal amplitudes excited by linearly polarized lasers with polarizer orientation of 0°, 90°, 45°, and , respectively. and are PA signal amplitudes excited by right-handed circularly polarized light and left-handed circularly polarized light, respectively. The total absorption is represented by PA imaging (PA = IPA), and DOA of the target is defined as [36]
The DOA parameter essentially reflects the difference between the optical absorption coefficient and [Fig. 1(b)]. For the collagen fiber macromolecules in the skin, it is reasonable to consider that the wobbling angle of a single molecule approaches zero during the detection, so the , can be approximately expressed as , , respectively, and the DOA can be expressed as [40]
Equation (6) shows the relationship between and DOA. The larger the is in the range of 0–45°, the smaller the DOA is. The DOA is applicable to all uniaxial molecular targets [36,37], but Eq. (6) is based on the assumption that the swing angle of a single molecule approaches zero, so it is not applicable to small molecules with high activity. In the experiment, four beams of linearly polarized light with an electric vector difference of 45° are used as the excitation source, and the 3D-DOA imaging of the target can be obtained by scanning the same area.
Mastering the change of tissue structure and morphology before and after skin burn is the basis for accurate assessment of differences in burn severity. Collagen is widely distributed in the epidermis and dermis of the skin, accounting for 70%–80% of the dry skin mass [35], and its molecular structure and arrangement are highly sensitive to temperature. Therefore, imaging or detecting changes in the arrangement of collagen fibers can accurately assess the skin burn severity. What is more practical is that, in the complex situation of an initial burn, the burn wound is dynamic and may develop and transform into deeper wounds, which makes it difficult to accurately and quantitatively assess the burn severity. “The anisotropy of collagen fibers in the skin at the initial moment of burn can reflect the degree of heat exposure at the time of burn [41], which indicates that the dynamic development trend of the wound after burn can be predicted by evaluating the anisotropy of collagen fibers. Therefore, by evaluating the changes in the order of collagen fibers, we can accurately and quantitatively evaluate the burn severity of the initial burn tissue.” Figure 1(c) shows schematic illustration of the skin structure of normal, first-degree burn, second-degree burn, and third-degree burn, in which, with the increase of the burn severity, the overall orientation consistency of collagen fibers becomes worse, and the larger the dispersion angle , the smaller the dichroism. Therefore, using the PPAT to detect the degree of collagen fibers anisotropy can accurately quantify the tissue burn severity just-in-time.
B. Experimental Setup
The PPAT imaging system is shown in Fig. 2(a). A pulsed square wave laser (Model DTL-314QT, Pulsed -switched Lasers, Russia) with a 532 nm wavelength, a pulse duration of 10 ns, and a repetition frequency of 1–10 kHz was used as the excitation source. The laser beam travels through a spatial filter, which focuses the beams through a pinhole, thereby smoothing the rough edges of the beam. According to the principle of the spatial filter system ( is the diameter of the pinhole, is the focal length of the L1, and is the radius of the incident light), the L1 focal length of 75 mm, the pinhole diameter of 50 μm, and the L2 focal length of 400 mm were chosen. Then the laser passes through polarizing beam splitter cubes (PBS, Thorlabs, CCM1-PBS251/M), a 2D galvo mirrors system (2D-GS, Sunny S-8107M), a polarizer (Thorlabs, LPVISC100-MP2), a half-wave plate (HWP, Thorlabs, SAHWP05M-700), an objective lens (), and a hollow focused UT in turn to focus on the sample and excite PA signals. The UT is a self-made hollow focusing unit detector, which has a center hole diameter of 3 mm, focus of 8 mm, central frequency of 35 MHz with 97% bandwidth, and sensitivity of −53 dB. The PA signal is detected by the UT and then transmitted to a 30 kHz–600 MHz low noise amplifier (LNA-650, RF bracket), and finally it is collected by a data acquisition card (DAQ, M3i.4110, 100 MHz sampling rate). The optical power stability measurement of the system is shown in Fig. 2(b). Within 30 min of the normal operation of the laser, the laser power fluctuation is 1%. Then the change of optical power at the sample surface position with the direction of the electric vector of light is measured by the rotating polarizer and HWP, as shown in Fig. 2(c). Note that the HWP is removed when the polarizer is rotated. The results of Figs. 2(b) and 2(c) show that polarization stability of the PPAT imaging system meets the requirements of subsequent experiments. The lateral resolution of the PPAT system was measured by imaging the sharp edge of the surgical blade. The edge spread function (ESF) of the PA signal is obtained by scanning the edge of the sharp blade, and the line spread function (LSF) is further obtained by taking the derivative. Finally, the full width at half-maximum (FWHM) of the LSF at the optical focus is measured as the lateral resolution of the system, which is about 4.8 μm. In addition, the lateral resolution near the optical focus measured by -scanning is shown in Fig. 2(d). The axial resolution was measured by 3D imaging of a 20 μm diameter tungsten wire and then taking the FWHM of the cross section PA signal. As shown in Fig. 2(e), the axial resolution of the PPAT system at the acoustic focal point is about 64.5 μm, and the axial resolution changes little after defocusing because the axial resolution of PA imaging is mainly determined by the main frequency of the UT. It takes 15 min for the PPAT system to scan a imaging area.
Figure 2.Fundamental characteristics of the PPAT imaging system. (a) PPAT imaging experimental setup: L1, L2, lenses; PBS, polarizing beam splitter cubes; PD, photodiode; 2D-GS, 2D galvo mirrors system; P, polarizer; HWP, half-wave plate; OB, objective; UT, ultrasonic transducer; AMP, broadband amplifier; DAQ, data acquisition system. (b) Excitation laser power stability; the power fluctuation is 1.0% when the laser operates for 30 min (repetition rate of 1 kHz). (c) Polarization diagrams of laser power obtained by rotating the polarizer and HWP respectively. (d) Lateral resolutions of PPAT imaging system near the light focus. (e) Axial profiles of a 20 μm diameter tungsten by PPAT imaging system. FWHM of the profile is 64.5 μm at acoustic focus.
PPAT imaging was calculated in the time domain, and its maximum signal amplitude projection was computed to construct an image. In the specific experimental process, we change the direction of the electric vector of the incident light by rotating the HWP. For DOA imaging, the 2D-GS or scanning platform was used to scan the sample every time the HWP (22.5°) was rotated, which was repeated 4 times. Five times of signal averaging was applied in the process of signal acquisition. To highlight the DOA imaging, information is shown only at positions where the corresponding PA amplitudes are above a certain threshold value (2 times noise level). The final images were further processed with a median filter to reduce salt-and-pepper noise. Here are the statistical methods. Numerical data were summarized by mean and standard deviation statistics, and to test the significant differences of the groups, the two-tailed, unpaired student’s -test was applied. The asterisks represent the significance levels calculated. The -test indicates significant difference when the -value is less than 0.05, and indicates .
D. Anisotropic Material, Phantom, and Burn Tissue Preparation
Fresh whole blood was obtained from the ear vein of rabbits. In order to prevent coagulation of whole blood, sodium citrate anticoagulant was mixed with whole blood, and the whole blood was used in the experiment within 2 h. Some tissues (bovine Achilles, pig fat, beef, and pig skin) from healthy animals were supplied fresh from the slaughterhouse and transported to laboratory at to retain freshness. In phantom imaging, the raw material for the experiment is an iodine-based polarizer with anisotropic absorption. It is composed of polyvinyl alcohol (PVA) molecules combined with iodine molecules and stretched after slight heating to form a long chain of regularly arranged iodine molecules with good anisotropic absorption. It was then heated by an alcohol lamp to prepare a thermally damaged experimental sample [Fig. 3(a)]. In addition, an aqueous solution of 0.25% intralipid and 3% agar (a transport mean free path to be ) was made as a strong scattering medium to simulate the effect of skin on light, and then the anisotropic absorption polarizer PVA and the isotropic absorption polyvinyl chloride (PVC) material were embedded in the strong scattering medium [Fig. 3(g)]. In order to achieve different degrees of burn severity [2,41], pig skin and rat tissue were prepared by direct exposure to different high-temperature metal of 100°C, 200°C, 250°C, and 300°C for 5 s, and mouse skin tissue was prepared by direct exposure to different high-temperature metal of 100°C, 150°C, and 200°C for 3 s. The temperature control was achieved through use of a temperature-adjustable electric soldering iron. During in vivo imaging, 3-month-old BALB/C mice were depilated on their backs for the first 12 h of the experiment. During the experiment, the excitation energy density was , which was lower than the safety threshold of the laser ( of 532 nm [42]). After imaging, the sample was sampled and fixed in 4% paraformaldehyde within 5 min. One day later, paraffin sections were made, and H&E staining was performed. For H&E staining, tissues were paraffin-embedded, dewaxed, rehydrated, and stained with H&E. The depth of burn was judged by the structural changes of collagen fibers and collagen discoloration in the H&E staining image [43]. All experimental animal procedures were carried out in conformity with a laboratory animal protocol (SCNU-BIP-2022-020) approved by the South China Normal University.
Figure 3.PPAT quantitatively characterizes the change in microstructural anisotropy. (a) Schematic illustration of the fabricated sample. (b)–(d) are polarized PA image, PA image, and DOA image, respectively. The black arrow in (b) indicates the direction of the incident light electric vector. (e) DOA profiles along the dashed lines in (d). (f) Polarization diagrams of PA amplitude at positions 1–4 in (d). (g) Schematic diagram of the sample covering the scattering material (the transport mean free path ): PVA, polyvinyl alcohol (anisotropic absorption); PVC, polyvinyl chloride (isotropic absorption). (h) and (i) are PA image and DOA image corresponding to (g), respectively. (j) Statistics of PA amplitude and DOA values at difference depth in (h) and (i), respectively.
In order to prove that the PPAT can sensitively identify the change in the microstructure of materials by overheating, an experimental sample as shown in Fig. 3(a) was designed. PVA strips exhibit strong anisotropic optical absorption properties before heating. The experimental results are shown in Figs. 3(b)–3(d). Figure 3(b) explains that, with the change of the orientation of the incident light electric vector, the PA signal amplitude changes obviously in the non-heating area, while the PA signal amplitude in the overheating area is almost unchanged. The PA image [Fig. 3(c)] and DOA image [Fig. 3(d)], respectively, reveal the total absorption coefficient and the degree of molecular ordering change after partial heating operation. In Figs. 3(e) and 3(f), further statistics and analysis of the DOA value were carried out. The change of the DOA value [Fig. 3(e)] is shown along the position of the white dotted line in Fig. 3(d), and Fig. 3(f) shows four polarization diagrams of PA amplitude, corresponding to regions 1–4, respectively. These well demonstrate the sensitivity of DOA value to molecular structure and can be used to detect changes in the microscopic molecular structure of substances after superheating.
During the quantitative assessment of tissue anisotropy, the imaging depth of the PPAT is a critical factor that determines the detection efficacy. To demonstrate its depth-resolved imaging capability, a group of tissue-mimicking bulk phantom is designed and imaged in a 3D model. The sample illustration is presented in Fig. 3(g), which is composed of PVA with anisotropic absorption and PVC with isotropic absorption buried in a strong scattering medium. The scattering medium is made of 0.25% intralipid and 3% agar in distilled water, with a reduced scattering coefficient estimated to be about and a transport mean free path that is [34]. Figure 3(h) clearly shows that the PA signal amplitude decreases drastically with depth. Nevertheless, Fig. 3(i) shows that the DOA value is insensitive with the increase of depth. Further, the specific change of DOA value with the increase of depth is obtained in Fig. 3(j). It can be found that DOA almost had no change within a transmission mean free path (), which indicates that the DOA value is an absolute quantitative parameter in the depth range of a transmission mean free path.
B. Anisotropic Characteristics of Collagen Fibers and Whole Blood
To simultaneously observe the changes of blood vessels and collagen fibers in the burn tissue, we selected the excitation wavelength of 532 nm. Blood has a strong absorption of 532 nm light, but will this affect the DOA imaging results of collagen fibers? In order to clarify this point, the experiments of Fig. 4 were conceived and carried out. First, the influence of blood absorption on the polarization state of linearly polarized light was explored. The experimental setup is shown in Fig. 4(a). The polarization diagram [Fig. 4(b)] of transmitted light passing through diluted blood with different thicknesses was measured by rotating the linear polarizer P, and then the change of degree of linear polarization (DLP) [Fig. 4(c)] with the depth of diluted blood was obtained by using , where , , , and correspond to laser intensity with polarizer orientations of 0°, 90°, 45°, and , respectively. The results of Figs. 4(b) and 4(c) show that the depolarization of linearly polarized light is not obvious within 1.0 mm. Further, in Fig. 4(d), the optical absorption spectra of fresh whole blood, purified collagen (collagen from bovine Achilles tendon, type I, CAS-number 9007-34-5), and fresh bovine Achilles tissue were measured. The results showed that the absorption spectra of fresh bovine Achilles tissue and purified collagen were similar, and the whole blood differs from fresh bovine Achilles tissue in 532 nm optical absorption intensity by about 30 times. The stability of PA signals of the whole blood and bovine Achilles (main components are collagen fibers) is shown in Fig. 4(e), and the PA amplitudes are 0.6 and 0.02, respectively. The thickness of the sample (fresh whole blood, purified collagen, and fresh bovine Achilles tissue) to be measured was controlled at 0.2 mm in both spectral and PA measurements. The absorption spectrum of the whole blood was measured by an ultraviolet-visible spectrophotometer (Shimadzu, UV-2600) transmission type integrating sphere, and the absorption of the purified collagen fibers and the fresh bovine Achilles tissue was measured by an ultraviolet-visible spectrophotometer (Shimadzu, UV-2600) reflection-type integrating sphere. Whether the strong absorption background of blood can be removed and the background-free imaging of collagen fibers can be realized depends on the modulation ability of the electric vector of exciting light on the PA signals of blood and collagen fibers. As shown in Fig. 4(f), the electric vector of the excitation light has almost no ability to modulate the PA signal amplitude of blood, but it has a strong ability to modulate the PA signal amplitude of collagen fibers. These results indicate that, even in the presence of a strong blood absorption background, it is still possible to obtain background-free DOA imaging of collagen fibers in a certain depth range by modulating the polarization state of the excitation light. In order to further demonstrate the capacity of the PPAT in bio-applications, a biological sample composed of optically anisotropic fresh bovine Achilles tissue (main components are collagen fibers) and optically isotropic minced beef muscle tissue is imaged. The sample photo is shown in Fig. 4(g). Result of the DOA image in Fig. 4(i) indicates that, compared with the minced beef muscle tissue, obvious DOA image is observed for the tendon tissue with an averaged value of about 0.63 [Fig. 4(j)]. Moreover, compared with the corresponding PA image in Fig. 4(h) much higher selectivity of the DOA image is observed. Figure 4(j) presents the DOA values and the total absorbance along the white line in Figs. 4(h) and 4(i). These results indicate that the presence of a strong hemoglobin absorption background does not affect the high-contrast imaging of collagen fibers by PPAT.
Figure 4.Anisotropic characteristics of collagen fibers and whole blood. (a) The experimental setup was used to measure the depolarization of linearly polarized light after passing through a certain depth of blood. Blood was diluted 1:5 with PBS. (b) Polarization diagrams of linearly polarized light after passing through a certain depth of diluted blood. (c) Variations of laser power and degree of linear polarization (DLP) with the depth of diluted blood increase. (d) Optical absorption spectra of fresh whole blood, purified collagen (collagen from bovine Achilles tendon, type I, CAS-number 9007-34-5), and fresh bovine Achilles tissue, respectively. (e) PA signal amplitude of whole blood and fresh bovine Achilles tissue over time, respectively. (f) PA signal amplitude of whole blood and fresh bovine Achilles tissue varying with the direction of the electric vector, respectively. (g) Sample photograph of bovine Achilles and minced beef. (h) and (i) PA image and DOA image for (g). (j) Signal amplitude profiles along the white dashed lines in (h) and (i).
Figure 5(a) is a photo of the burn-treated pig skin sample, which was caused by the direct contact of the metal at 250°C with the tissue for 5 s. Figure 5(b) shows H&E staining of normal and burned tissues. As indicated in Fig. 5(c), the enhanced absorption of light in the burn area leads to the increase of the PA signal. The decrease of DOA value in the burn area [Fig. 5(d)] indicates that the orderly arrangement of molecules in skin tissue was destroyed by elevated temperature environments. Furthermore, we performed more detailed imaging and analysis of the burn and normal areas using 2D-GS with a step size of 5 μm and a depth of [Figs. 5(e)–5(h)]. Figure 5(e) can distinguish the contour of microvessels formed by fresh tissue residual blood. But the result of imaging the burn area is shown in Fig. 5(g), and there are no microvascular contours, which is due to the destruction of the vascular network caused by the burn. The difference in DOA between normal and burned areas was quantitatively compared [Fig. 5(i)], demonstrating that DOA is a potential quantitative parameter for identifying areas of tissue thermal injury.
Figure 5.PPAT quantitative imaging of fresh ex vivo burn tissue. (a) Burn photos of pig skin tissue. (b) H&E staining of normal and burn tissues. (c), (d) PA image and DOA image, respectively. (e) Three-dimensional (3D) polarized PA imaging of normal tissue area. (f) 3D-DOA imaging corresponding to (e). (g) 3D-polarized PA imaging of burn tissue area. (h) 3D-DOA imaging corresponding to (g). (i) Statistical results of DOA average values in (f) normal and (h) burn areas.
The change of tissues with different burn severity was quantitatively characterized by the PPAT, as shown in Fig. 6. The photo of the burn-treated pig skin sample is shown in Fig. 6(a), in which three of the burn areas were caused by the direct contact with the metal at different temperatures (200°C, 250°C, 300°C) for 5 s. As indicated in Figs. 6(b)–6(f), the enhanced optical absorption in the burn areas leads to the increase of PA signal [Fig. 6(b)], and the decrease of DOA value in the burn areas [Fig. 6(c)] indicates that the orderly arrangement of collagen fibers in skin tissue was destroyed by elevated temperature environments. For Fig. 6(b), in order to highlight the burn area, we perform threshold processing to display the PA signal with more than 2 times the background noise; then, the smoothing filter runs five iterations, and the median filter runs five iterations. In addition, in Figs. 6(e) and 6(f), PA imaging and DOA imaging of the section at different depths are further presented, respectively, and the statistical analysis [Fig. 6(h)] of PA amplitude and DOA value with depth along white dashed line in areas 1–3 is carried out. Analyses of Fig. 6(h) allowed us to reveal that the amplitude of the PA signal increases and the position where PA signal peak appears also becomes deeper with the deepening of burn severity. This is because the burn causes pigment or blood to accumulate at the burn boundary, and it can be considered that the peak of the PA amplitude with depth corresponds to the depth of the burn, which is consistent with the results of PA diagnosis of burns reported before [9,31]. Furthermore, there was a linear correlation between the depth of PA signal peak and the burn depth obtained by H&E staining [Fig. 6(g)], and the Pearson correlation coefficient is 0.89 [Fig. 6(i)].
Figure 6.PPAT quantitative imaging of burn tissue. (a) Burn photo of pig skin tissue. (b)–(d) PA image, DOA image, and overlay of PA image and DOA image at cross section along the white dashed line in (a), respectively. (e), (f) PA and DOA images at different imaging depths, respectively. (g) H&E staining of the section corresponding to the position of the white dashed line in (a). (h) Statistical diagrams of PA amplitude and DOA value with depth along the white dashed line in the burn areas 1, 2, and 3 of (a), respectively. (i) Linear fitting of the burn depth identified from the PA signal peak and the depth identified from the H&E staining, linear fitting of the burn depth identified from the DOA imaging, and depth identified from the H&E staining. is the Pearson correlation coefficient. (j) Change of the burn area identified by PA imaging with the depth of burn (it is considered that the amplitude of photoacoustic signal in the burn area is more than 5 times greater than that in the normal area). (k) Change of burn area identified by DOA imaging with the depth of burn (areas with DOA values less than 0.62 are burn areas).
Alternatively, Fig. 6(f) demonstrates that the DOA value decreases with the increase of the burn severity at the same depth, which is consistent with the fact that the ordering degree of collagen fiber arrangement decreases with the increase of temperature, and the DOA values become larger with the depth increase in the same burn area, which indicates that the heat fluence decreases with increasing depth, resulting in less disruption of ordered arrangement of collagen fibers. According to H&E staining, the damage degree of tissues with different depths was determined, and it was further stipulated that DOA values between 0 and 0.21 represented severe tissue damage, between 0.21 and 0.62 represented moderate tissue damage, and between 0.62 and 1 represented normal tissue. According to the value of DOA, more accurate analysis of the damage degree of tissues at different depths can be achieved. Then the corresponding depth of DOA value equal to 0.62 is linearly correlated with the burn depth obtained by H&E staining, and the Pearson correlation coefficient is 0.95 [Fig. 6(i)]. Figures 6(j) and 6(k), respectively, show the change of the burn area with the burn depth obtained by using the PA signal amplitude threshold (greater than 5 times of the average signal in the normal area) and the DOA threshold (less than 0.62). Combined with the depth results of H&E staining, the DOA value can identify the burn area accurately. The PPAT can characterize the contour of the burned tissue area by PA imaging, with DOA parameters, which can quantitatively characterize the conformational change of collagen fibers in the burned tissue, to precisely assess the burn severity of the tissue.
D. In vivo Imaging of Burn Tissue
Finally, we scalded an area on the back of living mouse (direct contact with 200°C metal for 3 s), as shown in Fig. 7(a), and then it was immediately imaged by the PPAT. The results of imaging are shown in Figs. 7(b)–7(d). The PA image [Fig. 7(b)] can well distinguish the boundary of the burn area by the change in the vascular network. However, it is worth noting that the PA signal is not directly related to the burn severity, as shown in Fig. 7(d), and a single section of the PA image does not distinguish well between burn areas and normal areas at the initial moment of the burn, but DOA imaging can well distinguish the burn area from the normal area. Finally, in the overlay of PA and DOA imaging [Fig. 7(d)], the severity of the burn area and the distribution of nearby blood vessels can be judged simultaneously. In Fig. 7(e), the differences of DOA values between burn areas and normal areas were statistically analyzed. Estimations of the DOA value yield statistically significant differences for the burn area and normal area. The DOA values quantify the DOA of normal skin tissue and burn skin tissue, proving that the DOA value can quantify the burn severity just-in-time. Figure 7(f) shows H&E staining images of a pathological section corresponding to Fig. 7(d), in which the arrangement of collagen fibers becomes more disordered in the burned area than in the normal area. Through the experiment in Fig. 7, it is proved that PPAT can combine PA imaging, which can characterize the hyperemia area and DOA imaging, which can quantitatively calibrate the burn severity to accurately identify the burn severity at the initial time of live burn.
Figure 7.In vivo imaging of burn tissue. (a) Sample photo. (b), (c) 3D-PA image and overlay of PA and DOA image, respectively. (d) PA imaging and overlay of PA and DOA imaging of section corresponding to (c) 1–4 positions, respectively. (e) Box plot result of DOA values of (d). For all boxes, the central line represents the median, and the square represents the mean. , not significant, . (f) Cross-sectional histological images (H&E staining) of the positions 1–4.
In order to confirm that the DOA value at the initial time of burn can reflect the dynamic development of burn wound, we designed the experiment of Fig. 8. Three rats were directly exposed to different high temperatures (100°C, 150°C, and 200°C) for 5 s, and then PPAT imaging was performed immediately to obtain DOA imaging results. After that, PA imaging was performed every 5 h to detect the depth and area changes of the burn wounds. The results are shown in Figs. 8(a)–8(c). The change in wound area over time was fitted for three rats [Fig. 8(d)], and the results showed that the rate of wound expansion was positively correlated with the temperature of the burn. Finally, the relationship between the DOA value and wound change rate was fitted. Pearson correlation coefficient , indicating that the DOA value at the initial burn time can better predict the dynamic development of burn wounds.
Figure 8.Anisotropy of collagen fibers in the early stage of burn can predict the dynamic changes of the wound after burn. (a)–(c) are the results of DOA and PA imaging at different times after the dorsal skin of three rats was exposed to different high temperatures (100°C, 150°C, and 200°C) for 5 s; (d) changes in burn area over time in three rats; (e) fit between the mean value of DOA of the burn area at the time of initial burn and the wound change rate, where Pearson correlation coefficient .
In this study, a PPAT quantifying the burn severity is proposed, which makes up for the defect that the conventional PA imaging cannot accurately and quantitatively characterize the burn severity at the initial time in vivo. In the detection of thermal injury, the PPAT can directly perform label-free and 3D volume imaging, and it can accurately and quantitatively identify the burn severity just-in-time. We have verified the ability of parameter DOA to quantitatively characterize the burn severity by using imitation burn experiment, as well as biological tissue in vitro and in vivo tissue burn experiments.
The focus of this paper is to prove that the PPAT can quantify and timely detect the burn severity, but there is still a long way to go for clinical practice. In the future, the development of the PPAT should be combined with non-contact all-optical PA detection [44] to avoid secondary injury caused by the contact wound, especially with the laser Doppler technology already used in clinic, which can realize non-contact detection of the PA signal and quantitative diagnosis of burn severity [45]. In addition, an optical fiber delay line [46] can be used to realize one-time scanning to obtain multiple groups of vector PA signals and to avoid the influence of motor dislocation and respiratory oscillation. Considering the thickness of human skin [4,47], in order to improve the imaging depth, the future development of the PPAT can choose an NIR absorption peak wavelength of collagen fibers (980 nm or 1200 nm) to quantitatively image the anisotropy of collagen fibers for diagnosing the human’s burn severity. Moreover, the proposed method can also be used for evaluating “micro-burn” caused by laser treatment for depigmentation such as tattoo removal [48], in view of the fact that collagen fiber disruption is also an apparent characteristic during the process. Altogether, this work introduces a new application field of the PPAT, which can reconstruct the microstructure of biological tissue through anisotropic absorption of collagen fibers, proving that it can accurately and quantitatively identify the burn severity at the initial time in vivo and revealing the great potential of the PPAT to characterize skin diseases.
[17] P. Tewari, Z. D. Taylor, D. Bennett, R. S. Singh, M. O. Culjat, C. P. Kealey, J. P. Hubschman, S. White, A. Cochran, E. R. Brown, W. S. Grundfest. Terahertz imaging of biological tissues. Medicine Meets Virtual Reality 18, 653-657(2011).