• Photonics Research
  • Vol. 11, Issue 6, 917 (2023)
Guoping Lin1、2、*, Jingyi Tian1、2, Tang Sun1、2, Qinghai Song1、2, and Yanne K. Chembo3
Author Affiliations
  • 1Ministry of Industry and Information Technology Key Laboratory of Micro-Nano Optoelectronic Information System, School of Science, Harbin Institute of Technology, Shenzhen 518055, China
  • 2Guangdong Provincial Key Laboratory of Semiconductor Optoelectronic Materials and Intelligent Photonic Systems, Shenzhen 518055, China
  • 3Department of Electrical and Computer Engineering & Institute for Research in Electronics and Applied Physics (IREAP), University of Maryland, College Park, Maryland 20742, USA
  • show less
    DOI: 10.1364/PRJ.484727 Cite this Article Set citation alerts
    Guoping Lin, Jingyi Tian, Tang Sun, Qinghai Song, Yanne K. Chembo. Hundredfold increase of stimulated Brillouin-scattering bandwidth in whispering-gallery mode resonators[J]. Photonics Research, 2023, 11(6): 917 Copy Citation Text show less
    (a) Illustration of the regular backward SBS in a straight path, where the phase velocity of the acoustic wave Va(x) is a constant. (b) Illustration of the backward SBS process along a curve path, where Va(x) is dependent on the orientation of the crystal. (c) Calculated Va of the longitudinal acoustic wave of MgF2 projected in 3D onto the unit sphere by solving the Christoffel equation. (d) Illustration of the oscillatory Va as the acoustic wave is traveling along the circumference of a Z-cut MgF2 disk. (e) Calculated Brillouin shift frequency as a function of the angle ϕ for one round trip corresponding to a path length of L. (f) Calculated Brillouin gain profiles in MgF2 assuming a regular gain bandwidth of 20 MHz along a straight path (black). Over 2.5 GHz broadened Brillouin gain profile (orange) is found for one round trip of the Z-cut MgF2 disk resonator. The upper curve is the broad gain curve magnified by a factor of 20 for clarity.
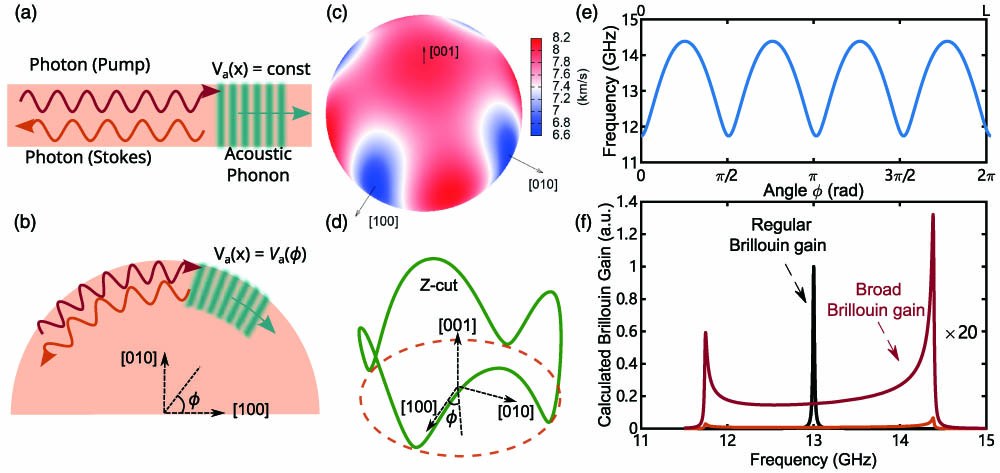
    Fig. 1. (a) Illustration of the regular backward SBS in a straight path, where the phase velocity of the acoustic wave Va(x) is a constant. (b) Illustration of the backward SBS process along a curve path, where Va(x) is dependent on the orientation of the crystal. (c) Calculated Va of the longitudinal acoustic wave of MgF2 projected in 3D onto the unit sphere by solving the Christoffel equation. (d) Illustration of the oscillatory Va as the acoustic wave is traveling along the circumference of a Z-cut MgF2 disk. (e) Calculated Brillouin shift frequency as a function of the angle ϕ for one round trip corresponding to a path length of L. (f) Calculated Brillouin gain profiles in MgF2 assuming a regular gain bandwidth of 20 MHz along a straight path (black). Over 2.5 GHz broadened Brillouin gain profile (orange) is found for one round trip of the Z-cut MgF2 disk resonator. The upper curve is the broad gain curve magnified by a factor of 20 for clarity.
    (a) Schematic of the experimental setp. CW laser, single-frequency tunable pump laser; EDFA, erbium-doped fiber amplifier; VOA, variable optical attenuator; FPC, fiber polarization controller; FOC, fiber optical circulator; PD, photodetector; FRI, fiber ring interferometer; FG, function generator; ESA, electrical spectrum analyzer; OSA, optical spectrum analyzer; OSC, digital oscilloscope; PC, computer; DAQ card, data acquisition card; WGMR, WGM resonator. Inset, a photograph of the fiber coupled WGMR setup. (b) Spectra of two WGMs (i), (ii) showing reflected signals due to Rayleigh scattering. (c) Spectra of WGMs showing the increased reflected signal due to SBS in the mode (ii). (d) Step-by-step data acquisition of the transmitted and reflected signals as the pump frequency is scanned across modes (i) and (ii) from the blue side, covering a spectral range of about 0.52 GHz. The total number of scan steps is 1500. (e) Corresponding optical spectra recorded in each of the 20 steps. (f) Optical spectra for the Step B 35 (left) and the Step B 65 (right) showing the FWM and SBS signals in mode (i) and mode (ii), respectively.
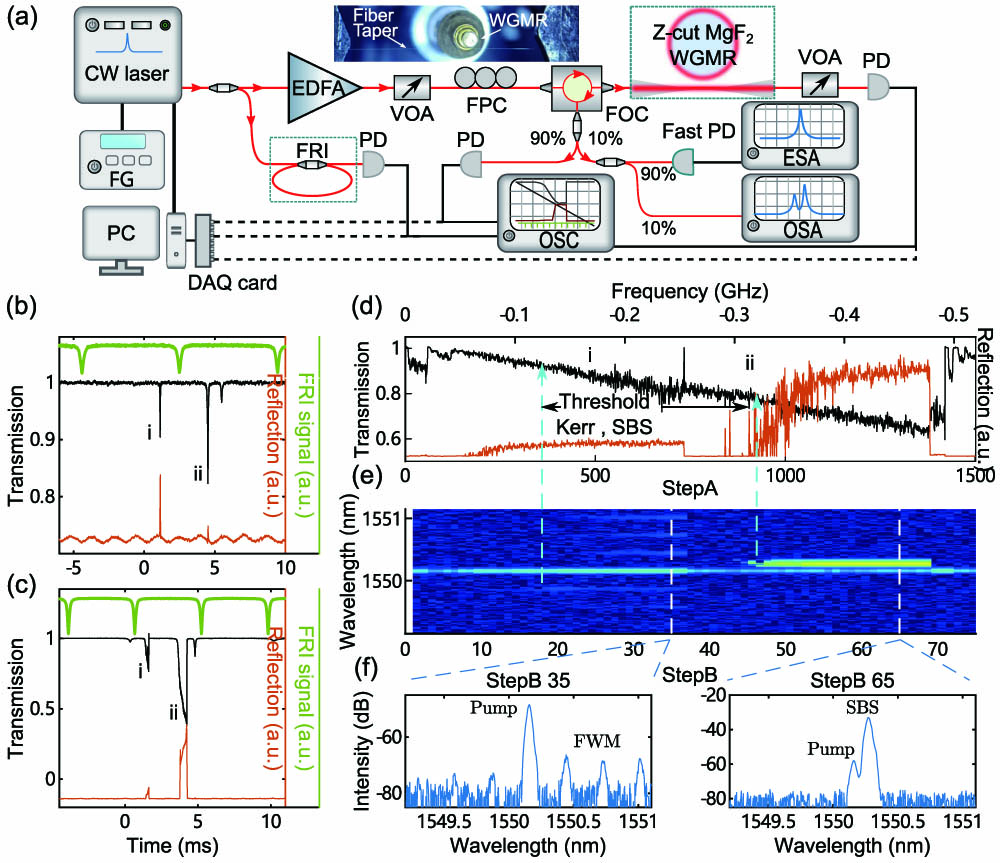
    Fig. 2. (a) Schematic of the experimental setp. CW laser, single-frequency tunable pump laser; EDFA, erbium-doped fiber amplifier; VOA, variable optical attenuator; FPC, fiber polarization controller; FOC, fiber optical circulator; PD, photodetector; FRI, fiber ring interferometer; FG, function generator; ESA, electrical spectrum analyzer; OSA, optical spectrum analyzer; OSC, digital oscilloscope; PC, computer; DAQ card, data acquisition card; WGMR, WGM resonator. Inset, a photograph of the fiber coupled WGMR setup. (b) Spectra of two WGMs (i), (ii) showing reflected signals due to Rayleigh scattering. (c) Spectra of WGMs showing the increased reflected signal due to SBS in the mode (ii). (d) Step-by-step data acquisition of the transmitted and reflected signals as the pump frequency is scanned across modes (i) and (ii) from the blue side, covering a spectral range of about 0.52 GHz. The total number of scan steps is 1500. (e) Corresponding optical spectra recorded in each of the 20 steps. (f) Optical spectra for the Step B 35 (left) and the Step B 65 (right) showing the FWM and SBS signals in mode (i) and mode (ii), respectively.
    (a) Transmission and reflection spectra of WGMs when the pump frequency is scanned from the blue side across a spectral range of 2.82 GHz. Inset, the corresponding spectra when the scan range is reduced to cover mode 1. (b) RF beatnote spectra from ESA when the pump frequency is continuously scanned across one single mode and the Stokes signal of SBS is monitored on OSA. The RBW of ESA is set to 5 MHz for fast capturing the RF beatnotes. (c) The backward optical spectrum when the pump scanning is stopped and the frequency of the pump is self-thermally locked to mode 1. Inset, the corresponding transmission and the reflected signal spectra. (d) Corresponding RF beatnote spectrum of the reflected signal showing a 3 dB linewidth of 10 kHz. Note that the beat of adjacent longitudinal modes corresponding to one FSR of about 37 GHz is out of range for both the fast PD and the handheld ESA.
    Fig. 3. (a) Transmission and reflection spectra of WGMs when the pump frequency is scanned from the blue side across a spectral range of 2.82 GHz. Inset, the corresponding spectra when the scan range is reduced to cover mode 1. (b) RF beatnote spectra from ESA when the pump frequency is continuously scanned across one single mode and the Stokes signal of SBS is monitored on OSA. The RBW of ESA is set to 5 MHz for fast capturing the RF beatnotes. (c) The backward optical spectrum when the pump scanning is stopped and the frequency of the pump is self-thermally locked to mode 1. Inset, the corresponding transmission and the reflected signal spectra. (d) Corresponding RF beatnote spectrum of the reflected signal showing a 3 dB linewidth of 10 kHz. Note that the beat of adjacent longitudinal modes corresponding to one FSR of about 37 GHz is out of range for both the fast PD and the handheld ESA.
    (a) Experimentally observed SBS frequency shift values for Z-cut MgF2 cavity A and cavity B. The spectral windows are around 1550 nm (left) and 1555 nm (right). (b) Histograms of the Brillouin shift obtained from SBS beatnotes for cavity A around 1550 nm and 1555 nm and cavity B around 1550 nm and 1555 nm (from left to right, respectively). (c) Histogram of all the Brillouin shift data and the solid line showing the theoretically calculated backward Brillouin gain profile covering from 11.729 to 14.660 GHz in the spectral window.
    Fig. 4. (a) Experimentally observed SBS frequency shift values for Z-cut MgF2 cavity A and cavity B. The spectral windows are around 1550 nm (left) and 1555 nm (right). (b) Histograms of the Brillouin shift obtained from SBS beatnotes for cavity A around 1550 nm and 1555 nm and cavity B around 1550 nm and 1555 nm (from left to right, respectively). (c) Histogram of all the Brillouin shift data and the solid line showing the theoretically calculated backward Brillouin gain profile covering from 11.729 to 14.660 GHz in the spectral window.
    Brillouin–Kerr frequency comb generation in MgF2. (a) Optical spectrum in the forward direction showing the position of the pump and reflected Brillouin Stokes. (b) Optical spectrum in the backward direction. The insets provide zoom-in spectra for the spectral window around the pump and the Stokes.
    Fig. 5. Brillouin–Kerr frequency comb generation in MgF2. (a) Optical spectrum in the forward direction showing the position of the pump and reflected Brillouin Stokes. (b) Optical spectrum in the backward direction. The insets provide zoom-in spectra for the spectral window around the pump and the Stokes.
    Guoping Lin, Jingyi Tian, Tang Sun, Qinghai Song, Yanne K. Chembo. Hundredfold increase of stimulated Brillouin-scattering bandwidth in whispering-gallery mode resonators[J]. Photonics Research, 2023, 11(6): 917
    Download Citation