• Photonics Research
  • Vol. 9, Issue 7, 1397 (2021)
Francesco Arcadio1, Luigi Zeni1, Domenico Montemurro2, Caterina Eramo1, Stefania Di Ronza1, Chiara Perri1, Girolamo D’Agostino3, Guido Chiaretti3, Giovanni Porto3, and Nunzio Cennamo1、*
Author Affiliations
  • 1Department of Engineering, University of Campania Luigi Vanvitelli, Aversa 81031, Italy
  • 2Department of Physics E. Pancini, University of Naples Federico II, Naples 80126, Italy
  • 3Moresense Srl, Filarete Foundation, Milan 20139, Italy
  • show less
    DOI: 10.1364/PRJ.424006 Cite this Article Set citation alerts
    Francesco Arcadio, Luigi Zeni, Domenico Montemurro, Caterina Eramo, Stefania Di Ronza, Chiara Perri, Girolamo D’Agostino, Guido Chiaretti, Giovanni Porto, Nunzio Cennamo. Biochemical sensing exploiting plasmonic sensors based on gold nanogratings and polymer optical fibers[J]. Photonics Research, 2021, 9(7): 1397 Copy Citation Text show less
    Schematic cross section of the studied plasmonic GNG-based sensors.
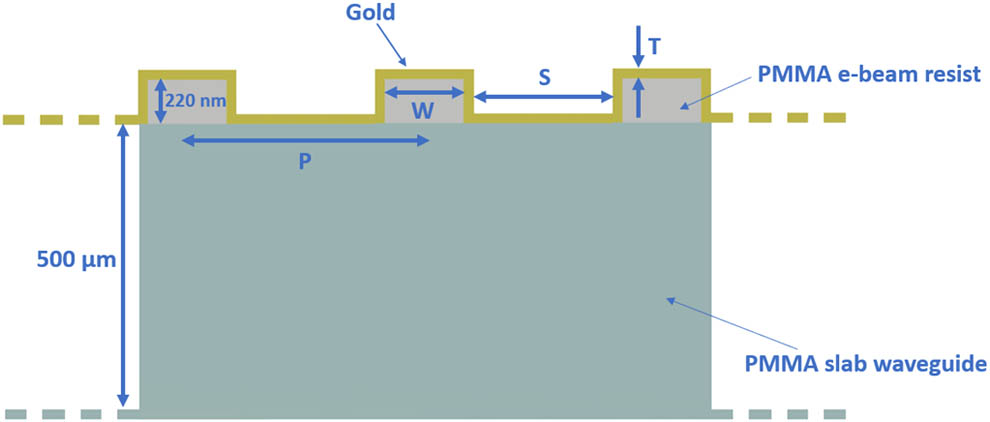
    Fig. 1. Schematic cross section of the studied plasmonic GNG-based sensors.
    Plasmonic spectra obtained with water (n=1.332) as surrounding medium for three different period P values: 500 nm, 1 μm, and 1.5 μm.
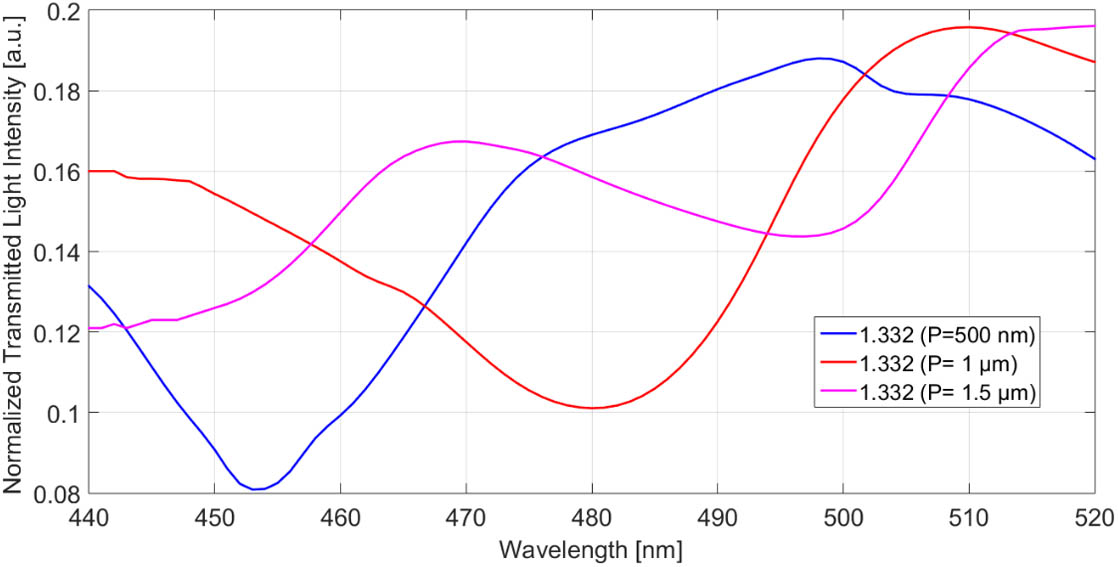
    Fig. 2. Plasmonic spectra obtained with water (n=1.332) as surrounding medium for three different period P values: 500 nm, 1 μm, and 1.5 μm.
    Numerical results for three configurations with different P values (500 nm, 1 μm, and 1.5 μm) at a fixed W=400 nm and T=40 nm. (a) Absolute value of the variations in resonance wavelength (|Δλ|) calculated with respect to the water (n=1.332) versus the refractive index along with the linear fitting of the simulated data. (b) Full width at half maximum (FWHM) versus refractive index.
    Fig. 3. Numerical results for three configurations with different P values (500 nm, 1 μm, and 1.5 μm) at a fixed W=400  nm and T=40  nm. (a) Absolute value of the variations in resonance wavelength (|Δλ|) calculated with respect to the water (n=1.332) versus the refractive index along with the linear fitting of the simulated data. (b) Full width at half maximum (FWHM) versus refractive index.
    Numerical results for three configurations with different W values (W=200 nm, W=400 nm, and W=600 nm) at a fixed P=1 μm and T=40 nm. Absolute value of the variations in resonance wavelength (|Δλ|) calculated with respect to the water (n=1.332) versus the refractive index along with the linear fitting of the simulated data.
    Fig. 4. Numerical results for three configurations with different W values (W=200  nm, W=400  nm, and W=600  nm) at a fixed P=1  μm and T=40  nm. Absolute value of the variations in resonance wavelength (|Δλ|) calculated with respect to the water (n=1.332) versus the refractive index along with the linear fitting of the simulated data.
    Numerical results for three configurations with different W values (W=200 nm, W=400 nm, and W=600 nm) at a fixed S = 600 nm and T=40 nm. Absolute value of the variations in resonance wavelength (|Δλ|) calculated with respect to the water (n=1.332) versus the refractive index along with the linear fitting of the simulated data.
    Fig. 5. Numerical results for three configurations with different W values (W=200  nm, W=400  nm, and W=600  nm) at a fixed S = 600 nm and T=40  nm. Absolute value of the variations in resonance wavelength (|Δλ|) calculated with respect to the water (n=1.332) versus the refractive index along with the linear fitting of the simulated data.
    Simulated absolute value of the resonance wavelength variation in the refractive index range between 1.332 and 1.363, for different values of gold thickness (ranging from 30 to 60 nm), deposited on the optimized nanograting structure.
    Fig. 6. Simulated absolute value of the resonance wavelength variation in the refractive index range between 1.332 and 1.363, for different values of gold thickness (ranging from 30 to 60 nm), deposited on the optimized nanograting structure.
    Outline of the plasmonic sensor fabrication.
    Fig. 7. Outline of the plasmonic sensor fabrication.
    (a) Outline of the specially designed transmission-based experimental setup. (b) Zoom on the specially designed 3D-printed metallic (AISI 316 steel) holder with the PMMA chips and POFs.
    Fig. 8. (a) Outline of the specially designed transmission-based experimental setup. (b) Zoom on the specially designed 3D-printed metallic (AISI 316 steel) holder with the PMMA chips and POFs.
    SEM image of the fabricated gold nanograting.
    Fig. 9. SEM image of the fabricated gold nanograting.
    (a) Plasmonic spectra obtained at different refractive indices. (b) Absolute value of the resonance wavelength shift (|Δλ|) with respect to water (n=1.332) and linear fitting of the experimental values with error bars.
    Fig. 10. (a) Plasmonic spectra obtained at different refractive indices. (b) Absolute value of the resonance wavelength shift (|Δλ|) with respect to water (n=1.332) and linear fitting of the experimental values with error bars.
    (a) SEM image and (b) normalized plasmonic spectra at varying external refractive index relative to non-periodic configuration 1.
    Fig. 11. (a) SEM image and (b) normalized plasmonic spectra at varying external refractive index relative to non-periodic configuration 1.
    (a) SEM image and (b) normalized plasmonic spectra at varying external refractive index relative to non-periodic configuration 2.
    Fig. 12. (a) SEM image and (b) normalized plasmonic spectra at varying external refractive index relative to non-periodic configuration 2.
    (a) SEM image and (b) normalized plasmonic spectra at varying of the external refractive index relative to periodic configuration 1.
    Fig. 13. (a) SEM image and (b) normalized plasmonic spectra at varying of the external refractive index relative to periodic configuration 1.
    (a) SEM image and (b) normalized plasmonic spectra at varying external refractive index relative to periodic configuration 2.
    Fig. 14. (a) SEM image and (b) normalized plasmonic spectra at varying external refractive index relative to periodic configuration 2.
    Absolute value of the variation in resonance wavelength (|Δλ|) calculated with respect to water (n=1.332) for the optimized and non-optimized configurations.
    Fig. 15. Absolute value of the variation in resonance wavelength (|Δλ|) calculated with respect to water (n=1.332) for the optimized and non-optimized configurations.
    (a) Outline of the functionalized surface and (b) plasmonic spectra obtained at different BSA protein concentrations. Inset: zoom-in of the resonance region.
    Fig. 16. (a) Outline of the functionalized surface and (b) plasmonic spectra obtained at different BSA protein concentrations. Inset: zoom-in of the resonance region.
    Absolute value of resonance wavelength variation (|Δλ|), with respect to the blank, versus the concentration of BSA protein, with the Langmuir fitting of the experimental values and error bars, in semi-log scale.
    Fig. 17. Absolute value of resonance wavelength variation (|Δλ|), with respect to the blank, versus the concentration of BSA protein, with the Langmuir fitting of the experimental values and error bars, in semi-log scale.
    Plasmonic Sensor TechnologyBulk Sensitivity [nm/RIU]Reference
    Gold nanocone arrays on glass substrate417D. Kawasaki et al. [41]
    Gold nanohole arrays481H. Im et al. [45]
    Periodic gold nanorings on quartz substrate544S. Wang et al. [60]
    Nanocavities array on glass substrate360Cattoni et al. [61]
    Gold nanograting on PMMA slab waveguide547This work
    Table 1. Bulk Sensitivity of Several Plasmonic Sensors
    Δλmax [nm]K [nM]Statistics
    Red. Chi-SqrAdj R-Square
    3.31±0.023.04±0.670.0090.99
    Table 2. Parameters of the Langmuir Fitting (GNG-MIP-Based Platform)
    ConfigurationLODBSA Detection RangeReference
    SPR-POF-MIP0.37 μM0.37–6.5 μM[57]
    Fluorescence sensor10 nM0.01–2 μM[62]
    Aggregation-induced emission biosensor coupled with graphene-oxide0.4 μM0.4–1.5 μM[63]
    SPRMoS2 optical fiber4.36 nM4.36–750 nM[64]
    LSPR based on bimetallic nanoparticles0.15 pM150–15,000 pM[65]
    GNG-MIP-based37 pM0.037–100 nMThis work
    Table 3. Comparative Analysis among Several Sensor Configurations for Selective BSA Detection
    Francesco Arcadio, Luigi Zeni, Domenico Montemurro, Caterina Eramo, Stefania Di Ronza, Chiara Perri, Girolamo D’Agostino, Guido Chiaretti, Giovanni Porto, Nunzio Cennamo. Biochemical sensing exploiting plasmonic sensors based on gold nanogratings and polymer optical fibers[J]. Photonics Research, 2021, 9(7): 1397
    Download Citation