
Francesco Arcadio, Luigi Zeni, Domenico Montemurro, Caterina Eramo, Stefania Di Ronza, Chiara Perri, Girolamo D’Agostino, Guido Chiaretti, Giovanni Porto, Nunzio Cennamo, "Biochemical sensing exploiting plasmonic sensors based on gold nanogratings and polymer optical fibers," Photonics Res. 9, 1397 (2021)
- Photonics Research
- Vol. 9, Issue 7, 1397 (2021)
Abstract
1. INTRODUCTION
The development of innovative sensors benefiting from phenomena such as surface plasmon resonance (SPR) and localized SPR (LSPR) has been continuously spreading in the scientific community in the last decades [1–7]. Plasmons are coherent oscillations of free electrons propagating at the interface between a dielectric medium and a thin metal film (nano-film); in particular, SPR is generated from continuous metallic nano-films, while LSPR can be excited, for instance, on metallic nanoparticles or nanostructures so inducing a strong localized enhancement of the electromagnetic field. Both plasmonic techniques have largely demonstrated their appropriateness for a wide range of application fields, such as biochemical species detection, where high sensitivity and real-time, label-free detection are strictly required [8–18].
Recently, biosensors based on plasmonic platforms have been realized in several types of optical fibers (silica, plastic, or specialty) [19–21]. These kinds of sensors may reduce the dimensions and price of the entire sensor system. Generally, optical fiber sensors are defined as intrinsic or extrinsic, according to the interaction of the fiber with the analyzed medium (intrinsic) or its use as a mere waveguide allowing the launch of light to the sensing region and its collection (extrinsic) [22].
Recent developments in nanostructure manufacturing technologies [23,24], such as electron-beam and ion-beam lithography, paved the way to novel sensing approaches and applications [25–29]. Moreover, optical biosensors based on plasmonic nanostructures have prompted extensive attention and have been largely investigated in the last years [30–33]. The performances of these kinds of sensors are strongly dependent on the size, shape, and periodicity of metallic nanostructures [3]. In particular, with a special focus on nanograting structures, both theoretical and experimental analysis can be found in literature [34–39].
Sign up for Photonics Research TOC. Get the latest issue of Photonics Research delivered right to you!Sign up now
In general, to test these sensing platforms, two kinds of experimental configurations can be deployed, one reflection based and the other one transmission based. The choice is typically dependent on experimental evaluations such as substrate transparency and instrument setup. For instance, Gao et al. [40] recently presented a plasmonic platform based on two-dimensional gold nanohole arrays fabricated by a nanoimprint lithography method. In this case, they implemented a laboratory-built reflection-based system to tune the performances and to test their sensor. Although these kinds of setups are usually quite simple and cost effective, the main issue is related to the “dropping” approaches used to allow interaction between the sensor’s surface and the liquid sample containing the analyte of interest [40–43].
On the contrary, Chamanzar et al. [44] developed a hybrid plasmonic–photonic LSPR sensor, based on a silicon nitride ridge waveguide integrated with gold nanorods on top. To test their sensors, they used a transmission-based experimental setup coupled with a microfluidic system. The latter is widely used in these kinds of setups [44–47], making it possible to overcome the aforementioned problem even if the downside is represented by a more complex experimental measurement system.
In this work, we have designed, developed, and tested plasmonic sensor configurations based on gold nanogratings (GNGs), fabricated by electron-beam lithography (EBL) on the surface of a polymethylmethacrylate (PMMA) substrate and monitored by a custom setup, realized with polymer optical fibers (POFs) and a 3D-printed holder. In other words, a novel transmission extrinsic optical fiber sensor is presented. This sensing approach could be used in those biochemical applications where a small size area to functionalize is required, together with higher sensitivity.
The structure parameters of the proposed plasmonic sensor chip have been here optimized by performing numerical simulations to achieve the best configuration in terms of sensor performances. Subsequently, several plasmonic sensor chips have been fabricated and experimentally tested. More specifically, the realized sensor configurations have been optically characterized by different water–glycerin mixtures. After these preliminary experimental tests, a biomimetic receptor, a molecularly imprinted polymer (MIP), specific for bovine serum albumin (BSA), was deposited upon the best plasmonic sensor configuration to test its biochemical sensing capabilities. The binding tests were carried out and described. Finally, a comparative analysis with other BSA sensors is reported.
2. NUMERICAL ANALYSIS
The sensing method here presented is based on a plasmonic phenomenon. In general, the dispersion relation that links the surface plasmons (SPs) wavenumber
In the study cases herein reported, the periodicity of the grating is comparable with the operating wavelength, and so hybrid modes can be excited. In particular, when the LSP resonance condition is satisfied as well, the SPs dispersion relation is altered [52]. In general, to describe the excitation of LSPs,
For this reason, to optimize the optical response of the proposed plasmonic sensor, we have performed numerical simulations by using COMSOL Multiphysics software, which is based on the finite element method (FEM). A schematic cross section of the plasmonic sensor GNG-based structure is described in Fig. 1, where the parameters of interest are reported (
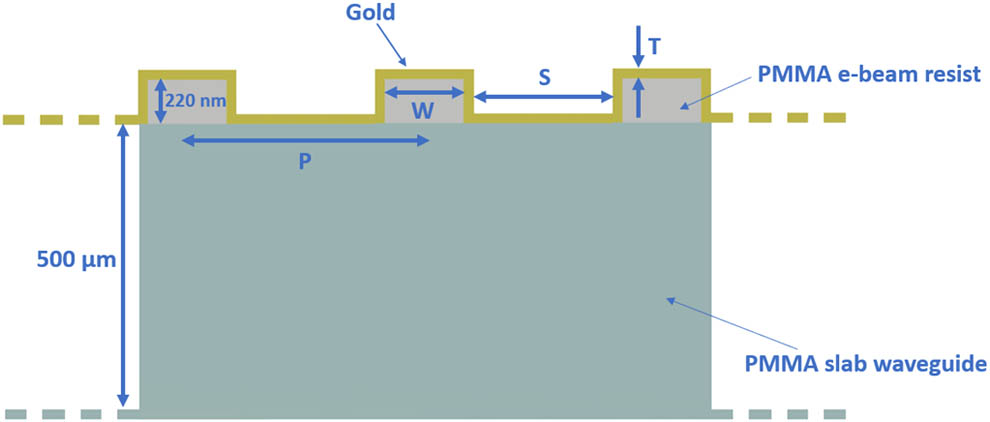
Figure 1.Schematic cross section of the studied plasmonic GNG-based sensors.
For the studied sensors, to establish the best configuration, we have evaluated the bulk sensitivity
A. Numerical Results Relative to Configurations with Different Periods and Fixed Width
In periodic nanogratings, the performances are strongly dependent on the period
![]()
Figure 2.Plasmonic spectra obtained with water (
In particular, the resonance peak depth and the FWHM of the curves change as a function of the considered parameter. As shown in Fig. 2, when the period
Standing these preliminary observations, we have conducted numerical simulations by changing the refractive index of the external medium (the bulk solution) to find the best configuration. In Fig. 3(a), for three values of the period
![]()
Figure 3.Numerical results for three configurations with different
As can be seen in Fig. 3, a decrease in the period
B. Numerical Results Relative to Configurations with Different Widths and Fixed Period
We have then conducted a similar analysis at varying nanostripe widths
![]()
Figure 4.Numerical results for three configurations with different
C. Numerical Results Relative to Configurations with Different Widths and Fixed Spacing
Moreover, we have also determined how the widths of the nanostripes influence the optical response when keeping fixed the mutual spacing
Figure 5 clearly shows that, when keeping
![]()
Figure 5.Numerical results for three configurations with different
D. Numerical Results Relative to the Optimal Configuration with Different Gold Thicknesses
Finally, to demonstrate that in the previous simulations the chosen value of the gold thickness is actually the optimum, we have analyzed the influence of the gold film thickness
![]()
Figure 6.Simulated absolute value of the resonance wavelength variation in the refractive index range between 1.332 and 1.363, for different values of gold thickness (ranging from 30 to 60 nm), deposited on the optimized nanograting structure.
3. SENSOR SYSTEM: PLASMONIC PLATFORMS, SETUP, AND RECEPTOR
A. Plasmonic Platforms
The plasmonic GNG-based sensors fabrication is schematically shown in Fig. 7. The initial sample consists of a
![]()
Figure 7.Outline of the plasmonic sensor fabrication.
B. Experimental Setup and Binding Measurements Protocol
The experimental measurements relative to the plasmonic GNG sensor have been carried out by using a simple and low-cost transmission-based setup, schematically shown in Fig. 8(a). We have used as a white light source a halogen lamp that exhibits an emission range from 360 to 1700 nm (HL-2000-LL, manufactured by Ocean Optics, Dunedin, FL, USA). The light source is connected through a POF optical coupler (50:50) to two POF patches (1 mm total diameter, PMMA core of 980 μm), one illuminating the sensor with a nanograting and the other illuminating the reference sensor, i.e., a PMMA chip with the same gold film but without the nanograting. Both PMMA chips are kept steady in a specially designed 3D-printed metallic (AISI 316 steel) holder and contained in a specific tank (see Fig. 8). At the output are present two similar POF patches used to collect the transmitted light and send it into two spectrometers that have a detection range from 350 to 1023 nm (FLAME-S-VIS-NIR-ES, manufactured by Ocean Optics, Dunedin, FL, USA). Figure 8(b) shows a detail of the holder adopted to keep both the PMMA chips (with and without a nanograting) in an orthogonal position with respect to the direction of the input/output POFs.
![]()
Figure 8.(a) Outline of the specially designed transmission-based experimental setup. (b) Zoom on the specially designed 3D-printed metallic (AISI 316 steel) holder with the PMMA chips and POFs.
For all the tested configurations, the experimentally measured plasmonic spectra have been obtained by normalizing the transmitted spectra, acquired through the sensor with a nanograting, with respect to the reference sensor.
We have first tested the sensor configurations to obtain the bulk sensitivity (exploiting the water–glycerin mixture) and, for the best configuration, we have also obtained the performances relative to BSA detection (exploiting a specific MIP for selective recognition), in terms of sensitivity at low concentration, limit of detection (LOD), etc.
With particular regards to the binding tests, we have used a standard measurement protocol that can be summarized as follows: first, the holder tank is filled with the analyte solution and is so kept for 10 min to allow interaction between the analyte and the receptor; subsequently, an intermediate washing step is carried out by using Milli-Q water to remove a non-specific binding upon the plasmonic sensor surface; finally, the spectra are acquired with a blank as bulk solution (buffer solution without analyte).
C. Biomimetic Receptor Film
1. Chemicals
Reagents: N,N′-methylene bisacrylamide (BIS) (CAS 110-26-9), Acrylamide (Aam) (CAS 79-06-1), N-tert-butylacrylamide (TBAm) (CAS 107-58-4), 2-hydroxyethyl methacrylate (HEMA) (CAS 868-77-9), ammonium persulfate (APS) (CAS 7727-54-0), N,N,N′,N′-tetramethylethylenediamine (TEMED) (CAS 110-18-9), sodium dodecyl sulfate (SDS) (CAS151-21-3), and phosphate buffer (PB) solution 1.0 M (1 M =1 mol/L) were from Sigma-Aldrich (Darmstadt, Germany) and used without any further purification. All other chemicals were of analytical reagent grade. The solvent was Milli-Q water.
The BSA (CAS 9048-46-8) and trypsin (CAS 9002-07-7) were from Sigma-Aldrich (Darmstadt, Germany).
2. Molecularly Imprinted Polymer for BSA Detection
MIPs are synthetic receptors capable of recognizing molecules or classes of molecules for which they have been synthesized [55,56]. The synthesis involves the use of a template molecule and suitable functional monomers able to coordinate the target molecule by establishing interactions of various kinds (van der Waals, ionic, dipole–dipole, etc.) forming a complex.
Subsequently, the system is fixed by cross-linking, forming a polymer. Following the extraction of the template, the interaction sites are freed and are able to reversibly recognize the analyte of interest.
In the specific case, this synthetic receptor is made to grow on the Au surface forming a nanometric film. In particular, a recently developed MIP synthesis strategy for proteins, under non-denaturing conditions, is exploited [57]. The preparation steps are summarized below.
First, the optical transducer has been suitably modified with an allyl thiol to covalently bind the polymeric receptor to the gold layer. In particular, the gold surface of the transducer was modified by immersing it in a allyl thiol solution (in which volume fractions of allyl thiol, ethanol, and water are 10%, 80%, and 10%, respectively) for 12 h. Subsequently, the platform was washed with Milli-Q water (flushing 3 mL five times). Through this process, a self-assembled monolayer with a terminal allyl group is formed.
Afterwards, the monomer mixture was prepared: Aam, TBAm, and HEMA were added at 1:0.5:0.6 molar ratio, in 15 mM PB pH 7.4. The final concentration of N,N′-methylene BIS in the monomeric mix was 0.19 M. The pre-polymeric mixture was dispersed by sonication (sonic bath model VWR USC200T) for 10 min and bubbled with
4. RESULTS AND DISCUSSION
A. Optical Characterization of the Proposed Plasmonic GNG-Based Sensor
In this section, the best sensor configuration, obtained by numerical results, is realized (as explained in Section 3.A) and experimentally tested. Figure 9 shows a scanning electron microscope (SEM) image of the fabricated nanograting. In particular, the pattern covers an area of
![]()
Figure 9.SEM image of the fabricated gold nanograting.
In a preliminary step, the proposed and developed plasmonic sensor has been optically tested, with the experimental setup reported in Fig. 8, to obtain the bulk sensitivity. The response of the plasmonic sensor, not derivatized with the receptor, has been examined by registering the spectra in air and in different water–glycerin solutions (at different refractive indices). In particular, to carry out experimental measurements, the holder tank has been filled with about 1 mL of different water–glycerin mixtures whose refractive indices (
In Fig. 10(a) are reported the experimentally measured spectra normalized as described in Section 3.B. The resonance wavelength value in the spectrum changes when the refractive index of the solution changes. In particular, when the refractive index increases, the resonance wavelength decreases (blueshift) as well as for some LSPR sensors [58,59]. Moreover, a resonance phenomenon is present also when the air (
![]()
Figure 10.(a) Plasmonic spectra obtained at different refractive indices. (b) Absolute value of the resonance wavelength shift (
To evaluate the performances of the proposed sensor, we have estimated the bulk sensitivity by considering a first-order analysis, similar to the numerical analysis. In fact, by using Eq. (3), this parameter can be approximated by the slope of the linear fitting function presented in Fig. 10(b). In particular, in the refractive index range between 1.332 and 1.353, a bulk sensitivity equal to 547 nm/RIU has been obtained.
Table 1 reports a comparative analysis of bulk sensitivity for several plasmonic sensors presented in literature.
Bulk Sensitivity of Several Plasmonic Sensors
| Plasmonic Sensor Technology | Bulk Sensitivity [nm/RIU] | Reference |
|---|---|---|
| Gold nanocone arrays on glass substrate | 417 | D. Kawasaki et al. [ |
| Gold nanohole arrays | 481 | H. Im et al. [ |
| Periodic gold nanorings on quartz substrate | 544 | S. Wang et al. [ |
| Nanocavities array on glass substrate | 360 | Cattoni et al. [ |
| Gold nanograting on PMMA slab waveguide | 547 | This work |
B. Experimental Confirmation: Characterization of Non-Optimum Sensor Configurations
By taking advantage of the same technology process described in Section 3.A, we have realized and tested some GNG-based configurations that resulted as non-optimized, according to the numerical analysis carried out in Section 2, to experimentally confirm simulations results.
First, to determine the role of the grating in the plasmonic phenomenon, we have considered two non-periodic configurations, i.e., a “non-periodic configuration 1,” where the stripe width is variable, whereas the mutual spacing between the stripes is kept fixed to 600 nm as in the optimized case, and a “non-periodic configuration 2,” where the stripe width is equal to 400 nm (as in the optimized case), but the mutual spacing is variable.
The SEM images together with the normalized plasmonic spectra relative to non-periodic configuration 1 and non-periodic configuration 2 are reported in Fig. 11 and Fig. 12, respectively. As is clearly shown in Figs. 11(b) and 12(b), a resonance phenomenon is present in both cases although the periodicity condition of the grating is not satisfied anymore. These results reflect the fact that hybrid modes are excited in this kind of structure, as supposed in Section 2.
![]()
Figure 11.(a) SEM image and (b) normalized plasmonic spectra at varying external refractive index relative to non-periodic configuration 1.
![]()
Figure 12.(a) SEM image and (b) normalized plasmonic spectra at varying external refractive index relative to non-periodic configuration 2.
Furthermore, we have also realized and tested two periodic configurations, i.e., a “periodic configuration 1,” where the grating has a period equal to 1 μm (like the optimized structure) and a stripe width equal to 600 nm (wider than the optimized configuration), and a “periodic configuration 2,” where the grating presents a stripe width equal to about 400 nm (like the optimized structure) and a period equal to about 1.6 μm, larger than the optimized configuration. Figures 13 and 14 report the SEM images and plasmonic spectra relative to periodic configuration 1 and periodic configuration 2, respectively.
![]()
Figure 13.(a) SEM image and (b) normalized plasmonic spectra at varying of the external refractive index relative to periodic configuration 1.
![]()
Figure 14.(a) SEM image and (b) normalized plasmonic spectra at varying external refractive index relative to periodic configuration 2.
As is clear, a blueshift of the resonance wavelength at the increasing external refractive index is observed in all the considered cases, except in the periodic configuration 2. In fact, the latter still presents a slight resonance phenomenon when air is considered as the surrounding medium while, on the contrary, at higher refractive index values (aqueous medium), standing the weak mutual coupling between the nanostripes caused by the very large period, the resonance condition is not satisfied anymore, as clearly shown in Fig. 14(b).
Figure 15 reports the absolute value of the variation in resonance wavelength (
![]()
Figure 15.Absolute value of the variation in resonance wavelength (
As shown in Fig. 15, the introduction of non-periodic or non-optimized structures from the geometrical (i.e., width and spacing) point of view, has led to a considerable drop in the sensitivity calculated for each configuration, as the slopes of the linear fitting functions reported in Fig. 15. On the contrary, the bright side of the non-optimum configurations is mainly linked to a clear improvement in the SNR, in terms of FWHM. This duality between sensitivity and SNR was already highlighted by the simulation results in Section 2.
C. Binding Test: BSA Detection
The biochemical sensing capabilities of the optimized and developed plasmonic sensor (described in Section 4.A) have been tested by depositing a specific receptor (MIP) for the BSA protein. In particular, the functionalized surface coincides with the one where the nanograting is present [see Fig. 16(a)]. Figure 16(b) shows the normalized plasmonic spectra relative to the GNG-based sensor with the receptor layer, at different BSA protein concentrations ranging from 0.1 to 1000 nM. As is clear, a blueshift of the resonance wavelength (
![]()
Figure 16.(a) Outline of the functionalized surface and (b) plasmonic spectra obtained at different BSA protein concentrations. Inset: zoom-in of the resonance region.
Figure 17 shows the absolute value of the resonance wavelength shift with respect to the blank (solution without the analyte), along with the Langmuir fitting of the experimental data and the error bars, in semi-log scale.
![]()
Figure 17.Absolute value of resonance wavelength variation (
For each sample, the experimental measurements were repeated three times, and the maximum error (equal to 0.2 nm) was considered as the error bar. This dose-response curve was fitted by the following Langmuir equation:
The parameters relative to the Langmuir fitting are listed in Table 2. These values have been obtained by OriginPro software (Origin Lab. Corp., Northampton, MA, USA). As shown in Eq. (5), at low analyte concentration (
Parameters of the Langmuir Fitting (GNG-MIP-Based Platform)
| Statistics | |||
|---|---|---|---|
| Red. Chi-Sqr | Adj R-Square | ||
| 0.009 | 0.99 | ||
D. Discussion
1. Comparative Analysis with Other BSA Sensors
To better understand how in the proposed structure the plasmonic phenomenon has been enhanced with respect to other configurations, we have first compared the GNG-MIP-based sensor with another BSA sensor based on an SPR D-shaped POF platform functionalized with the same MIP receptor layer [57].
We have evaluated and compared the LOD for both configurations (SPR-POF-MIP and GNG-MIP based). The SPR-POF-MIP platform shows an LOD equal to about 0.37 μM [57], whereas the value obtained in the case of the GNG-MIP-based configuration is about four orders of magnitude lower (37 pM).
With regard to the range of BSA detection, it is possible to observe that the SPR-POF sensor is capable of detecting a BSA protein concentration ranging from 0.37 μM (LOD) to about 6.5 μM (value of saturation); on the contrary, the nanograting-based sensor has shown a range of BSA detection between 37 pM (LOD) and 100 nM (value of saturation). So, depending on the particular requirements, both configurations can be used: if a very low sensitivity is strictly required, the plasmonic GNG-MIP-based configuration is preferred because of a very low LOD; on the contrary, the SPR-POF configuration is preferable when higher concentrations have to be analyzed.
Finally, to compare the proposed sensor with other BSA sensors, based on different platforms or receptors, Table 3 summarizes the main biosensing parameters relative to several sensors presented in the literature. In particular, the developed GNG-based sensor approach presents, as a main advantage, label-free detection and lower LOD if compared to the fluorescent-based sensors proposed in Refs. [62,63]. When comparing it with other plasmonic-based techniques [57,64,65] a clear improvement in terms of LOD has been obtained with respect to Refs. [57,64], whereas this value is lower with respect to the one calculated in Ref. [65], where a bioreceptor is used. This kind of receptor, if compared to a synthetic receptor (MIP), presents as a main advantage of very good sensitivity because the binding occurs closest to the metal–dielectric interface, whereas it presents also diverse disadvantages. For instance, MIP receptors are easier and faster to prepare with respect to bioreceptors; moreover, they present also longer durability, better behavior in harsh environmental conditions, and the possibility to use them in industrial manufacturing [55,56].
Comparative Analysis among Several Sensor Configurations for Selective BSA Detection
| Configuration | LOD | BSA Detection Range | Reference |
|---|---|---|---|
| SPR-POF-MIP | 0.37 μM | 0.37–6.5 μM | [ |
| Fluorescence sensor | 10 nM | 0.01–2 μM | [ |
| Aggregation-induced emission biosensor coupled with graphene-oxide | 0.4 μM | 0.4–1.5 μM | [ |
| 4.36 nM | 4.36–750 nM | [ | |
| LSPR based on bimetallic nanoparticles | 0.15 pM | 150–15,000 pM | [ |
| GNG-MIP-based | 37 pM | 0.037–100 nM | This work |
2. Reproducibility and Reusability of the Proposed Sensor
To check the reproducibility of the proposed sensor, we have performed several tests from both optical and biosensing sides. In particular, we have built and tested the optimized sensor configuration three different times obtaining a maximum variation in resonance wavelength, when water (
We have conducted a similar analysis also when the sensor is derivatized with the synthetic receptor, in particular by filling the holder tank with a blank solution (buffer solution without analyte).
Furthermore, the proposed biosensor can be reutilized since it is possible to regenerate the MIP receptor by using the same extraction procedure described in Section 3.C. This aspect has been experimentally verified, and the obtained results testify to the goodness of the regeneration process.
5. CONCLUSION
A novel sensing approach, based on GNGs on PMMA chips monitored through a custom 3D-printed holder combined with POFs, has been exploited. In particular, we have conducted theoretical and experimental studies to establish the best plasmonic sensor configuration, obtaining a bulk sensitivity of about 547 nm/RIU.
As a proof of concept, we have also used it as a biochemical sensor by functionalizing the nanograting surface with a synthetic receptor specific for BSA protein. In such a way, we have obtained an LOD equal to about 37 pM. This value is four orders of magnitude lower than the one obtained with another biochemical sensor based on an SPR-POF probe, functionalized with the same MIP receptor. Moreover, the obtained LOD is lower than the one reported by other BSA sensors.
The proposed sensing approach presents also other advantages in terms of capability of tuning the sensor’s performances, by changing the patterns/materials, and of economic aspects, as well. In fact, with regard to the optical transducer, the nanostructures can be realized by exploiting processes typical of microelectronics, so leading to economic advantages of large-scale production; on the other hand, the quantity of polymer, which is obviously related to the sensitivity area, affects the total cost of the biochemical sensor. For instance, in the case of the SPR-POF-MIP sensor, the sensitivity area is
Acknowledgment
Acknowledgment. This work was supported by the VALERE program of the University of Campania “Luigi Vanvitelli” (Italy), CAMPANIA project.
References
[1] Y. Chen, H. Ming. Review of surface plasmon resonance and localized surface plasmon resonance sensor. Photon. Sens., 2, 37-49(2012).
[2] J. Homola, S. S. Yee, G. Gauglitz. Surface plasmon resonance sensors: review. Sens. Actuators B Chem., 54, 3-15(1999).
[3] K. M. Mayer, J. H. Hafner. Localized surface plasmon resonance sensors. Chem. Rev., 111, 3828-3857(2011).
[4] L. Tong, H. Wei, S. Zhang, H. Xu. Recent advances in plasmonic sensors. Sensors, 14, 7959-7973(2014).
[5] S. Unser, I. Bruzas, J. He, L. Sagle. Localized surface plasmon resonance biosensing: current challenges and approaches. Sensors, 15, 15684-15716(2015).
[6] P. Singh. SPR biosensors: historical perspectives and current challenges. Sens. Actuators B Chem., 229, 110-130(2016).
[7] Y. E. Monfared. Overview of recent advances in the design of plasmonic fiber-optic biosensors. Biosensors, 10, 77(2020).
[8] J. Homola. Surface plasmon resonance sensors for detection of chemical and biological species. Chem. Rev., 108, 462-493(2008).
[9] S. Chen, Y. Liu, Z. Liu, S. Chu, W. Peng. Micro-capillary-based self-referencing surface plasmon resonance biosensor for determination of transferrin. Appl. Opt., 55, 8571-8575(2016).
[10] G.-S. Liu, X. Xiong, S. Hu, W. Shi, Y. Chen, W. Zhu, H. Zheng, J. Yu, N. H. Azeman, Y. Luo, Z. Chen. Photonic cavity enhanced high-performance surface plasmon resonance biosensor. Photon. Res., 8, 448-456(2020).
[11] S. Kumar, B. K. Kaushik, R. Singh, N.-K. Chen, Q. S. Yang, X. Zhang, W. Wang, B. Zhang. LSPR-based cholesterol biosensor using a tapered optical fiber structure. Biomed. Opt. Express, 10, 2150-2160(2019).
[12] N. Cennamo, A. Donà, P. Pallavicini, G. D’Agostino, G. Dacarro, L. Zeni, M. Pesavento. Sensitive detection of 2,4,6-trinitrotoluene by tridimensional monitoring of molecularly imprinted polymer with optical fiber and five-branched gold nanostars. Sens. Actuators B Chem., 208, 291-298(2015).
[13] S. Kumar, R. Singh, Q. Yang, S. Cheng, B. Zhang, B. K. Kaushik. Highly sensitive, selective and portable sensor probe using germanium-doped photosensitive optical fiber for ascorbic acid detection. IEEE Sens. J., 21, 62-70(2021).
[14] R. Singh, S. Kumar, F.-Z. Liu, C. Shuang, B. Zhang, R. Jha, B. K. Kaushik. Etched multicore fiber sensor using copper oxide and gold nanoparticles decorated graphene oxide structure for cancer cells detection. Biosens. Bioelectron., 168, 112557(2020).
[15] L. Zeni, C. Perri, N. Cennamo, F. Arcadio, G. D’Agostino, M. Salmona, M. Beeg, M. Gobbi. A portable optical-fibre-based surface plasmon resonance biosensor for the detection of therapeutic antibodies in human serum. Sci. Rep., 10, 11154(2020).
[16] N. Cennamo, F. Arcadio, C. Perri, L. Zeni, F. Sequeira, L. Bilro, R. Nogueira, G. D’Agostino, G. Porto, A. Biasiolo. Water monitoring in smart cities exploiting plastic optical fibers and molecularly imprinted polymers. The case of PFBS detection. IEEE International Symposium on Measurements & Networking (M&N), 1-6(2019).
[17] N. Cennamo, F. Arcadio, A. Minardo, D. Montemurro, L. Zeni. Experimental characterization of plasmonic sensors based on lab-built tapered plastic optical fibers. Appl. Sci., 10, 4389(2020).
[18] N. Cennamo, F. Mattiello, L. Zeni. Slab waveguide and optical fibers for novel plasmonic sensor configurations. Sensors, 17, 1488(2017).
[19] L. Singh, R. Singh, B. Zhang, B. K. Kaushik, S. Kumar. Localized surface plasmon resonance based hetero-core optical fiber sensor structure for the detection of L-cysteine. IEEE Trans. Nanotechnol., 19, 201-208(2020).
[20] N. Agrawal, C. Saha, C. Kumar, R. Singh, B. Zhang, S. Kumar. Development of uric acid sensor using copper oxide and silver nanoparticles immobilized SMSMS fiber structure-based probe. IEEE Trans. Instrum. Meas., 69, 9097-9104(2020).
[21] N. Agrawal, C. Saha, C. Kumar, R. Singh, B. Zhang, R. Jha, S. Kumar. Detection of L-cysteine using silver nanoparticles and graphene oxide immobilized tapered SMS optical fiber structure. IEEE Sens. J., 20, 11372-11379(2020).
[22] N. Sabri, S. A. Aljunid, M. S. Salim, S. Fouad. Fiber optic sensors: short review and applications. Recent Trends in Physics of Material Science and Technology, 204(2015).
[23] H. Zhao, Y. Lee, M. Han, B. K. Sharma, X. Chen, J.-H. Ahn, J. A. Rogers. Nanofabrication approaches for functional three-dimensional architectures. Nano Today, 30, 100825(2020).
[24] A. Biswas, I. S. Bayer, A. S. Biris, T. Wang, E. Dervishi, F. Faupel. Advances in top–down and bottom–up surface nanofabrication: techniques, applications and future prospects. Adv. Colloid Interface Sci., 170, 2-27(2012).
[25] A. Tagliacozzo, S. De Nicola, D. Montemurro, G. Campagnano, C. Petrarca, C. Forestiere, G. Rubinacci, F. Tafuri, G. P. Pepe. Use of a spoof plasmon to optimize the coupling of infrared radiation to Josephson-junction fluxon oscillations. Phys. Rev. B, 101, 014506(2020).
[26] D. Montemurro, D. Stornaiuolo, D. Massarotti, D. Ercolani, L. Sorba, F. Beltram, F. Tafuri, S. Roddaro. Suspended InAs nanowire Josephson junctions assembled via dielectrophoresis. Nanotechnology, 26, 385302(2012).
[27] D. Montemurro, D. Massarotti, P. Lucignano, S. Roddaro, D. Stornaiuolo, D. Ercolani, L. Sorba, A. Tagliacozzo, F. Beltram, F. Tafuri. Towards a hybrid high critical temperature superconductor junction with a semiconducting InAs nanowire barrier. J. Supercond. Nov. Magn., 28, 3429-3437(2015).
[28] F. Carillo, G. M. De Luca, D. Montemurro, G. Papari, M. Salluzzo, D. Stornaiuolo, F. Tafuri, F. Beltram. Coherent transport in extremely underdoped Nd1.2Ba1.8Cu3Oz nanostructures. New J. Phys., 14, 083025(2012).
[29] E. Trabaldo, S. Ruffieux, E. Andersson, R. Arpaia, D. Montemurro, J. F. Schneiderman, A. Kalaboukhov, D. Winkler, F. Lombardi, T. Bauch. Properties of grooved Dayem bridge based YBa2Cu3O7 −
[30] M. E. Stewart, C. R. Anderton, L. B. Thompson, J. Maria, S. K. Gray, J. A. Rogers, R. G. Nuzzo. Nanostructured plasmonic sensors. Chem. Rev., 108, 494-521(2008).
[31] H.-M. Kim, M. Uh, D. H. Jeong, H.-Y. Lee, J.-H. Park, S.-K. Lee. Localized surface plasmon resonance biosensor using nanopatterned gold particles on the surface of an optical fiber. Sens. Actuators B Chem., 280, 183-191(2019).
[32] C. Li, Z. Li, S. Li, Y. Zhang, B. Sun, Y. Yu, H. Ren, S. Jiang, W. Yue. LSPR optical fiber biosensor based on a 3D composite structure of gold nanoparticles and multilayer graphene films. Opt. Express, 28, 6071-6083(2020).
[33] M.-C. Estevez, M. A. Otte, B. Sepulveda, L. M. Lechuga. Trends and challenges of refractometric nanoplasmonic biosensors: a review. Anal. Chim. Acta, 806, 55-73(2014).
[34] A. A. Darweesh, S. J. Bauman, J. B. Herzog. Improved optical enhancement using double-width plasmonic gratings with nanogaps. Photon. Res., 4, 173-180(2016).
[35] A. Dhawan, M. Canva, T. Vo-Dinh. Narrow groove plasmonic nano-gratings for surface plasmon resonance sensing. Opt. Express, 19, 787-813(2011).
[36] N. Cennamo, A. Leone, A. Forleo, F. Mattiello, L. Francioso, P. A. S. Jorge, S. Capone, R. Sweid, L. De Maria, P. Siciliano, C. Di Natale, M. Pesavento, L. Zeni. Numerical results on the exploitation of gold nanostructures in plastic optical fibers based plasmonic sensors. Sensors and Microsystems. Associazione Italiana Sensori e Microsistemi (AISEM) 2017, 457(2018).
[37] F. Sohrabi, S. M. Hamidi, E. Mohammadi. Role of higher order plasmonic modes in one-dimensional nanogratings. Opt. Quantum Electron., 51, 241(2019).
[38] S. Subramanian, K. Kumar, A. Dhawan. Palladium-coated narrow groove plasmonic nanogratings for highly sensitive hydrogen sensing. RSC Adv., 10, 4137-4147(2019).
[39] H.-T. Yan, Q. Liu, Y. Ming, W. Luo, Y. Chen, Y.-Q. Lu. Metallic grating on a D-shaped fiber for refractive index sensing. IEEE Photon. J., 5, 4800706(2013).
[40] M. Gao, W. Yang, Z. Wang, S. Lin, J. Zhu, Z. Yang. Plasmonic resonance-linewidth shrinkage to boost biosensing. Photon. Res., 8, 1226-1235(2020).
[41] D. Kawasaki, H. Yamada, K. Maeno, K. Sueyoshi, H. Hisamoto, T. Endo. Core–shell-structured gold nanocone array for label-free DNA sensing. ACS Appl. Nano Mater., 2, 4983-4990(2019).
[42] Y. Shen, J. Zhou, T. Liu, Y. Tao, R. Jiang, M. Liu, G. Xiao, J. Zhu, Z.-K. Zhou, X. Wang, C. Jin, J. Wang. Plasmonic gold mushroom arrays with refractive index sensing figures of merit approaching the theoretical limit. Nat. Commun., 4, 2381(2013).
[43] B. W. Liu, S. Chen, J. C. Zhang, X. Yao, J. H. Zhong, H. X. Lin, T. H. Huang, Z. L. Yang, J. F. Zhu, S. Liu, C. Lienau, L. Wang, B. Ren. A plasmonic sensor array with ultrahigh figures of merit and resonance linewidths down to 3 nm. Adv. Mater., 30, 1706031(2018).
[44] M. Chamanzar, Z. Xia, S. Yegnanarayanan, A. Adibi. Hybrid integrated plasmonic-photonic waveguides for on-chip localized surface plasmon resonance (LSPR) sensing and spectroscopy. Opt. Express, 21, 32086-32098(2013).
[45] H. Im, J. N. Sutherland, J. A. Maynard, S.-H. Oh. Nanohole-based surface plasmon resonance instruments with improved spectral resolution quantify a broad range of antibody-ligand binding kinetics. Anal. Chem., 84, 1941-1947(2012).
[46] A. E. Cetin, D. Etezadi, B. C. Galarreta, M. P. Busson, Y. Eksioglu, H. Altug. Plasmonic nanohole arrays on robust hybrid substrate for highly sensitive label-free biosensing. ACS Photon., 2, 1167-1174(2015).
[47] S. Klinghammer, T. Uhlig, F. Patrovsky, M. Böhm, J. Schütt, N. Pütz, L. Baraban, L. M. Eng, G. Cuniberti. Plasmonic biosensor based on vertical arrays of gold nanoantennas. ACS Sens., 3, 1392-1400(2018).
[48] K. M. Byun, D. Kim, S. J. Kim. Investigation of the profile effect on the sensitivity enhancement of nanowire-mediated localized surface plasmon resonance biosensors. Sens. Actuators B Chem., 117, 401-407(2006).
[49] K. Kim, D. J. Kim, S. Moon, D. Kim, K. M. Byun. Localized surface plasmon resonance detection of layered biointeractions on metallic subwavelength nanogratings. Nanotechnology, 20, 315501(2009).
[50] G. D’Aguanno, N. Mattiucci, A. Alù, M. J. Bloemer. Quenched optical transmission in ultrathin subwavelength plasmonic gratings. Phys. Rev. B, 83, 035426(2011).
[51] N. Mattiucci, G. D’Aguanno, M. J. Bloemer. Long range plasmon assisted all-optical switching at telecommunication wavelengths. Opt. Lett., 37, 121-123(2012).
[52] T. Kume, N. Nakagawa, S. Hayashi, K. Yamamoto. Interaction between localized and propagating surface plasmons: Ag fine particles on Al surface. Solid State Commun., 93, 171-175(1995).
[53] K. Ma, D. J. Kim, K. Kim, S. Moon, D. Kim. Target-localized nanograting-based surface plasmon resonance detection toward label-free molecular biosensing. IEEE J. Sel. Top. Quantum Electron., 16, 1004-1014(2010).
[54] N. Cennamo, D. Massarotti, L. Conte, L. Zeni. Low cost sensors based on SPR in a plastic optical fiber for biosensor implementation. Sensors, 11, 11752-11760(2011).
[55] J. J. Belbruno. Molecularly imprinted polymers. Chem. Rev., 119, 94-119(2019).
[56] K. Haupt, K. Mosbach. Molecularly imprinted polymers and their use in biomimetic sensors. Chem. Rev., 100, 2495-2504(2000).
[57] N. Cennamo, G. D’Agostino, C. Perri, F. Arcadio, G. Chiaretti, E. M. Parisio, G. Camarlinghi, C. Vettori, F. Di Marzo, R. Cennamo, G. Porto, L. Zeni. Proof of concept for quick and on-site highly sensitive detection of SARS-CoV-2 by plasmonic optical fibers and molecularly imprinted polymers. Sensors, 21, 1681(2021).
[58] W. Zou, H. Xie, Y. Ye, W. Ni. Tailoring optical cross sections of gold nanorods at a target plasmonic resonance wavelength using bromosalicylic acid. RSC Adv., 9, 16028-16034(2019).
[59] L. Saa, M. Coronado-Puchau, V. Pavlov, L. M. Liz-Marzàn. Enzymatic etching of gold nanorods by horseradish peroxidase and application to blood glucose detection. Nanoscale, 6, 7405-7409(2014).
[60] S. Wang, X. Sun, M. Ding, G. Peng, Y. Qi, Y. Wang, J. Ren. The investigation of an LSPR refractive index sensor based on periodic gold nanorings array. J. Phys. D, 51, 045101(2018).
[61] A. Cattoni, P. Ghenuche, A.-M. Haghiri-Gosnet, D. Decanini, J. Chen, J.-L. Pelouard, S. Collin.
[62] M. Cui, Y. Xin, R. Song, Q. Sun, X. Wang, D. Lu. Fluorescence sensor for bovine serum albumin detection based on the aggregation and release of CdS QDs within CMC. Cellulose, 27, 1621-1633(2020).
[63] X. J. Xu, J. Huang, J. J. Li, J. W. Yan, J. G. Qin, Z. Li. A graphene oxide-based AIE biosensor with high selectivity toward bovine serum albumin. Chem. Commun., 47, 12385-12387(2011).
[64] S. Kaushik, U. K. Tiwari, A. Deep, R. K. Sinha. Two-dimensional transition metal dichalcogenides assisted biofunctionalized optical fiber SPR biosensor for efficient and rapid detection of bovine serum albumin. Sci. Rep., 9, 6987(2019).
[65] K. Jia, M. Y. Khaywah, Y. Li, J. L. Bijeon, P. M. Adam, R. Déturche, B. Guelorget, M. François, G. Louarn, R. E. Ionescu. Strong improvements of localized surface plasmon resonance sensitivity by using Au/Ag bimetallic nanostructures modified with polydopamine films. ACS Appl. Mater. Interfaces, 6, 219-227(2014).


Set citation alerts for the article
Please enter your email address

© Copyright 2018-2021 | Chinese Laser Press. All Rights Reserved 沪ICP备15018463号-20