
Xin Meng, Zhiwei Hu, Xingda Lu, Wanxia Cao, Xichang Zhang, Haowei Li, Ying Hu, Wei Yi, Yanhong Xiao. Tunable non-Hermiticity through reservoir engineering[J]. Photonics Research, 2022, 10(9): 2091
- Photonics Research
- Vol. 10, Issue 9, 2091 (2022)
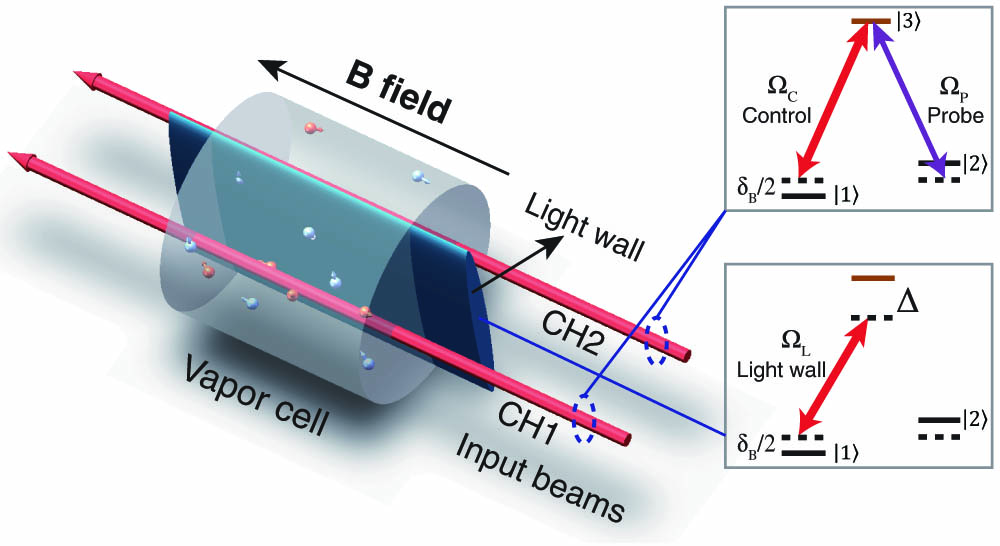
Fig. 1. Schematics of the tunable non-Hermiticity through reservoir engineering. Each of the two spatially separated optical channels within the atomic-vapor cell, Ch1 and Ch2, contains collinearly propagating weak probe and strong control fields (with Rabi frequency of Ω p Ω c D 2 Rb 87 5 S 1 / 2 F = 1 5 P 3 / 2 F ′ = 0, 1, 2, 3 θ 0
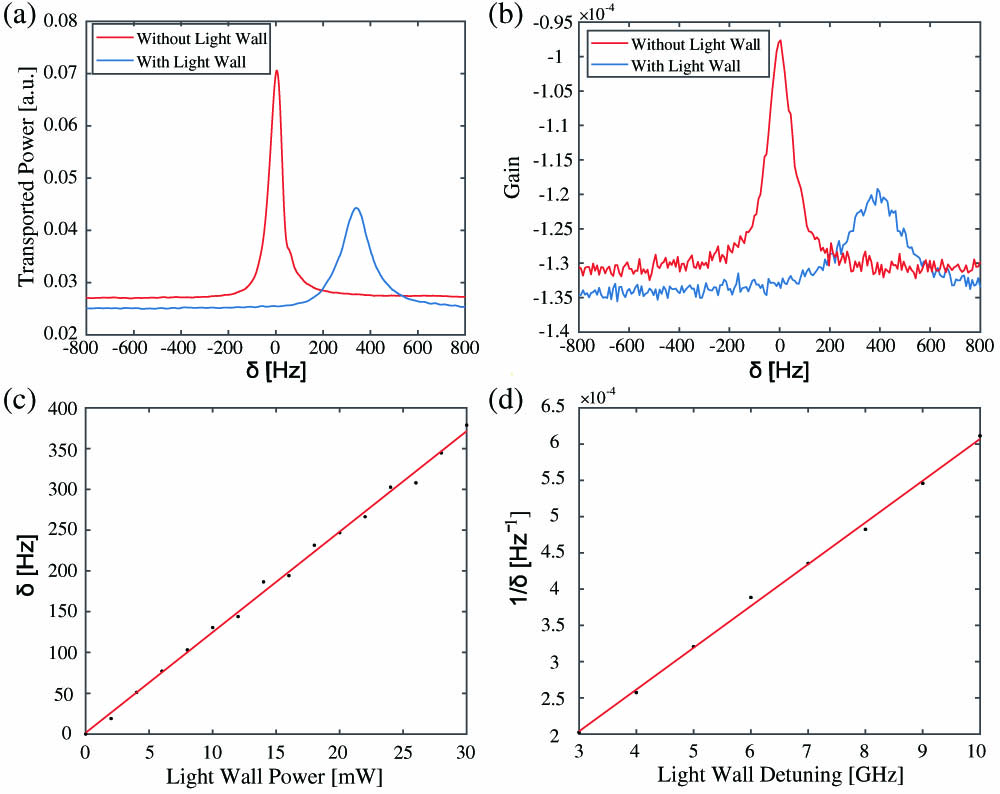
Fig. 2. Characterization of the light wall. Illustration of typical EIT spectra with (blue) and without (red) the light wall, obtained from (a) experiment and (b) Monte-Carlo simulations. (c) Measured EIT center shift versus laser power, with red detuning of 6 GHz. (d) Measured EIT center shift versus laser detuning, with laser power of 24 mW.
Fig. 3. Measurement of the light-wall-induced phase shift in the atomic spin wave. Light power output from the interference between the control and probe fields in Ch1 and Ch2, respectively, with (a) light wall turned off, (b) light-wall power of 6 mW, and (c) light-wall power of 30 mW. The inferred phase shifts of the spin wave are 0, π / 4 π / 2
Fig. 4. Beam splitter with tunable non-Hermiticity. Transmitted probe powers in Ch1 and Ch2, with input probes in both channels turned on, with (a) absence of the light wall, (b) light-wall power of 6 mW, and (c) light-wall power of 24 mW, displaying a phase lag between the two channels of about π / 2 π
Fig. 5. (a) Schematic illustration of the proposed three-channel model in Eq. (3 ). (b) Location of the exceptional point as a function of δ θ 0 = 0 δ = 0 3 ), with δ = 0 θ 0 = 0 g 1 / g 0 = 1 δ / g 0 = 0.5 θ 0 = 0 g 1 / g 0 = 1.73 δ = 0 θ 0 = 0.02 π δ / g 0 = 0.5 θ 0 = 0.02 π
Fig. 6. Measured EIT linewidth versus laser power of the control field. The line is a linear fit to guide the eye.
Fig. 7. (a) Experiment measurements of the phase saturation. Blue curve is the phase shift shown in Fig. 3 (d). Red curve is the experimental EIT center shift divided by the EIT full linewidth. (b) Monte Carlo simulation results (black dots) of the phase shift. The red curve is a fit of the Monte Carlo results to guide the eye. The laser power required in the simulation is smaller than that in the experiment because the atomic motion in the model is two-dimensional and thus more phase shift accumulates for the same laser parameters.

Set citation alerts for the article
Please enter your email address
© Copyright 2018-2021 | Chinese Laser Press. All Rights Reserved 沪ICP备15018463号-20