• Photonics Research
  • Vol. 6, Issue 5, A23 (2018)
Weijian Chen1, Jing Zhang1、2, Bo Peng1, Şahin Kaya Özdemir1, Xudong Fan3, and Lan Yang1、*
Author Affiliations
  • 1Department of Electrical and Systems Engineering, Washington University, St. Louis, Missouri 63130, USA
  • 2Department of Automation, Tsinghua University, Beijing 100084, China
  • 3Department of Biomedical Engineering, University of Michigan, Ann Arbor, Michigan 48109, USA
  • show less
    DOI: 10.1364/PRJ.6.000A23 Cite this Article Set citation alerts
    Weijian Chen, Jing Zhang, Bo Peng, Şahin Kaya Özdemir, Xudong Fan, Lan Yang. Parity-time-symmetric whispering-gallery mode nanoparticle sensor [Invited][J]. Photonics Research, 2018, 6(5): A23 Copy Citation Text show less
    WGM nanoparticle sensors based on (a) the single passive resonator, (b) the single active resonator, and (c) PT-symmetric coupled resonators with balanced gain and loss. The gray-colored small circle denotes a nanoparticle within the mode volume of the resonator. The spectra illustrate sensing mechanisms of the sensors. The dashed red curve shows the spectrum before the nanoparticle binding event; the solid blue curve corresponds to the spectrum after the nanoparticle binding event. The sensors in (a) and (b) exhibit a frequency splitting proportional to ϵ, which is the perturbation strength induced by the nanoparticle. With the assistance of gain, the linewidth of the resonance mode is reduced; thus, the resolvability of mode splitting is improved in (b), compared with the sensor in (a). For the PT-symmetric sensor operating at the phase transition point, the frequency splitting induced by the nanoparticle exhibits a square-root dependence on the perturbation. For a sufficiently small perturbation, the PT-symmetric sensor exhibits much larger frequency splitting. In addition, with balanced gain and loss, the linewidth can be very narrow, which helps to resolve much smaller mode splitting.
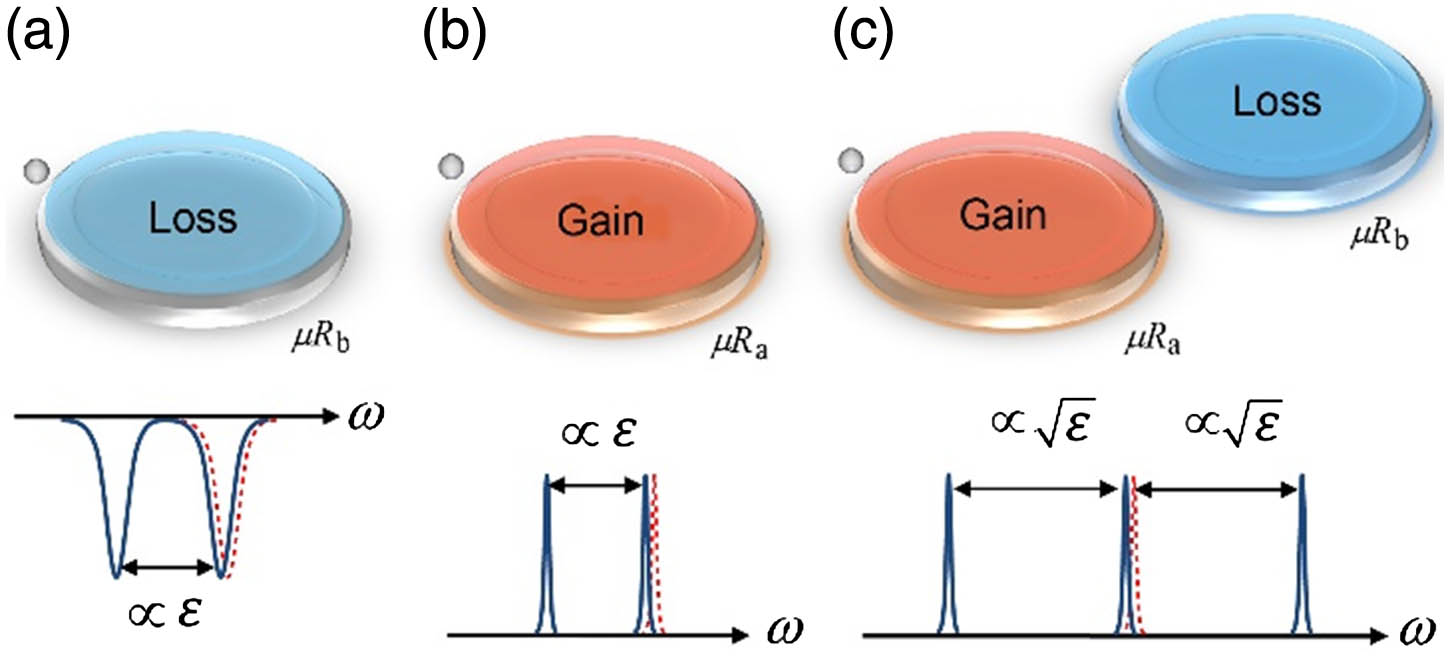
    Fig. 1. WGM nanoparticle sensors based on (a) the single passive resonator, (b) the single active resonator, and (c) PT-symmetric coupled resonators with balanced gain and loss. The gray-colored small circle denotes a nanoparticle within the mode volume of the resonator. The spectra illustrate sensing mechanisms of the sensors. The dashed red curve shows the spectrum before the nanoparticle binding event; the solid blue curve corresponds to the spectrum after the nanoparticle binding event. The sensors in (a) and (b) exhibit a frequency splitting proportional to ϵ, which is the perturbation strength induced by the nanoparticle. With the assistance of gain, the linewidth of the resonance mode is reduced; thus, the resolvability of mode splitting is improved in (b), compared with the sensor in (a). For the PT-symmetric sensor operating at the phase transition point, the frequency splitting induced by the nanoparticle exhibits a square-root dependence on the perturbation. For a sufficiently small perturbation, the PT-symmetric sensor exhibits much larger frequency splitting. In addition, with balanced gain and loss, the linewidth can be very narrow, which helps to resolve much smaller mode splitting.
    Evolution of the (a) real part and (b) imaginary part of eigenfrequencies in PT-symmetric coupled resonators when the coupling strength between two resonators is varied. The PT phase transition point is obtained when the coupling strength κ=κPT=1 GHz. The symbols are the results of numerical simulations, and the color curves are theoretical predictions.
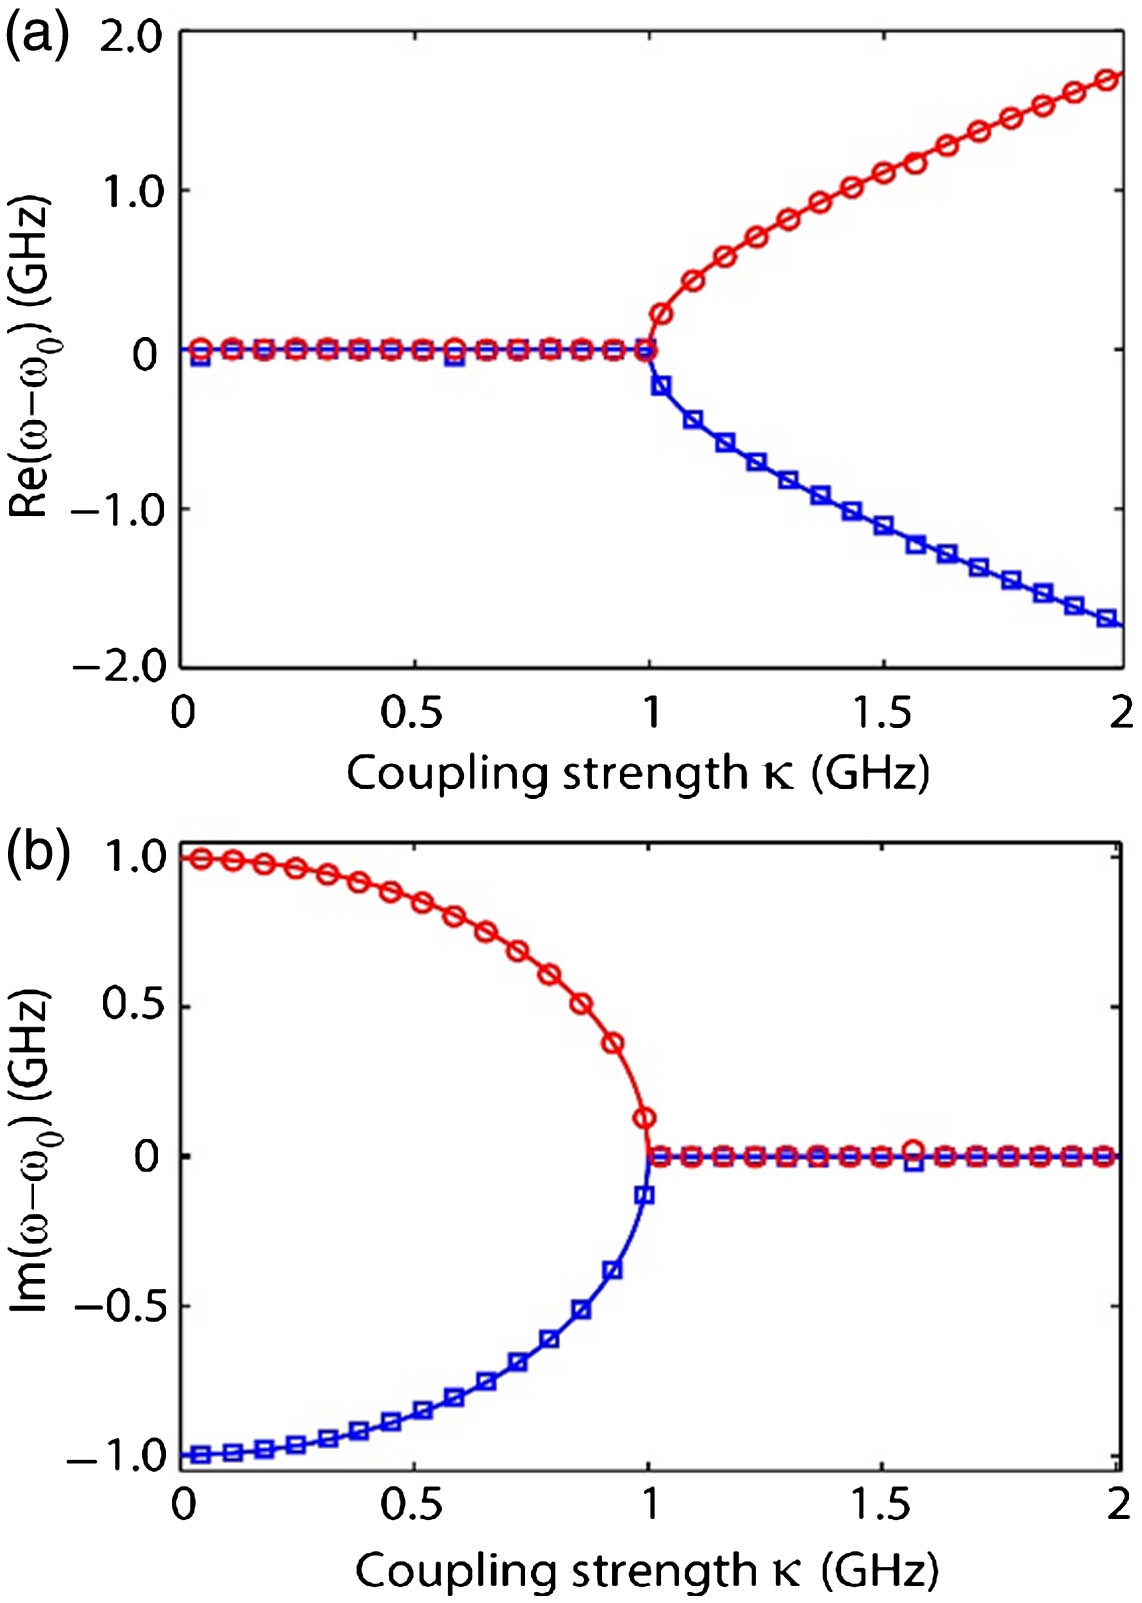
    Fig. 2. Evolution of the (a) real part and (b) imaginary part of eigenfrequencies in PT-symmetric coupled resonators when the coupling strength between two resonators is varied. The PT phase transition point is obtained when the coupling strength κ=κPT=1  GHz. The symbols are the results of numerical simulations, and the color curves are theoretical predictions.
    (a) Evolution of the real part of the eigenfrequencies Re(ω−ω0) in PT-symmetric coupled resonators with single nanoparticle located at resonator μRa when the coupling strength is varied. Two supermodes (blue squares and red circles) are perturbed by the nanoparticle and thus experience frequency shift, whereas the other two supermodes (black squares and circles) are not affected, serving as reference signals. The size and location of the nanoparticle (i.e., perturbation strength) are fixed. (b) Absolute value of the frequency splitting Re(Δω) of two pairs of supermodes in PT-symmetric coupled resonators when changing the coupling strength. The frequency splitting is obtained by calculating the difference between frequencies of the perturbed supermode and its reference. When the coupling strength is zero, it becomes the case of a single WGM sensor: the resonator with the nanoparticle exhibits frequency splitting, whereas the other resonator is not affected at all. At the phase transition point, the PT-symmetric sensor exhibits about twice the frequency splitting compared with the single WGM sensor subject to the same perturbation. The symbols are results from the numerical simulations, and the color curves are the theoretical predictions.
    Fig. 3. (a) Evolution of the real part of the eigenfrequencies Re(ωω0) in PT-symmetric coupled resonators with single nanoparticle located at resonator μRa when the coupling strength is varied. Two supermodes (blue squares and red circles) are perturbed by the nanoparticle and thus experience frequency shift, whereas the other two supermodes (black squares and circles) are not affected, serving as reference signals. The size and location of the nanoparticle (i.e., perturbation strength) are fixed. (b) Absolute value of the frequency splitting Re(Δω) of two pairs of supermodes in PT-symmetric coupled resonators when changing the coupling strength. The frequency splitting is obtained by calculating the difference between frequencies of the perturbed supermode and its reference. When the coupling strength is zero, it becomes the case of a single WGM sensor: the resonator with the nanoparticle exhibits frequency splitting, whereas the other resonator is not affected at all. At the phase transition point, the PT-symmetric sensor exhibits about twice the frequency splitting compared with the single WGM sensor subject to the same perturbation. The symbols are results from the numerical simulations, and the color curves are the theoretical predictions.
    (a) Dependence of sensitivity of a PT-symmetric sensor operating at the phase transition point on the perturbation strength ϵ. Inset shows the log-log plot of the dependence of the sensitivity on the perturbation strength, where a linear slope of 1/2 is clearly seen. (b) Dependences of the sensitivity enhancement on the perturbation strength ϵ (blue squares and dashed curve) and the gain strength γ (red circles and dashed curve). For the former one, the gain (loss) strength γ of the coupled resonators and the coupling strength κ are fixed when changing the perturbation strength ϵ. For the latter, the perturbation strength ϵ of the nanoparticle is fixed when changing the gain (loss) strength γ, and the coupling strength between the resonators is varied to set the system at the phase transition point. The symbols are the results of numerical simulations, and the color curves are theoretical predictions.
    Fig. 4. (a) Dependence of sensitivity of a PT-symmetric sensor operating at the phase transition point on the perturbation strength ϵ. Inset shows the log-log plot of the dependence of the sensitivity on the perturbation strength, where a linear slope of 1/2 is clearly seen. (b) Dependences of the sensitivity enhancement on the perturbation strength ϵ (blue squares and dashed curve) and the gain strength γ (red circles and dashed curve). For the former one, the gain (loss) strength γ of the coupled resonators and the coupling strength κ are fixed when changing the perturbation strength ϵ. For the latter, the perturbation strength ϵ of the nanoparticle is fixed when changing the gain (loss) strength γ, and the coupling strength between the resonators is varied to set the system at the phase transition point. The symbols are the results of numerical simulations, and the color curves are theoretical predictions.
    (a) Evolution of the imaginary part of the eigenfrequencies Im(ω−ω0) in PT-symmetric coupled resonators with a single nanoparticle located at resonator μRa when the coupling strength between two resonators is varied. The size and location of the nanoparticle (i.e., perturbation strength) are fixed. (b) Absolute value of the linewidth difference 2 Im(Δω) of two pairs of supermodes in PT-symmetric coupled resonators when changing the coupling strength. The linewidth difference is obtained by calculating the difference between the linewidths of the perturbed supermode and its reference. The symbols are results from the numerical simulations, and the color curves are theoretical predictions.
    Fig. 5. (a) Evolution of the imaginary part of the eigenfrequencies Im(ωω0) in PT-symmetric coupled resonators with a single nanoparticle located at resonator μRa when the coupling strength between two resonators is varied. The size and location of the nanoparticle (i.e., perturbation strength) are fixed. (b) Absolute value of the linewidth difference 2Im(Δω) of two pairs of supermodes in PT-symmetric coupled resonators when changing the coupling strength. The linewidth difference is obtained by calculating the difference between the linewidths of the perturbed supermode and its reference. The symbols are results from the numerical simulations, and the color curves are theoretical predictions.
    (a) Illustration of the detection of two nanoparticles in a PT-symmetric WGM nanoparticle sensor. The two nanoparticles are placed within the mode volume of the resonator with gain. (b), (c) Variation in frequency splitting as a function of the angular position of the second nanoparticle when (b) the two nanoparticles are identical with the same perturbation strength, and (c) the two nanoparticles are different and hence have different perturbation strengths. The angular position of the first nanoparticle is fixed and set to be zero. Blue squares are numerical simulation results; red solid curves are theoretical predictions. The results are normalized by the frequency splitting induced by the first nanoparticle on a single resonator sensor.
    Fig. 6. (a) Illustration of the detection of two nanoparticles in a PT-symmetric WGM nanoparticle sensor. The two nanoparticles are placed within the mode volume of the resonator with gain. (b), (c) Variation in frequency splitting as a function of the angular position of the second nanoparticle when (b) the two nanoparticles are identical with the same perturbation strength, and (c) the two nanoparticles are different and hence have different perturbation strengths. The angular position of the first nanoparticle is fixed and set to be zero. Blue squares are numerical simulation results; red solid curves are theoretical predictions. The results are normalized by the frequency splitting induced by the first nanoparticle on a single resonator sensor.
    (a) Illustration of the detection of multiple nanoparticles in a PT-symmetric WGM nanoparticle sensor. Ten different nanoparticles (numbered gray circles) are randomly deposited within the mode volume of the resonator with gain one by one. (b) Numerical results of frequency splitting variation for 10 nanoparticles deposited on the PT-symmetric WGM sensor (blue lines and squares) and a single WGM sensor (red lines and circles). The dashed vertical lines are used as eye guides. Results for the single WGM sensor are obtained by removing the lossy resonator in the numerical simulation. Results are normalized by the frequency splitting induced by the first nanoparticle deposited on a single WGM sensor with a value of 73 MHz.
    Fig. 7. (a) Illustration of the detection of multiple nanoparticles in a PT-symmetric WGM nanoparticle sensor. Ten different nanoparticles (numbered gray circles) are randomly deposited within the mode volume of the resonator with gain one by one. (b) Numerical results of frequency splitting variation for 10 nanoparticles deposited on the PT-symmetric WGM sensor (blue lines and squares) and a single WGM sensor (red lines and circles). The dashed vertical lines are used as eye guides. Results for the single WGM sensor are obtained by removing the lossy resonator in the numerical simulation. Results are normalized by the frequency splitting induced by the first nanoparticle deposited on a single WGM sensor with a value of 73 MHz.
    Weijian Chen, Jing Zhang, Bo Peng, Şahin Kaya Özdemir, Xudong Fan, Lan Yang. Parity-time-symmetric whispering-gallery mode nanoparticle sensor [Invited][J]. Photonics Research, 2018, 6(5): A23
    Download Citation