Abstract
We present a study of single nanoparticle detection using parity-time (PT) symmetric whispering-gallery mode (WGM) resonators. Our theoretical model and numerical simulations show that, with balanced gain and loss, the PT-symmetric WGM nanoparticle sensor, tailored to operate at PT phase transition points (also called exceptional points), exhibits significant enhancement in frequency splitting when compared with a single WGM nanoparticle sensor subject to the same perturbation. The presence of gain in the PT-symmetric system leads to narrower linewidth, which helps to resolve smaller changes in frequency splitting and improve the detection limit of nanoparticle sensing. Furthermore, we also provide a general method for detecting multiple nanoparticles entering the mode volume of a PT-symmetric WGM sensor one by one. Our study shows the feasibility of PT-symmetric WGM resonators for ultrasensitive single nanoparticle and biomolecule sensing.1. INTRODUCTION
High-quality whispering-gallery mode (WGM) optical resonators [1] have been widely used in various areas, including low-threshold lasers [2,3], optomechanics [4], cavity quantum electrodynamics [5], and optical communications [6,7]. Particularly, the strong light–matter interaction makes WGM resonators suitable platforms for nanoparticle/biomolecule sensing [8–17]. With circular geometry, the WGM resonator supports two degenerate modes at the same eigenfrequency with opposite propagating directions, i.e., clockwise (cw) and counterclockwise (ccw) directions. When a nanoparticle enters the mode volume, the interaction of the optical mode with the nanoparticle lifts the degeneracy of the eigenfrequency and therefore leads to mode splitting, which can be used for the detection and measurement of nanoparticles [9]. For example, WGM microtoroid resonators [18], fabricated from pure silica [9], (i.e., passive resonators with loss) and from rare-earth-ion doped silica (i.e., active resonators with optical gain) [10,11], have been used as highly sensitive sensors to count and size individual nanoparticles with a radius down to a few tens of nanometers based on the mode splitting technique in both air and liquids [9–12].
The detection limit for the mode splitting technique is set by the condition that the frequency splitting could be resolved in the transmission spectra [9]. Two main approaches have been introduced to improve the detection limit for nanoparticle sensing. One approach is to enhance light–matter interaction by reducing the mode volume [9,11] or increasing the overlap of optical modes with nanoparticles, which subsequently enhances the mode splitting. The second approach is the use of a gain medium to compensate optical losses in optical modes so that their linewidths become narrower. Below the lasing threshold, the gain compensates the losses of optical modes, increases the effective quality factor, and thus improves the resolvability [10,14]. In the lasing regime, the linewidth as narrow as several Hz could be obtained [19], hence largely improving the detection limit [11,14,15]. In all these methods, the frequency splitting in principle is proportional to the strength of perturbation introduced by the nanoparticle/biomolecule, which sets the fundamental limits of sensitivity and detection limit of a WGM nanoparticle sensor.
Recently, Wiersig reported sensitivity enhancement of nanoparticle detection with a WGM resonator by utilizing exceptional points (EPs) at which both the eigenvalues and the corresponding eigenstates of a non-Hermitian system coalesce [20–22]. It was shown that the WGM sensor at (second-order) EPs exhibits a frequency splitting proportional to the square root of the perturbation strength, whereas the response of conventional WGM sensors is proportional to the perturbation strength. Therefore, for sufficiently small perturbations, the sensors operating at EPs can exhibit much larger sensitivity than the conventional sensors. This sensitivity enhancement stems from the complex-square-root topology near EPs. Later, Chen et al. experimentally demonstrated this proposal by using a WGM microtoroid resonator at EPs to detect nanoscale objects [23]. The EP was obtained by carefully tuning two nanoscatterers within the mode volume [23,24]. The square-root dependence of the frequency splitting on the perturbation strength as well as the sensitivity enhancement compared with the conventional WGM sensors was shown. In addition, Zhang et al. provided a proposal showing the possibility of detecting nanoparticles from the far-field emission of a photonic molecule operating at an EP [25].
Sign up for Photonics Research TOC. Get the latest issue of Photonics Research delivered right to you!Sign up now
Such a complex-square-root topology can also be found in systems respecting parity-time (PT) symmetry [26,27], which was originally developed within quantum field theory and has emerged as one of the most exciting concepts in photonics in the past few years [28–37]. It was shown that the eigenvalues of non-Hermitian Hamiltonians can be entirely real if they satisfy the condition of PT-symmetry, i.e., [26,27]. With balanced gain and loss, a coupled-resonator system can serve as a good platform to implement PT-symmetry in optics [32,34,37]. Hodaei et al. demonstrated a thermal sensor with enhanced sensitivity by using PT-symmetric coupled resonators operating at the phase transition point [37]. Moreover, they also exploited the third-order exceptional points at which three eigenvalues and corresponding eigenstates coalesce to achieve even higher sensitivity that is proportional to the cube root of the perturbation strength. PT-symmetric coupled resonators can also be applied to metrology [38] and optical gyroscope [39].
In this paper, we show that a PT-symmetric system, consisting of two directly coupled resonators with balanced gain and loss, offers a promising platform to improve the detection limit for nanoparticle sensing. The PT-symmetric WGM sensor operating at the phase transition points exhibits a square-root dependence of the sensitivity on the perturbation of nanoparticles, and the sensitivity can be much larger than that of a single WGM sensor. The dependence of sensitivity enhancement on the perturbation strength and the gain (or loss) strength is also studied. With the assistance of gain in the system, the resolvability of mode splitting as well as the detection limit for nanoparticle sensing is significantly improved. Furthermore, we extend our study to multiple-nanoparticle detection and show that, in this case, the PT-symmetric WGM sensor also has larger sensitivity, compared with the single WGM sensor.
2. PT-SYMMETRIC WGM NANOPARTICLE SENSOR
The Hamiltonian of a photonic molecule consisting of two coupled resonators (i.e., and ) with resonance frequency and linewidth can be expressed as [32] , where is the coupling strength between the two resonators and the complex frequencies are and . When a nanoparticle enters the mode volume of a resonator, the backscattering of light from the nanoparticle enables coupling between the cw and ccw modes and induces mode splitting. To include the effect of the backscattering induced by the nanoparticle, the Hamiltonian of a photonic molecule sensor is extended in the traveling wave basis of , , , and and can be expressed as . The coupling between the two resonators forms four supermodes. The eigenfrequencies of the supermodes can be written as with the assumption that the two resonators have the same resonance frequency, i.e., . The four supermodes can be divided into two pairs according to the inter-cavity coupling: the first pair consists of the first and second supermodes with eigenfrequencies , , and the second pair consists of the third and fourth supermodes with eigenfrequencies , .
By properly selecting parameters , , and , the coupled resonators can work in different regimes: (i) corresponds to the case where the resonators are completely decoupled from each other, and the system is the same as the single resonator system [Figs. 1(a) and 1(b)]; (ii) , corresponds to the case where two passive (or active) resonators with the same amount of loss (or gain) are coupled to each other and form a conventional photonic molecule; (iii) , corresponds to a PT-symmetric photonic molecule with balanced gain and loss [Fig. 1(c)]; (iv) , corresponds to a coupled system with unbalanced gain and loss, which can be considered as a general non-Hermitian system.
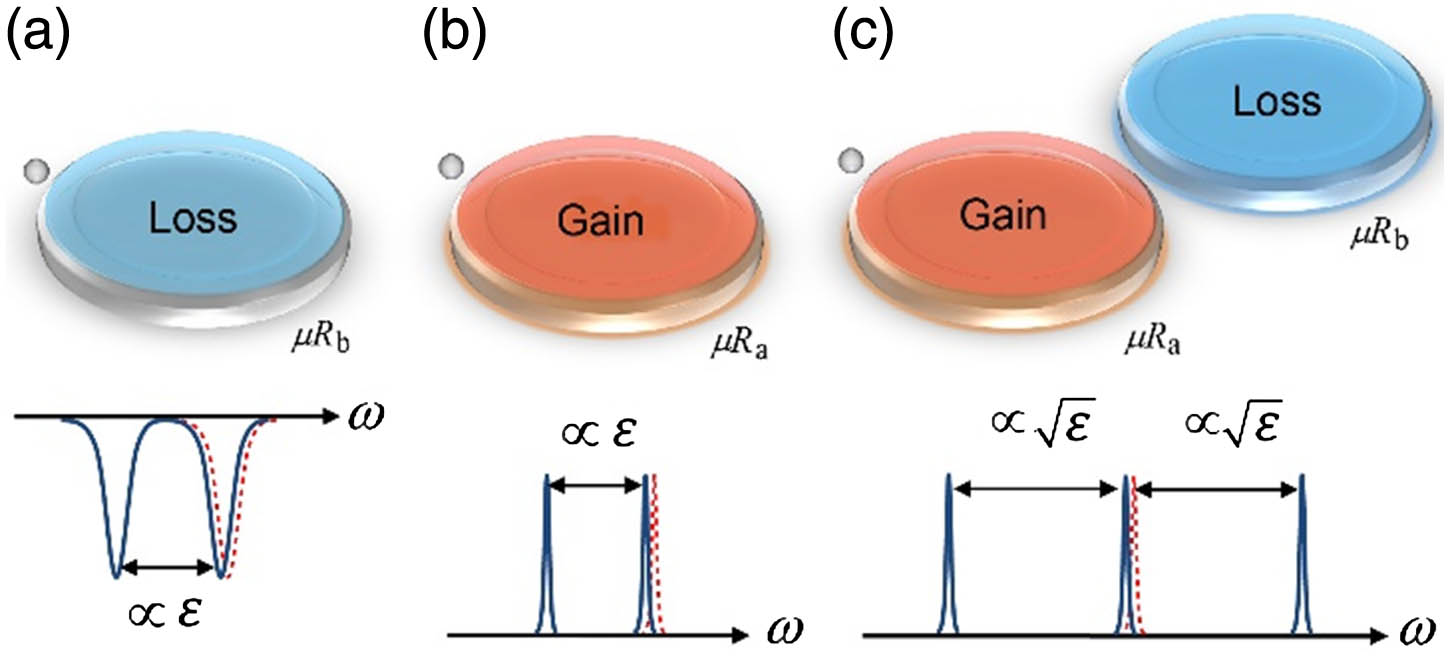
Figure 1.WGM nanoparticle sensors based on (a) the single passive resonator, (b) the single active resonator, and (c) PT-symmetric coupled resonators with balanced gain and loss. The gray-colored small circle denotes a nanoparticle within the mode volume of the resonator. The spectra illustrate sensing mechanisms of the sensors. The dashed red curve shows the spectrum before the nanoparticle binding event; the solid blue curve corresponds to the spectrum after the nanoparticle binding event. The sensors in (a) and (b) exhibit a frequency splitting proportional to , which is the perturbation strength induced by the nanoparticle. With the assistance of gain, the linewidth of the resonance mode is reduced; thus, the resolvability of mode splitting is improved in (b), compared with the sensor in (a). For the PT-symmetric sensor operating at the phase transition point, the frequency splitting induced by the nanoparticle exhibits a square-root dependence on the perturbation. For a sufficiently small perturbation, the PT-symmetric sensor exhibits much larger frequency splitting. In addition, with balanced gain and loss, the linewidth can be very narrow, which helps to resolve much smaller mode splitting.
In the PT-symmetric coupled resonators shown in Fig. 1(c), with balanced gain and loss, i.e., , the expressions for eigenfrequencies of supermodes are then written as
When the coupling strength increases from zero, the system will experience (i) the PT-symmetry broken regime with , where the eigenfrequencies are complex numbers with equal real parts but opposite imaginary parts; (ii) PT-symmetry phase transition point with , where both the eigenfrequencies and the corresponding eigenstates coalesce; (iii) PT-symmetry unbroken regime with , where the eigenfrequencies are real numbers. The evolution of eigenfrequencies of a PT-symmetric photonic molecule is given in Fig. 2.

Figure 2.Evolution of the (a) real part and (b) imaginary part of eigenfrequencies in PT-symmetric coupled resonators when the coupling strength between two resonators is varied. The PT phase transition point is obtained when the coupling strength . The symbols are the results of numerical simulations, and the color curves are theoretical predictions.
The numerical simulations were performed in COMSOL Multiphysics, where the model consists of two coupled 2D circular microdisk resonators. The two resonators have the same size with radius 5 μm and the same real part of the refractive index, which is 2. Therefore, the two resonators have the same resonance frequency. The optical modes selected for the numerical study have a wavelength of about 1.5 μm. The imaginary parts of the refractive indexes of the resonators are chosen such that one resonator has gain and the other has loss, i.e., the imaginary part of the refractive index of one resonator is positive, whereas that of the other resonator is negative. The values of the imaginary parts vary from to for different gain/loss contrast. To set the system at the phase transition point, the coupling strength is finely tuned by changing the distance between the resonators. The perturbation is introduced by placing a circular scatterer with refractive index 1.5 within the mode volume of the resonator with gain, and the perturbation strength is tuned by changing the diameter of the scatterer from several nanometers to several tens of nanometers.
3. SENSITIVITY ENHANCEMENT AT THE PT PHASE TRANSITION POINT
Without loss of generality, we assume that the resonator has optical gain, the resonator has the same amount of loss, and a nanoparticle with perturbation strength is introduced into the mode volume of the resonator [see Fig. 1(c)]. The perturbation Hamiltonian of the single nanoparticle is given by , with . Thus, the total Hamiltonian is , and the corresponding eigenfrequencies are given as
The incoming nanoparticle lifts the eigenfrequency degeneracy of the supermodes: two supermodes experience a frequency shift and linewidth change, whereas the other two supermodes are not affected and can serve as reference signals. Evolution of the real part of eigenfrequencies is shown in Fig. 3(a), with variation of the coupling strength between two resonators. Here, we define the sensitivity as the frequency shift of a supermode relative to its reference signal, i.e., the frequency splittings of these two pairs of supermodes and , which are shown in Fig. 3(b). When the coupling between the two resonators is weak, the pair of supermodes localized in the resonator is more affected by the nanoparticle, experiencing significant frequency splitting, whereas the other pair of supermodes is nearly not affected. With the increase of the coupling strength, the field localization is weakened; thus, both pairs of supermodes will be affected by the nanoparticle and hence undergo frequency splitting. The maximum frequency splitting is obtained at the PT phase transition point owing to the square-root topology of the complex energy eigensurface. When the coupling strength continues to increase, and the system enters the PT-symmetric unbroken regime, the system no longer exhibits such sensitivity enhancement. In addition, in this regime the supermodes are equally distributed among two resonators. Thus, the mode volume of the supermodes is about twice of that when the coupling strength is zero, assuming that the two coupled resonators have the same size. Then, for the same nanoparticle, the light–matter interaction strength (i.e., the frequency splitting) is about half of that in the single resonator case (i.e., the coupling strength is zero).
Figure 3.(a) Evolution of the real part of the eigenfrequencies in PT-symmetric coupled resonators with single nanoparticle located at resonator when the coupling strength is varied. Two supermodes (blue squares and red circles) are perturbed by the nanoparticle and thus experience frequency shift, whereas the other two supermodes (black squares and circles) are not affected, serving as reference signals. The size and location of the nanoparticle (i.e., perturbation strength) are fixed. (b) Absolute value of the frequency splitting of two pairs of supermodes in PT-symmetric coupled resonators when changing the coupling strength. The frequency splitting is obtained by calculating the difference between frequencies of the perturbed supermode and its reference. When the coupling strength is zero, it becomes the case of a single WGM sensor: the resonator with the nanoparticle exhibits frequency splitting, whereas the other resonator is not affected at all. At the phase transition point, the PT-symmetric sensor exhibits about twice the frequency splitting compared with the single WGM sensor subject to the same perturbation. The symbols are results from the numerical simulations, and the color curves are the theoretical predictions.
Next, we study the sensitivity enhancement for the PT-symmetric WGM sensor operating at the phase transition point, i.e., . In this case, from Eqs. (5)–(8), the eigenfrequency splitting of these two pairs of supermodes can be written as . The two pairs of supermodes in principle have different frequency splitting , which is also observed in Fig. 3(b). However, when the nanoparticle is sufficiently small, i.e., , the same amount of frequency splitting can be obtained, with . In our study, we choose the pair of supermodes exhibiting larger frequency splitting as the detection signal. Figure 4(a) shows the square-root dependence of sensitivity on the perturbation strength, which is also confirmed by the log-log plot with a linear slope 1/2 in the inset. The results of the numerical simulations agree well with the theoretical predictions.
Figure 4.(a) Dependence of sensitivity of a PT-symmetric sensor operating at the phase transition point on the perturbation strength . Inset shows the log-log plot of the dependence of the sensitivity on the perturbation strength, where a linear slope of 1/2 is clearly seen. (b) Dependences of the sensitivity enhancement on the perturbation strength (blue squares and dashed curve) and the gain strength (red circles and dashed curve). For the former one, the gain (loss) strength of the coupled resonators and the coupling strength are fixed when changing the perturbation strength . For the latter, the perturbation strength of the nanoparticle is fixed when changing the gain (loss) strength , and the coupling strength between the resonators is varied to set the system at the phase transition point. The symbols are the results of numerical simulations, and the color curves are theoretical predictions.
For a single WGM sensor with the same perturbation, the eigenfrequency splitting is . Here, we define a sensitivity enhancement factor
When the nanoparticle is small enough, so that can be approximated as a real number, and , the sensitivity enhancement factor is given by which is proportional to the square-root of gain (i.e., loss) strength and inversely proportional to the square-root of perturbation strength of the nanoparticle. The dependences of sensitivity enhancement on the perturbation strength of the nanoparticle and the gain strength within the involved mode are shown in Fig. 4(b): for a PT-symmetric sensor, larger sensitivity enhancement can be obtained for smaller perturbations; for the same perturbation, the PT-symmetric sensor with larger gain–loss contrast exhibits larger sensitivity enhancement. Fluctuations in the numerical simulations mainly come from the slight deviation of the system from the phase transition point [40].
4. IMPROVEMENT OF THE DETECTION LIMIT
The nanoparticle not only lifts the degeneracy of the real part of the eigenfrequencies in the PT-symmetric sensor but also affects the imaginary part of the eigenfrequencies, as shown in Fig. 5(a). The linewidth difference is also enhanced at the vicinity of the phase transition point [Fig. 5(b)]. Note that here the linewidth difference comes from the unmatched resonance frequencies of two coupled resonators. The loss induced by the nanoparticle is small and negligible.
Figure 5.(a) Evolution of the imaginary part of the eigenfrequencies in PT-symmetric coupled resonators with a single nanoparticle located at resonator when the coupling strength between two resonators is varied. The size and location of the nanoparticle (i.e., perturbation strength) are fixed. (b) Absolute value of the linewidth difference of two pairs of supermodes in PT-symmetric coupled resonators when changing the coupling strength. The linewidth difference is obtained by calculating the difference between the linewidths of the perturbed supermode and its reference. The symbols are results from the numerical simulations, and the color curves are theoretical predictions.
For the PT-symmetric WGM sensor in the broken-phase regime, the optical fields of one pair of supermodes grow, whereas the optical fields of the other pair decay, i.e., one pair of supermodes experiences gain, whereas the other pair feels loss [33,34]. When the system enters the PT-symmetry unbroken regime, the imaginary part of eigenfrequencies coalesces to zero, i.e., both pairs of supermodes will remain neutral. For the PT-symmetric sensor operating at the phase transition point or in its vicinity, the frequency splitting is enhanced due to the square-root topology of the complex energy eigensurface; meanwhile, the linewidth of the supermodes can be narrow due to the balanced gain and loss. As a result, the detection limit can be significantly improved.
5. DETECTION OF MULTIPLE NANOPARTICLES
For the case of detecting multiple nanoparticles, both the perturbation strength and position of each nanoparticle need to be considered. The strength of light scattering from cw mode to ccw mode is determined by the interference of scattered light from cw to ccw mode induced by each nanoparticle and vice versa. For two nanoparticles located at the resonator with perturbation strengths , , and angular positions , , as shown in Fig. 6(a), the total perturbation Hamiltonian can be written as [21] where is the azimuthal number of the involved mode. Here, we only consider the interaction between nanoparticles and optical modes, neglecting the interaction between the nanoparticles when the particles are coarsely deposited.
Figure 6.(a) Illustration of the detection of two nanoparticles in a PT-symmetric WGM nanoparticle sensor. The two nanoparticles are placed within the mode volume of the resonator with gain. (b), (c) Variation in frequency splitting as a function of the angular position of the second nanoparticle when (b) the two nanoparticles are identical with the same perturbation strength, and (c) the two nanoparticles are different and hence have different perturbation strengths. The angular position of the first nanoparticle is fixed and set to be zero. Blue squares are numerical simulation results; red solid curves are theoretical predictions. The results are normalized by the frequency splitting induced by the first nanoparticle on a single resonator sensor.
The off-diagonal element () stands for the backscattering of light from cw (ccw) to ccw (cw) mode in the resonator [21,41–43]. For sufficiently small nanoparticles, can be approximated as a real number. Thus, the strength (absolute value) of the backscattering between cw and ccw modes is always the same regardless of the sizes and the angular positions of nanoparticles. This is different from previous studies [21,41], where the nanoparticles are sufficiently large; thus, is a complex number, implying that the strength of backscattering of light between cw and ccw modes can be different when .
Two different cases are considered: (i) two identical nanoparticles with the same perturbation strength, i.e., ; and (ii) two different nanoparticles with different perturbation strengths, i.e., . The angular position of the second one is varied. The frequency splitting shown in Fig. 6 periodically changes from maximum to minimum due to constructive interference (maximum) or destructive interference (minimum) between light scattered by the two nanoparticles. For case (i), the amount of light scattered by each nanoparticle is the same. Thus, the destructive interference between the scattered light results in zero frequency splitting. However, for case (ii), the light scattering between cw and ccw modes is not balanced; therefore, the frequency splitting never reaches zero.
The above discussion can be directly extended to the case of three or more nanoparticles. The total perturbation Hamiltonian of nanoparticles is [21] where , are the perturbation strength and the angular position of the -th nanoparticle, respectively, and is the azimuthal number of the involved mode. Figure 7 shows the numerical results of the variation of frequency splitting when 10 different nanoparticles are deposited one by one at random angular positions on a PT-symmetric WGM sensor, in comparison with a single WGM sensor subject to the same nanoparticles. It is clearly seen that the PT-symmetric WGM sensor operating at the phase transition point has better sensitivity. Each discrete step in Fig. 7 corresponds to the deposition of a new nanoparticle. Because the sizes and positions of the nanoparticles are random, the heights of discrete steps (i.e., the change of frequency splitting) are different, and the frequency splitting does not have to be successively increasing [43].
Figure 7.(a) Illustration of the detection of multiple nanoparticles in a PT-symmetric WGM nanoparticle sensor. Ten different nanoparticles (numbered gray circles) are randomly deposited within the mode volume of the resonator with gain one by one. (b) Numerical results of frequency splitting variation for 10 nanoparticles deposited on the PT-symmetric WGM sensor (blue lines and squares) and a single WGM sensor (red lines and circles). The dashed vertical lines are used as eye guides. Results for the single WGM sensor are obtained by removing the lossy resonator in the numerical simulation. Results are normalized by the frequency splitting induced by the first nanoparticle deposited on a single WGM sensor with a value of 73 MHz.
The first nanoparticle entering the mode volume of the PT-symmetric WGM sensor will be detected with the maximal enhancement due to the square-root topology and move the system away from the phase transition point. The second and the consecutive nanoparticles will start with a system that is not exactly at the phase transition point but away from it, depending on the amount of the perturbation induced by the nanoparticles. The sensitivity enhancement can still be obtained provided that the total perturbation of the nanoparticles remains small compared with the gain (or loss) strength in the PT-symmetric sensor [20].
6. CONCLUSION
In summary, we study nanoparticle detection using PT-symmetric WGM sensors operating at the phase transition points, where significant enhancement of detection sensitivity is predicted for small perturbations. We have confirmed this enhancement and its dependence on the perturbation strength and the gain (loss) strength through both theoretical analysis and numerical simulations. Two mechanisms contribute to the improvement of detection limit using the PT-symmetric WGM sensor: the first is the square-root topology of complex energy eigensurfaces in the parameter space; the second is the narrow linewidth of the system due to the gain. In addition to the study of single nanoparticle detection, we have also derived a theoretical model and performed numerical simulations to study a multi-nanoparticle detection scenario where the nanoparticles fall onto the PT-symmetric sensor one by one. Our results clearly show that the sensing performance of a PT-symmetric sensor operating at the phase transition point surpasses that of conventional configurations.
It is worth noting that single passive or active WGM resonators have already been used for nanoparticle detection [9,11,14,15], and PT-symmetric WGM resonators have also been realized in different configurations [32–34]. Each of the two resonators could be associated with a micro-heater for thermal tuning so that the frequency detuning between the two resonators can be tuned to zero [44]. The sensitivity enhancement achieved in practice could be affected by the stability of the system, environmental noise, etc. But, overall, the required experimental platforms are readily available to test the capability of PT-symmetric systems for nanoparticle detection.
Acknowledgment
Acknowledgment. J. Zhang is supported by the NSFC. X. Fan is supported by the NSF.
References
[1] K. J. Vahala. Optical microcavities. Nature, 424, 839-846(2003).
[2] T. J. Kippenberg, S. M. Spillane, D. K. Armani, K. J. Vahala. Ultralow-threshold microcavity Raman laser on a microelectronic chip. Opt. Lett., 29, 1224-1226(2004).
[3] L. Yang, T. Carmon, B. Min, S. M. Spillane, K. J. Vahala. Erbium-doped and Raman microlasers on a silicon chip fabricated by the sol-gel process. Appl. Phys. Lett., 86, 091114(2005).
[4] T. J. Kippenberg, K. J. Vahala. Cavity opto-mechanics. Opt. Express, 15, 17172-17205(2007).
[5] T. Aoki, B. Dayan, E. Wilcut, W. P. Bowen, A. S. Parkins, T. J. Kippenberg, K. J. Vahala, H. J. Kimble. Observation of strong coupling between one atom and a monolithic microresonator. Nature, 443, 671-674(2006).
[6] F. Monifi, J. Friedlein, Ş. K. Özdemir, L. Yang. A robust and tunable add-drop filter using whispering gallery mode microtoroid resonator. J. Lightwave Technol., 30, 3306-3315(2012).
[7] F. Monifi, Ş. K. Özdemir, L. Yang. Tunable add-drop filter using an active whispering gallery mode microcavity. Appl. Phys. Lett., 103, 181103(2013).
[8] F. Vollmer, S. Arnold. Whispering-gallery-mode biosensing: label-free detection down to single molecules. Nat. Methods, 5, 591-596(2008).
[9] J. Zhu, Ş. K. Özdemir, Y. F. Xiao, L. Li, L. He, D. R. Chen, L. Yang. On-chip single nanoparticle detection and sizing by mode splitting in an ultrahigh-Q microresonator. Nat. Photonics, 4, 46-49(2010).
[10] L. He, Ş. K. Özdemir, J. Zhu, L. Yang. Ultrasensitive detection of mode splitting in active optical microcavities. Phys. Rev. A, 82, 053810(2010).
[11] L. He, Ş. K. Özdemir, J. Zhu, W. Kim, L. Yang. Detecting single viruses and nanoparticles using whispering gallery microlasers. Nat. Nanotechnol., 6, 428-432(2011).
[12] W. Kim, Ş. K. Özdemir, J. Zhu, F. Monifi, C. Coban, L. Yang. Detection and size measurement of individual hemozoin nanocrystals in aquatic environment using a whispering gallery mode resonator. Opt. Express, 20, 29426-29446(2012).
[13] F. Vollmer, L. Yang. Label-free detection with high-Q microcavities: a review of biosensing mechanisms for integrated devices. Nanophotonics, 1, 267-291(2012).
[14] Ş. K. Özdemir, J. Zhu, X. Yang, B. Peng, H. Yilmaz, L. He, F. Monifi, S. H. Huang, G. L. Long, L. Yang. Highly sensitive detection of nanoparticles with a self-referenced and self-heterodyned whispering-gallery Raman microlaser. Proc. Natl. Acad. Sci. USA, 111, E3836-E3844(2014).
[15] B. B. Li, W. R. Clements, X. C. Yu, K. Shi, Q. H. Gong, Y. F. Xiao. Single nanoparticle detection using split-mode microcavity Raman lasers. Proc. Natl. Acad. Sci. USA, 111, 14657-14662(2014).
[16] M. R. Foreman, J. D. Swaim, F. Vollmer. Whispering gallery mode sensors. Adv. Opt. Photon., 7, 168-240(2015).
[17] X. Fan, I. M. White, S. I. Shopova, H. Zhu, J. D. Suter, Y. Sun. Sensitive optical biosensors for unlabeled targets: a review. Anal. Chim. Acta, 620, 8-26(2008).
[18] D. K. Armani, T. J. Kippenberg, S. M. Spillane, K. J. Vahala. Ultra-high-Q toroid microcavity on a chip. Nature, 421, 925-928(2003).
[19] T. Lu, L. Yang, T. Carmon, B. Min. A narrow-linewidth on-chip toroid Raman laser. IEEE J. Quantum Electron., 47, 320-326(2011).
[20] J. Wiersig. Enhancing the sensitivity of frequency and energy splitting detection by using exceptional points: application to microcavity sensors for single-particle detection. Phys. Rev. Lett., 112, 203901(2014).
[21] J. Wiersig. Structure of whispering-gallery modes in optical microdisks perturbed by nanoparticles. Phys. Rev. A, 84, 063828(2011).
[22] J. Wiersig. Sensors operating at exceptional points: general theory. Phys. Rev. A, 93, 033809(2016).
[23] W. Chen, Ş. K. Özdemir, G. Zhao, J. Wiersig, L. Yang. Exceptional points enhance sensing in an optical microcavity. Nature, 548, 192-196(2017).
[24] B. Peng, Ş. K. Özdemir, M. Liertzer, W. Chen, J. Kramer, H. Yilmaz, J. Wiersig, S. Rotter, L. Yang. Chiral modes and directional lasing at exceptional points. Proc. Natl. Acad. Sci. USA, 113, 6845-6850(2016).
[25] N. Zhang, S. Liu, K. Wang, Z. Gu, M. Li, N. Yi, S. Xiao, Q. Song. Single nanoparticle detection using far-field emission of photonic molecule around the exceptional point. Sci. Rep., 5, 11912(2015).
[26] C. M. Bender, S. Boettcher. Real spectra in non-Hermitian Hamiltonians having PT symmetry. Phys. Rev. Lett., 80, 5243-5246(1998).
[27] C. M. Bender. Making sense of non-Hermitian Hamiltonians. Rep. Prog. Phys., 70, 947-1018(2007).
[28] A. Guo, G. J. Salamo, D. Duchesne, R. Morandotti, M. Volatier-Ravat, V. Aimez, G. A. Siviloglou, D. N. Christodoulides. Observation of PT-symmetry breaking in complex optical potentials. Phys. Rev. Lett., 103, 093902(2009).
[29] C. E. Rüter, K. G. Makris, R. El-Ganainy, D. N. Christodoulides, M. Segev, D. Kip. Observation of parity-time symmetry in optics. Nat. Phys., 6, 192-195(2010).
[30] A. Regensburger, C. Bersch, M. A. Miri, G. Onishchukov, D. N. Christodoulides, U. Peschel. Parity-time synthetic photonic lattices. Nature, 488, 167-171(2012).
[31] L. Feng, Y. L. Xu, W. S. Fegadolli, M. H. Lu, J. E. B. Oliveira, V. R. Almeida, Y. F. Chen, A. Scherer. Experimental demonstration of a unidirectional reflectionless parity-time metamaterial at optical frequencies. Nat. Mater., 12, 108-113(2013).
[32] B. Peng, Ş. K. Özdemir, F. Lei, F. Monifi, M. Gianfreda, G. L. Long, S. Fan, F. Nori, C. M. Bender, L. Yang. Parity-time-symmetric whispering-gallery microcavities. Nat. Phys., 10, 394-398(2014).
[33] L. Feng, Z. J. Wong, R. M. Ma, Y. Wang, X. Zhang. Single-mode laser by parity-time symmetry breaking. Science, 346, 972-975(2014).
[34] H. Hodaei, M. A. Miri, M. Heinrich, D. N. Christodoulides, M. Khajavikhan. Parity-time-symmetric microring lasers. Science, 346, 975-978(2014).
[35] B. Zhen, C. W. Hsu, Y. Igarashi, L. Lu, I. Kaminer, A. Pick, S. L. Chua, J. D. Joannopoulos, M. Soljačić. Spawning rings of exceptional points out of Dirac cones. Nature, 525, 354-358(2015).
[36] M. Wimmer, A. Regensburger, M. A. Miri, C. Bersch, D. N. Christodoulides, U. Peschel. Observation of optical solitons in PT-symmetric lattices. Nat. Commun., 6, 7782(2015).
[37] H. Hodaei, A. U. Hassan, S. Wittek, H. Garcia-Gracia, R. El-Ganainy, D. N. Christodoulides, M. Khajavikhan. Enhanced sensitivity at higher-order exceptional points. Nature, 548, 187-191(2017).
[38] Z. P. Liu, J. Zhang, Ş. K. Özdemir, B. Peng, H. Jing, X. Y. Lü, C. W. Li, L. Yang, F. Nori, Y. X. Liu. Metrology with PT-symmetric cavities: enhanced sensitivity near the PT-phase transition. Phys. Rev. Lett., 117, 110802(2016).
[39] J. Ren, H. Hodaei, G. Harari, A. U. Hassan, W. Chow, M. Soltani, D. N. Christodoulides, M. Khajavikhan. Ultrasensitive micro-scale parity-time-symmetric ring laser gyroscope. Opt. Lett., 42, 1556-1559(2017).
[40] H. Benisty, C. Yan, A. Degiron, A. T. Lupu. Healing near-PT-symmetric structures to restore their characteristic singularities: analysis and examples. J. Lightwave Technol., 30, 2675-2683(2012).
[41] J. Zhu, Ş. K. Özdemir, L. He, L. Yang. Controlled manipulation of mode splitting in an optical microcavity by two Rayleigh scatterers. Opt. Express, 18, 23535-23543(2010).
[42] X. Yi, Y. F. Xiao, Y. C. Liu, B. B. Li, Y. L. Chen, Y. Li, Q. H. Gong. Multiple-Rayleigh-scatterer-induced mode splitting in a high-Q whispering-gallery-mode microresonator. Phys. Rev. A, 83, 023803(2011).
[43] J. Zhu, Ş. K. Özdemir, L. He, D. R. Chen, L. Yang. Single virus and nanoparticle size spectrometry by whispering-gallery-mode microcavities. Opt. Express, 19, 16195-16206(2011).
[44] C. Qiu, J. Shu, Z. Li, X. Zhang, Q. Xu. Wavelength tracking with thermally controlled silicon resonators. Opt. Express, 19, 5143-5148(2011).


