• Photonics Research
  • Vol. 10, Issue 2, 433 (2022)
Guan Wang1、2、†, Zhongwang Pang1、2、†, Bohan Zhang1, Fangmin Wang1、2, Yufeng Chen1、2, Hongfei Dai1、2, Bo Wang1、2、*, and Lijun Wang1、2
Author Affiliations
  • 1State Key Laboratory of Precision Measurement Technology and Instruments, Department of Precision Instrument, Tsinghua University, Beijing 100084, China
  • 2Key Laboratory of Photonic Control Technology (Tsinghua University), Ministry of Education, Beijing 100084, China
  • show less
    DOI: 10.1364/PRJ.443019 Cite this Article Set citation alerts
    Guan Wang, Zhongwang Pang, Bohan Zhang, Fangmin Wang, Yufeng Chen, Hongfei Dai, Bo Wang, Lijun Wang. Time shifting deviation method enhanced laser interferometry: ultrahigh precision localizing of traffic vibration using an urban fiber link[J]. Photonics Research, 2022, 10(2): 433 Copy Citation Text show less
    Layout of the urban fiber test platform and scenarios of detected vibration events. (a) The fiber-based time-frequency network in Beijing mainly connecting Tsinghua University (THU) with the National Institute of Metrology (NIM), Beijing Satellite Navigation Center (BSNC), and Beijing Institute of Radio Metrology and Measurement (BIRM), respectively. To make a preliminary study of traffic monitoring, Urban Link 1 is chosen, which surrounds a relatively quiet area (the Olympic Stadium, education zones, and green parks). (b) The test scenario in campus. A part of armored fiber cable is placed through a speed bump of the road, from which we can localize vibrations of passing vehicles. (c) The test scenario on Urban Link 1. At the fourth ring road, a pedestrian underpass is in the way of the fiber link. Passing vehicles directly above this section generate vibrations which will be detected by the interferometry system.
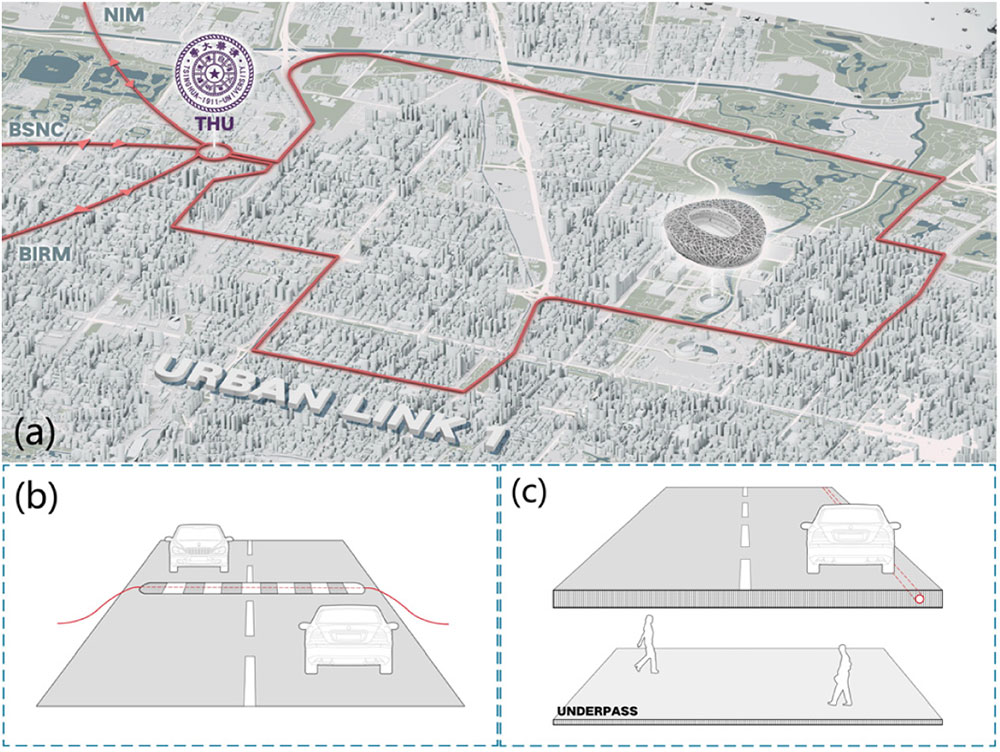
    Fig. 1. Layout of the urban fiber test platform and scenarios of detected vibration events. (a) The fiber-based time-frequency network in Beijing mainly connecting Tsinghua University (THU) with the National Institute of Metrology (NIM), Beijing Satellite Navigation Center (BSNC), and Beijing Institute of Radio Metrology and Measurement (BIRM), respectively. To make a preliminary study of traffic monitoring, Urban Link 1 is chosen, which surrounds a relatively quiet area (the Olympic Stadium, education zones, and green parks). (b) The test scenario in campus. A part of armored fiber cable is placed through a speed bump of the road, from which we can localize vibrations of passing vehicles. (c) The test scenario on Urban Link 1. At the fourth ring road, a pedestrian underpass is in the way of the fiber link. Passing vehicles directly above this section generate vibrations which will be detected by the interferometry system.
    Experimental setup of laser interferometer and the schematic diagram of vibration localization principle. (a) The vibration detection system consists of three parts: optical system, sensing ring, and data processing part. Optical system: laser (1550 nm laser module), acousto-optical modulator (AOM), synthesizer (providing shifter frequency for AOM), photodiode (PD). Sensing ring: in-lab test, campus test, and urban link test are carried out, respectively. Data processing part: data acquisition (DAQ) system, field programmable gate array (FPGA), computer for data processing (PC). (b) The principle of vibration localization is using the counter-propagating beams to detect the vibration event happening at t0. The optical path lengths between the vibration point and PD 1, PD 2 are Δ1 and Δ2, respectively. Thus, the arrival times of two beams with vibration caused phase change are t1=t0+Δ1/c and t2=t0+Δ2/c. The time delay τ0=t2−t1 can be used to localize the vibration.
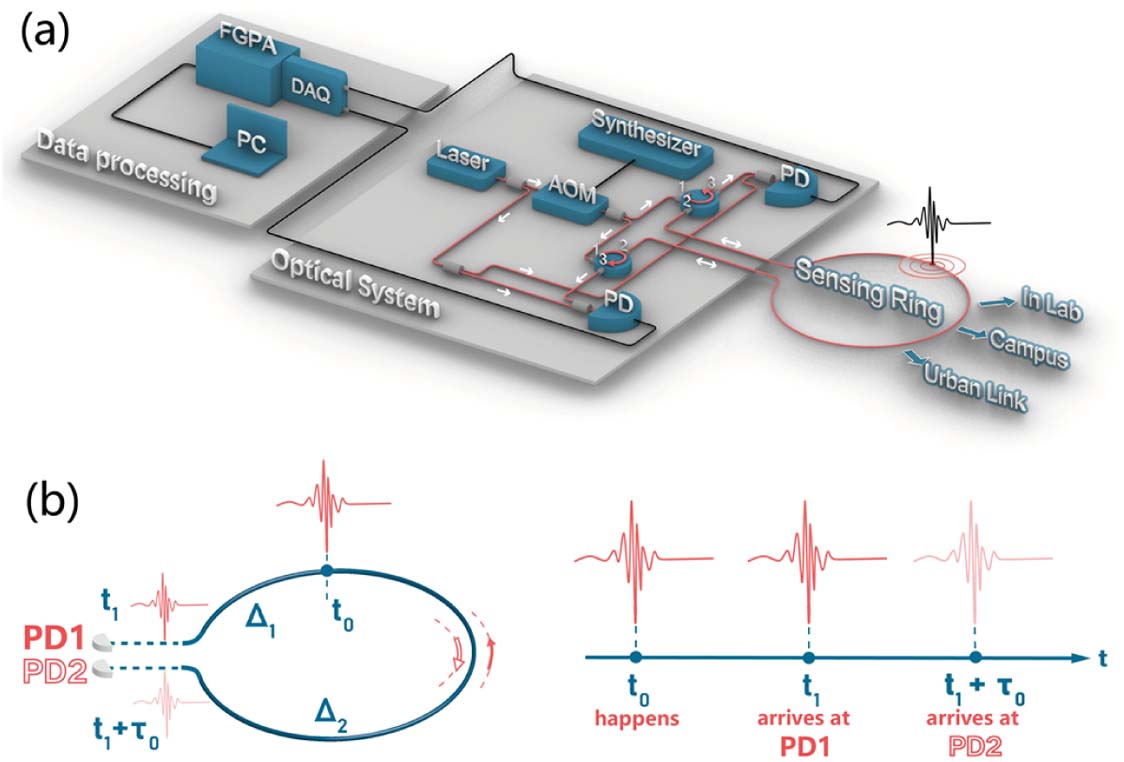
    Fig. 2. Experimental setup of laser interferometer and the schematic diagram of vibration localization principle. (a) The vibration detection system consists of three parts: optical system, sensing ring, and data processing part. Optical system: laser (1550 nm laser module), acousto-optical modulator (AOM), synthesizer (providing shifter frequency for AOM), photodiode (PD). Sensing ring: in-lab test, campus test, and urban link test are carried out, respectively. Data processing part: data acquisition (DAQ) system, field programmable gate array (FPGA), computer for data processing (PC). (b) The principle of vibration localization is using the counter-propagating beams to detect the vibration event happening at t0. The optical path lengths between the vibration point and PD 1, PD 2 are Δ1 and Δ2, respectively. Thus, the arrival times of two beams with vibration caused phase change are t1=t0+Δ1/c and t2=t0+Δ2/c. The time delay τ0=t2t1 can be used to localize the vibration.
    Diagram of the sensing ring and detection results of in-lab demonstration. (a) The sensing ring consists of a 50 km fiber spool, a fiber stretcher (FST), and a fiber spool L. (b) The phase change detected by the CCW beam (blue) and the CW beam (red). (c) The localization results of the 50–10 km scheme, in which the hollow circle points represent the discrete distribution frequency and the lines are the fitted probability density curve. Red plots: using the TSDEV method. Blue plots: using the cross-correlation (Xcorr) method with signal segments of Cutoff 1. Black plots: using the Xcorr method with signal segments of Cutoff 2. The measurement in the 50–10 km test is repeated 277 times. (d) The fitted probability distribution curves of the 50–10 km (blue) and the 50–50 km (red) scheme results (using the TSDEV method). The table inside shows the widths of the fitting curve corresponding to the 1, 2, and 3 Stds. The measurement in the 50–50 km test is repeated 175 times.
    Fig. 3. Diagram of the sensing ring and detection results of in-lab demonstration. (a) The sensing ring consists of a 50 km fiber spool, a fiber stretcher (FST), and a fiber spool L. (b) The phase change detected by the CCW beam (blue) and the CW beam (red). (c) The localization results of the 50–10 km scheme, in which the hollow circle points represent the discrete distribution frequency and the lines are the fitted probability density curve. Red plots: using the TSDEV method. Blue plots: using the cross-correlation (Xcorr) method with signal segments of Cutoff 1. Black plots: using the Xcorr method with signal segments of Cutoff 2. The measurement in the 50–10 km test is repeated 277 times. (d) The fitted probability distribution curves of the 50–10 km (blue) and the 50–50 km (red) scheme results (using the TSDEV method). The table inside shows the widths of the fitting curve corresponding to the 1, 2, and 3 Stds. The measurement in the 50–50 km test is repeated 175 times.
    Diagram of the sensing ring and detection results of the campus test. (a) The sensing ring consists of a 50 km fiber spool in lab, an 800 m fiber cable in campus, and a 10 km fiber spool in lab. A 9 m part of the 800 m fiber cable is placed through the speed bump of the campus road to detect passing vehicles running in Direction 1 and Direction 2. (b) The phase change detected by the CCW beam (blue) and the CW beam (red), with time delay τ0. The two envelopes correspond to vibrations caused by front and rear wheels of passing vehicles. (c) The localization results of the campus test. Red bars: the distribution frequency of Direction 1. Red line: the fitted probability density curve. Blue bars: the distribution frequency of Direction 2. Blue line: the fitted probability density curve. The measurement in the campus test is repeated 56 times.
    Fig. 4. Diagram of the sensing ring and detection results of the campus test. (a) The sensing ring consists of a 50 km fiber spool in lab, an 800 m fiber cable in campus, and a 10 km fiber spool in lab. A 9 m part of the 800 m fiber cable is placed through the speed bump of the campus road to detect passing vehicles running in Direction 1 and Direction 2. (b) The phase change detected by the CCW beam (blue) and the CW beam (red), with time delay τ0. The two envelopes correspond to vibrations caused by front and rear wheels of passing vehicles. (c) The localization results of the campus test. Red bars: the distribution frequency of Direction 1. Red line: the fitted probability density curve. Blue bars: the distribution frequency of Direction 2. Blue line: the fitted probability density curve. The measurement in the campus test is repeated 56 times.
    Diagram of the sensing ring and detection results of the urban link test. (a) The sensing ring consists of a 10 km fiber spool in lab and a 31.42 km Urban Link 1. A vibration source (pedestrian underpass) is localized at point 15.749 km away from Tsinghua Campus, clockwise along the link. (b) Top part: the detected phase change from 21:00 to 3:00. Middle part: two segments of typical vibrations before 23:00 and after 24:00. Bottom part: sketch maps of traffic flow before and after 23:00.
    Fig. 5. Diagram of the sensing ring and detection results of the urban link test. (a) The sensing ring consists of a 10 km fiber spool in lab and a 31.42 km Urban Link 1. A vibration source (pedestrian underpass) is localized at point 15.749 km away from Tsinghua Campus, clockwise along the link. (b) Top part: the detected phase change from 21:00 to 3:00. Middle part: two segments of typical vibrations before 23:00 and after 24:00. Bottom part: sketch maps of traffic flow before and after 23:00.
    Diagram of the localizing procedure, using the demodulated phase change signals x1(t) and x2(t) to localize the vibration Δ1.
    Fig. 6. Diagram of the localizing procedure, using the demodulated phase change signals x1(t) and x2(t) to localize the vibration Δ1.
    Detection results of the 50–50 km scheme in-lab demonstration. The red hollow circle points are the distribution frequency using the TSDEV method, and the red line is the fitted probability density curve.
    Fig. 7. Detection results of the 50–50 km scheme in-lab demonstration. The red hollow circle points are the distribution frequency using the TSDEV method, and the red line is the fitted probability density curve.
    Localization results of the campus test using the cross-correlation method. Red bars: the distribution frequency of Direction 1. Red line: the fitted probability density curve. Blue bars: the distribution frequency of Direction 2. Blue line: the fitted probability density curve.
    Fig. 8. Localization results of the campus test using the cross-correlation method. Red bars: the distribution frequency of Direction 1. Red line: the fitted probability density curve. Blue bars: the distribution frequency of Direction 2. Blue line: the fitted probability density curve.
    Detection results of the urban link test. The blue bars are the distribution frequency of vibrations on Urban Link 1, and the blue line is the fitted probability density curve.
    Fig. 9. Detection results of the urban link test. The blue bars are the distribution frequency of vibrations on Urban Link 1, and the blue line is the fitted probability density curve.
    Photos of the traffic condition at the target vibration location. (a) The typical traffic picture before 23:00. Vehicles on the road are mainly light-weight cars, which will cause low-amplitude high-frequency fluctuations. (b) The typical traffic picture after 24:00. Cargo lorries are permitted to enter the downtown city, which will produce high-amplitude low-frequency shockwaves.
    Fig. 10. Photos of the traffic condition at the target vibration location. (a) The typical traffic picture before 23:00. Vehicles on the road are mainly light-weight cars, which will cause low-amplitude high-frequency fluctuations. (b) The typical traffic picture after 24:00. Cargo lorries are permitted to enter the downtown city, which will produce high-amplitude low-frequency shockwaves.
    Guan Wang, Zhongwang Pang, Bohan Zhang, Fangmin Wang, Yufeng Chen, Hongfei Dai, Bo Wang, Lijun Wang. Time shifting deviation method enhanced laser interferometry: ultrahigh precision localizing of traffic vibration using an urban fiber link[J]. Photonics Research, 2022, 10(2): 433
    Download Citation