
Qilin Duan, Yali Zeng, Yuhang Yin, Jinying Xu, Zhining Chen, Zhanlei Hao, Huanyang Chen, Yineng Liu, "Photonic crystal slabs with maximal chiroptical response empowered by bound states in the continuum," Photonics Res. 11, 1919 (2023)
- Photonics Research
- Vol. 11, Issue 11, 1919 (2023)
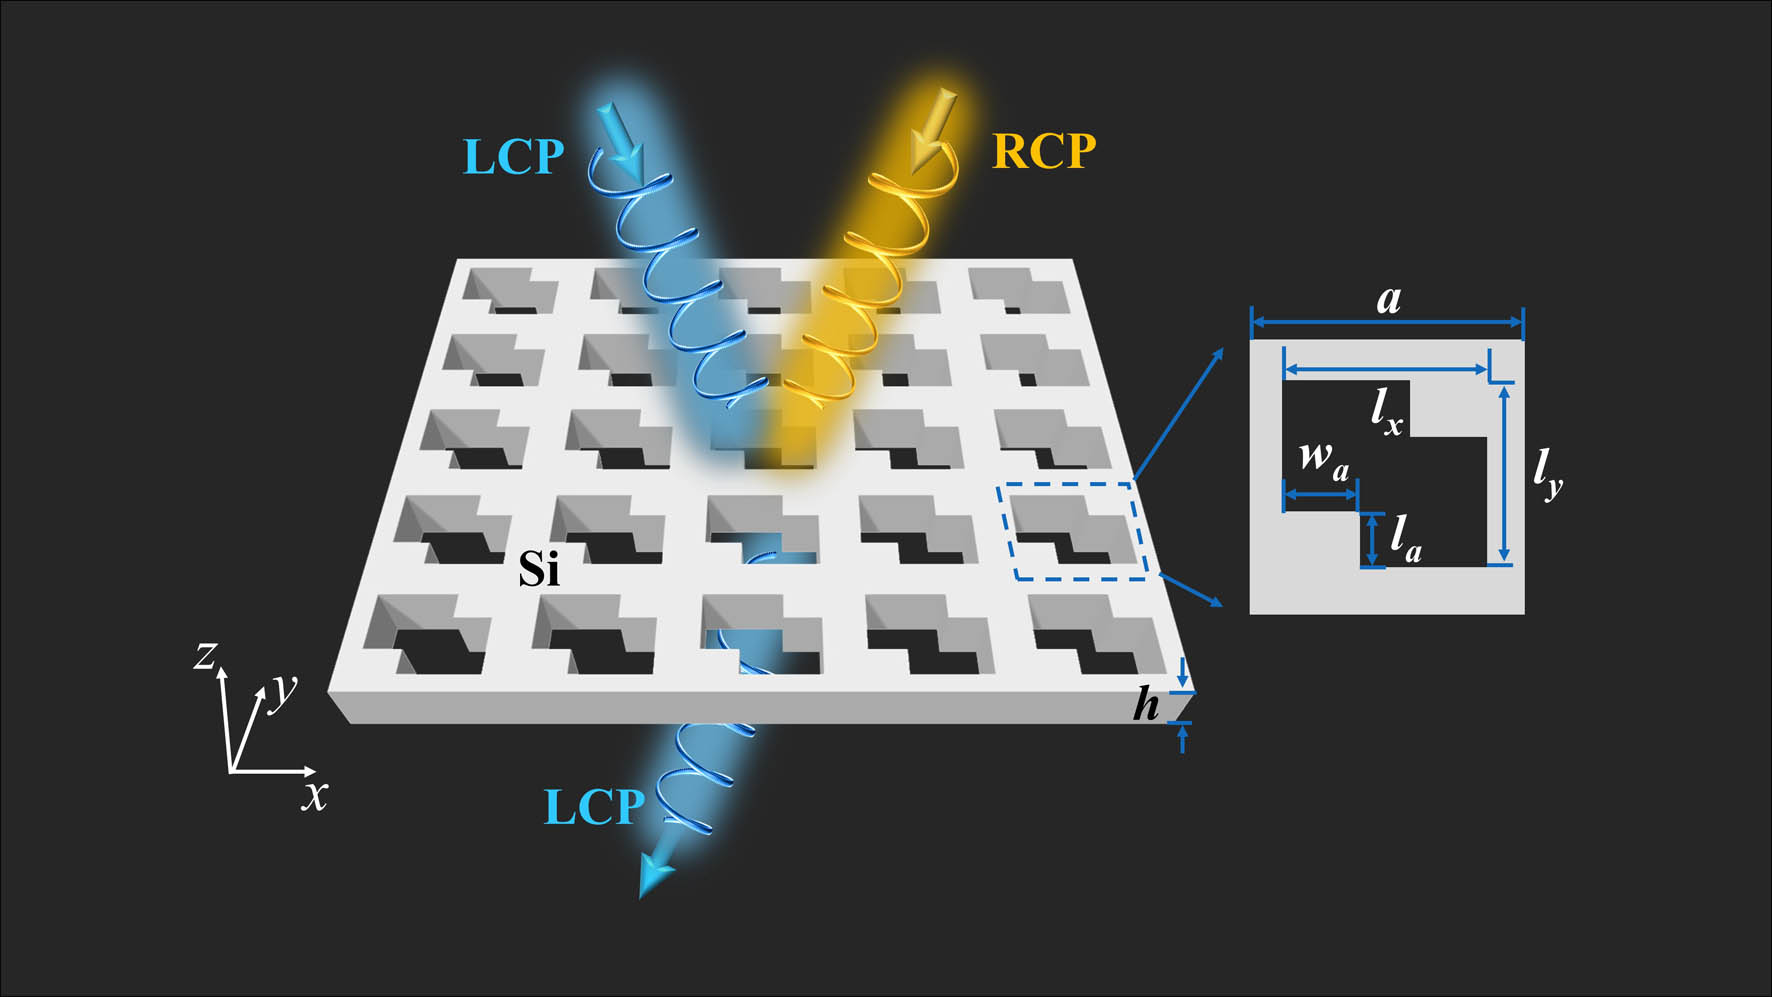
Fig. 1. Schematic illustration of the chiral quasi-BIC photonic crystal slab (PhCs) with perforating holes. The yellow and blue colors represent the RCP and LCP lights, respectively. The inset shows the in-plane unit cell.
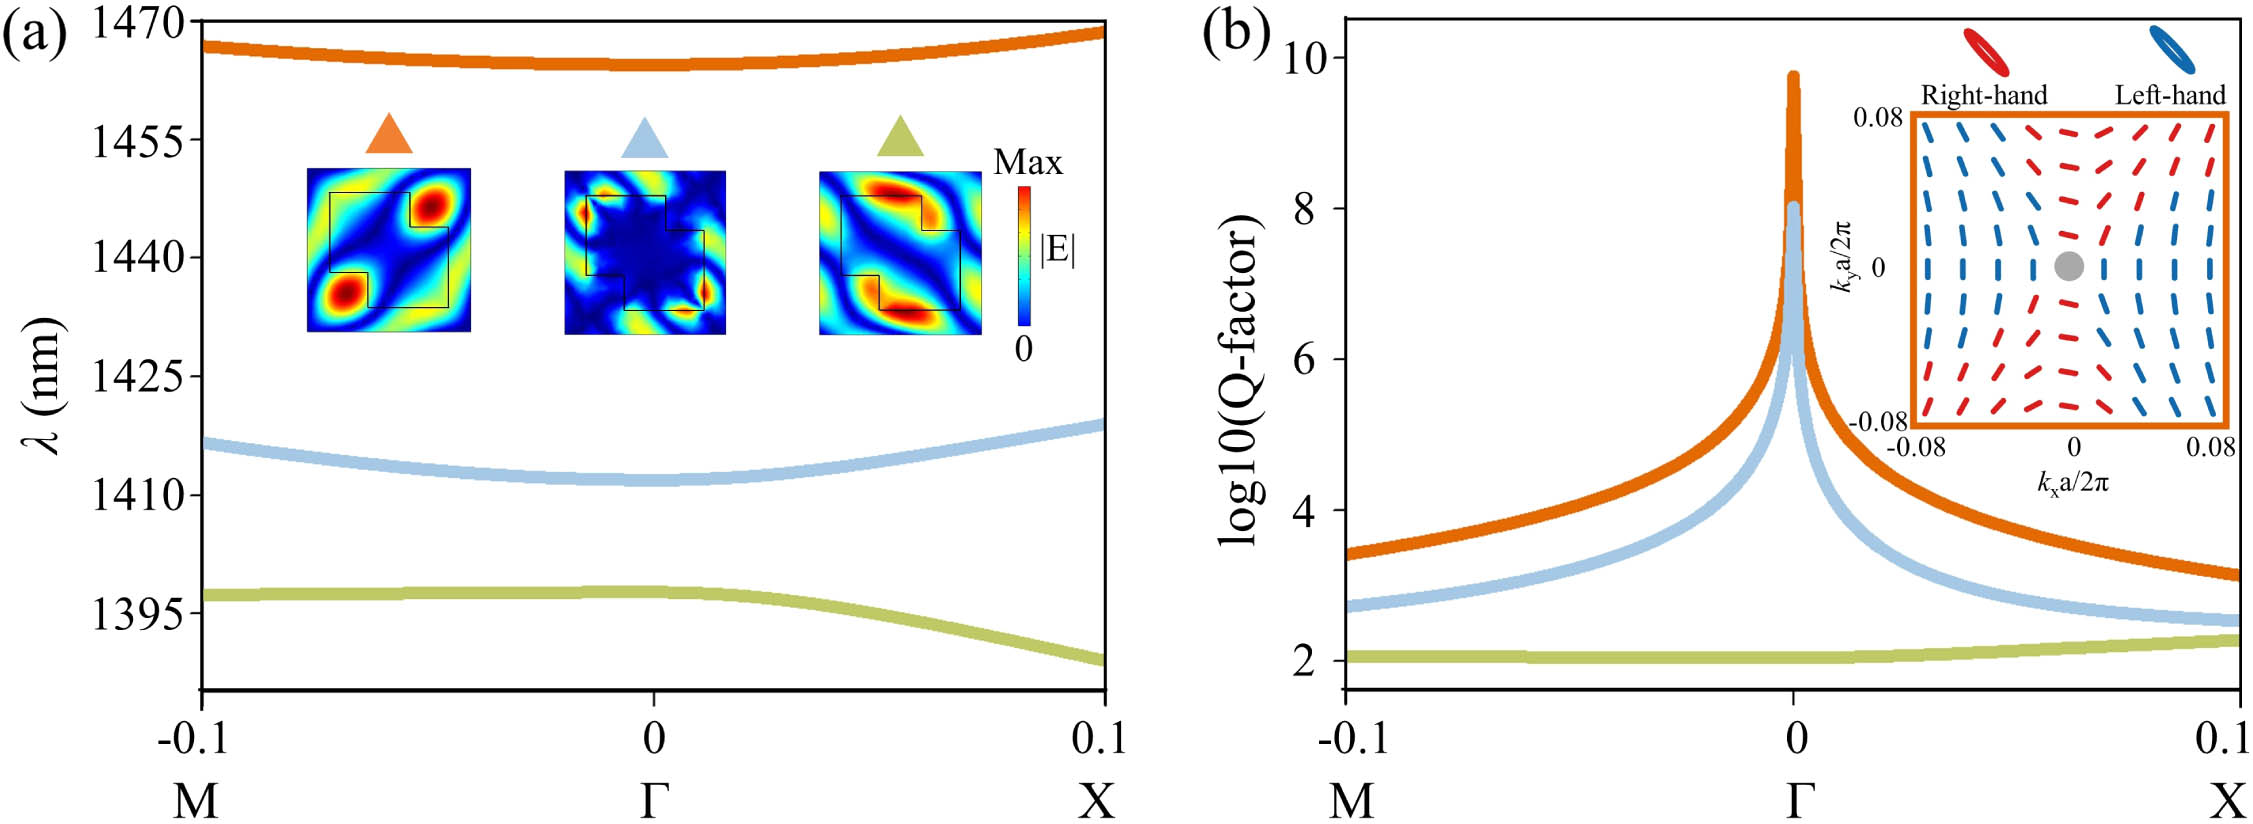
Fig. 2. Bandstructures and Q a = 795 nm h = 430 nm l a = 170 nm w a = 186.5 nm l x = 580 nm l y = 560 nm Γ Γ Q
Fig. 3. Extrinsic and intrinsic chiroptical response of the quasi-BIC via pure TM mode. (a), (e) Schematics of the oblique and normal incidence at the PhC. (b) Extrinsic CD spectra with the variation of incident angle θ φ = 0 ° δ T RR T RL T LL T LR θ = 9 ° δ = 60 nm Q θ δ
Fig. 4. Extrinsic chirality with parameters a = 795 nm h = 650 nm l a = 157 nm w a = 202 nm l x = 575 nm l y = 565 nm φ T RR T RL T LL T LR
Fig. 5. Intrinsic chirality of TE and TM coupling modes with parameters a = 795 nm h = 685 nm l a = 157 nm w a = 202 nm l x = 575 nm l y = 565 nm Γ δ Q δ = 90 nm Γ δ Γ δ δ
Fig. 6. (a) Schematic of the CMT for extrinsic optical chirality along the positive k ∥
Fig. 7. (a)–(c) Fitting results of the CMT for extrinsic chirality utilizing Eq. (A14 ), corresponding to Fig. 3 (c) in the main text at λ = 1476.5 nm
Fig. 8. Transmittance spectra T RR T RL T LL T LR θ Q θ = 0.4 °
Fig. 9. CD spectra with the variation of azimuthal angle φ θ = 9 °
Fig. 10. (a)–(c) Fitting results of the TCMT for intrinsic chirality utilizing Eq. (B13 ), corresponding to Fig. 3 (g) in the main text.
Fig. 11. Transmittance spectra T RR T RL T LL T LR δ Q δ = 2 nm
Fig. 12. Far-field polarization diagrams in momentum space with different δ
Fig. 13. Multipole contributions of the PhC (a) under oblique incidence (φ = 0 ° θ = 9 ° δ = 0 nm φ = 0 ° θ = 0 ° δ = 60 nm Γ - X δ = 60 nm Γ z H x H y x - y z = 0 nm
Fig. 14. Multipole contributions of the PhC under oblique incidence at (a) k 1 k 2 4 (a) under LCP and RCP excitation, respectively; the black dotted lines indicate the peak of the CD. Electric field distributions at the peak of CD are extracted from (b), (e) x - y z = 0 y - z x = − 280 nm H x H y
Fig. 15. Multipole contributions of the PhC under LCP excitation with (a)–(d) δ = 20 nm
Fig. 16. Normalized multipole contributions of the PhC under LCP excitation at the wavelength of the peak of the CD for δ = 20 nm


Set citation alerts for the article
Please enter your email address

© Copyright 2018-2021 | Chinese Laser Press. All Rights Reserved 沪ICP备15018463号-20