
Gang Li, Zhenyang Gao, Xinchun Zhang, Huaixin Zhao, Zhuo Liu. Improved Global Convolutional Network for Pavement Crack Detection[J]. Laser & Optoelectronics Progress, 2020, 57(8): 081011
- Laser & Optoelectronics Progress
- Vol. 57, Issue 8, 081011 (2020)
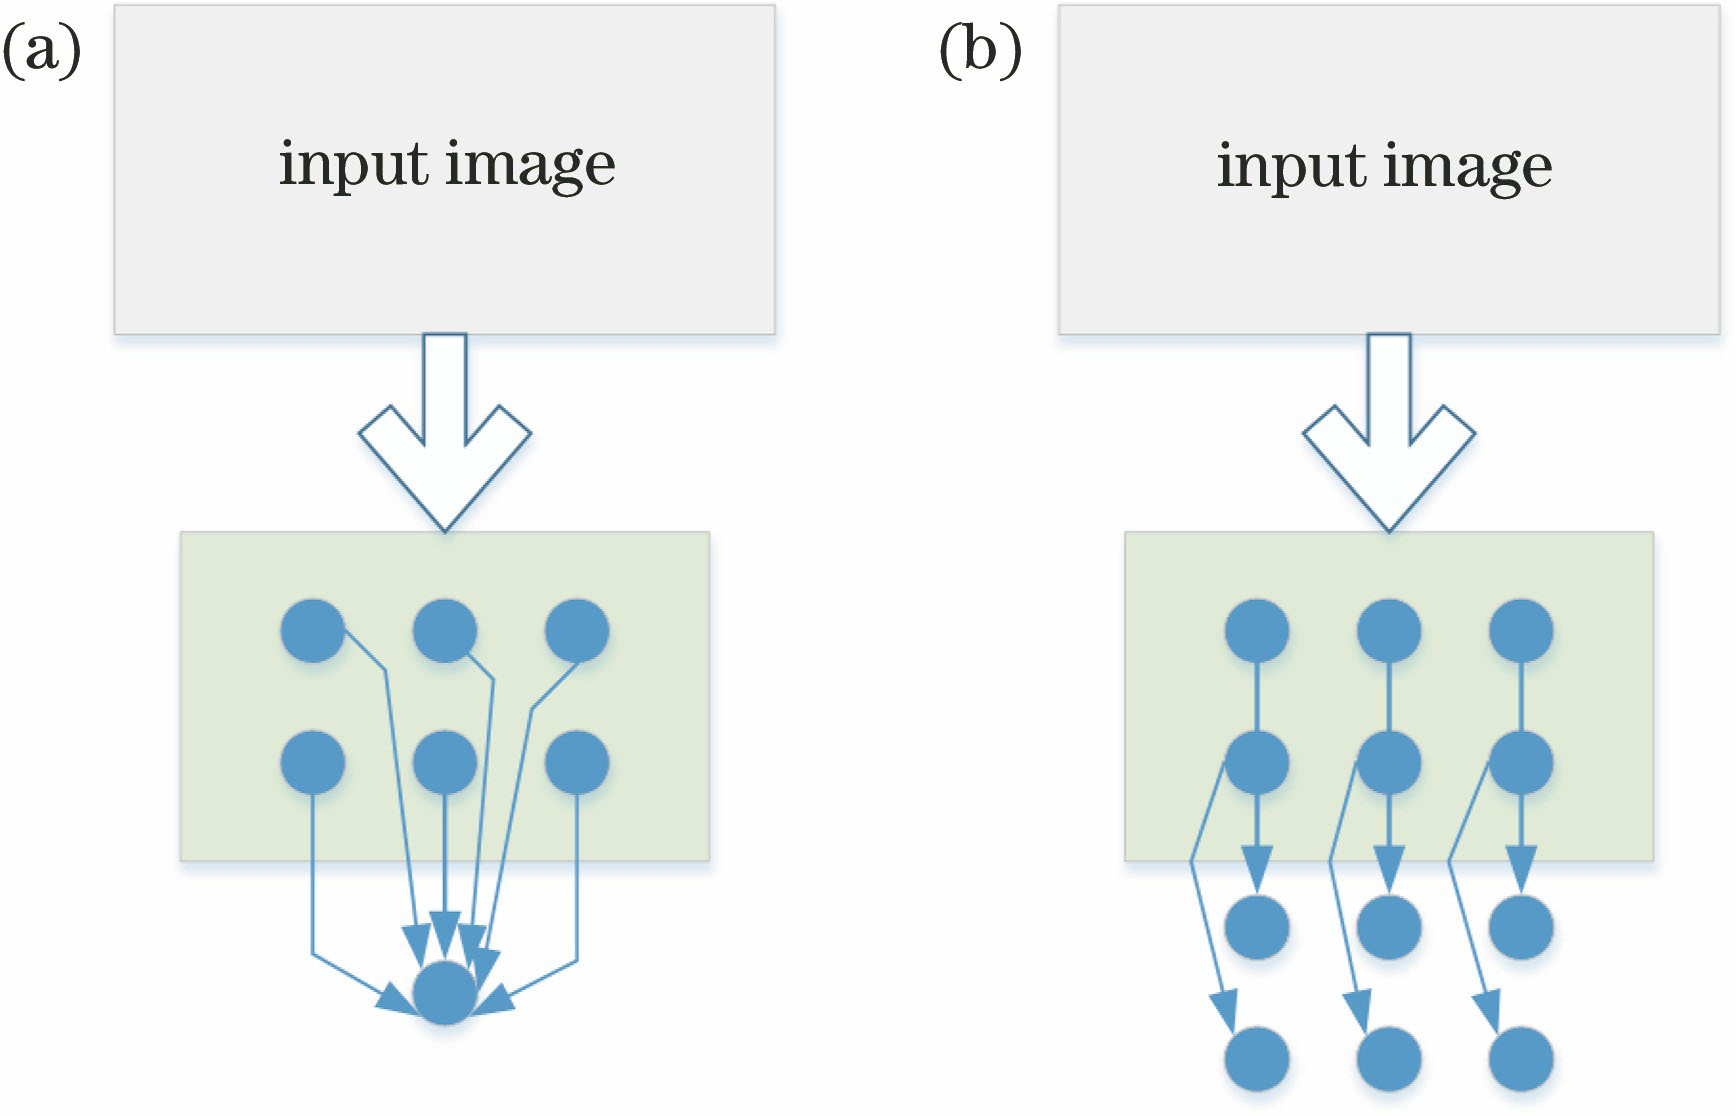
Fig. 1. Different network models. (a) Classification model; (b) segmentation model
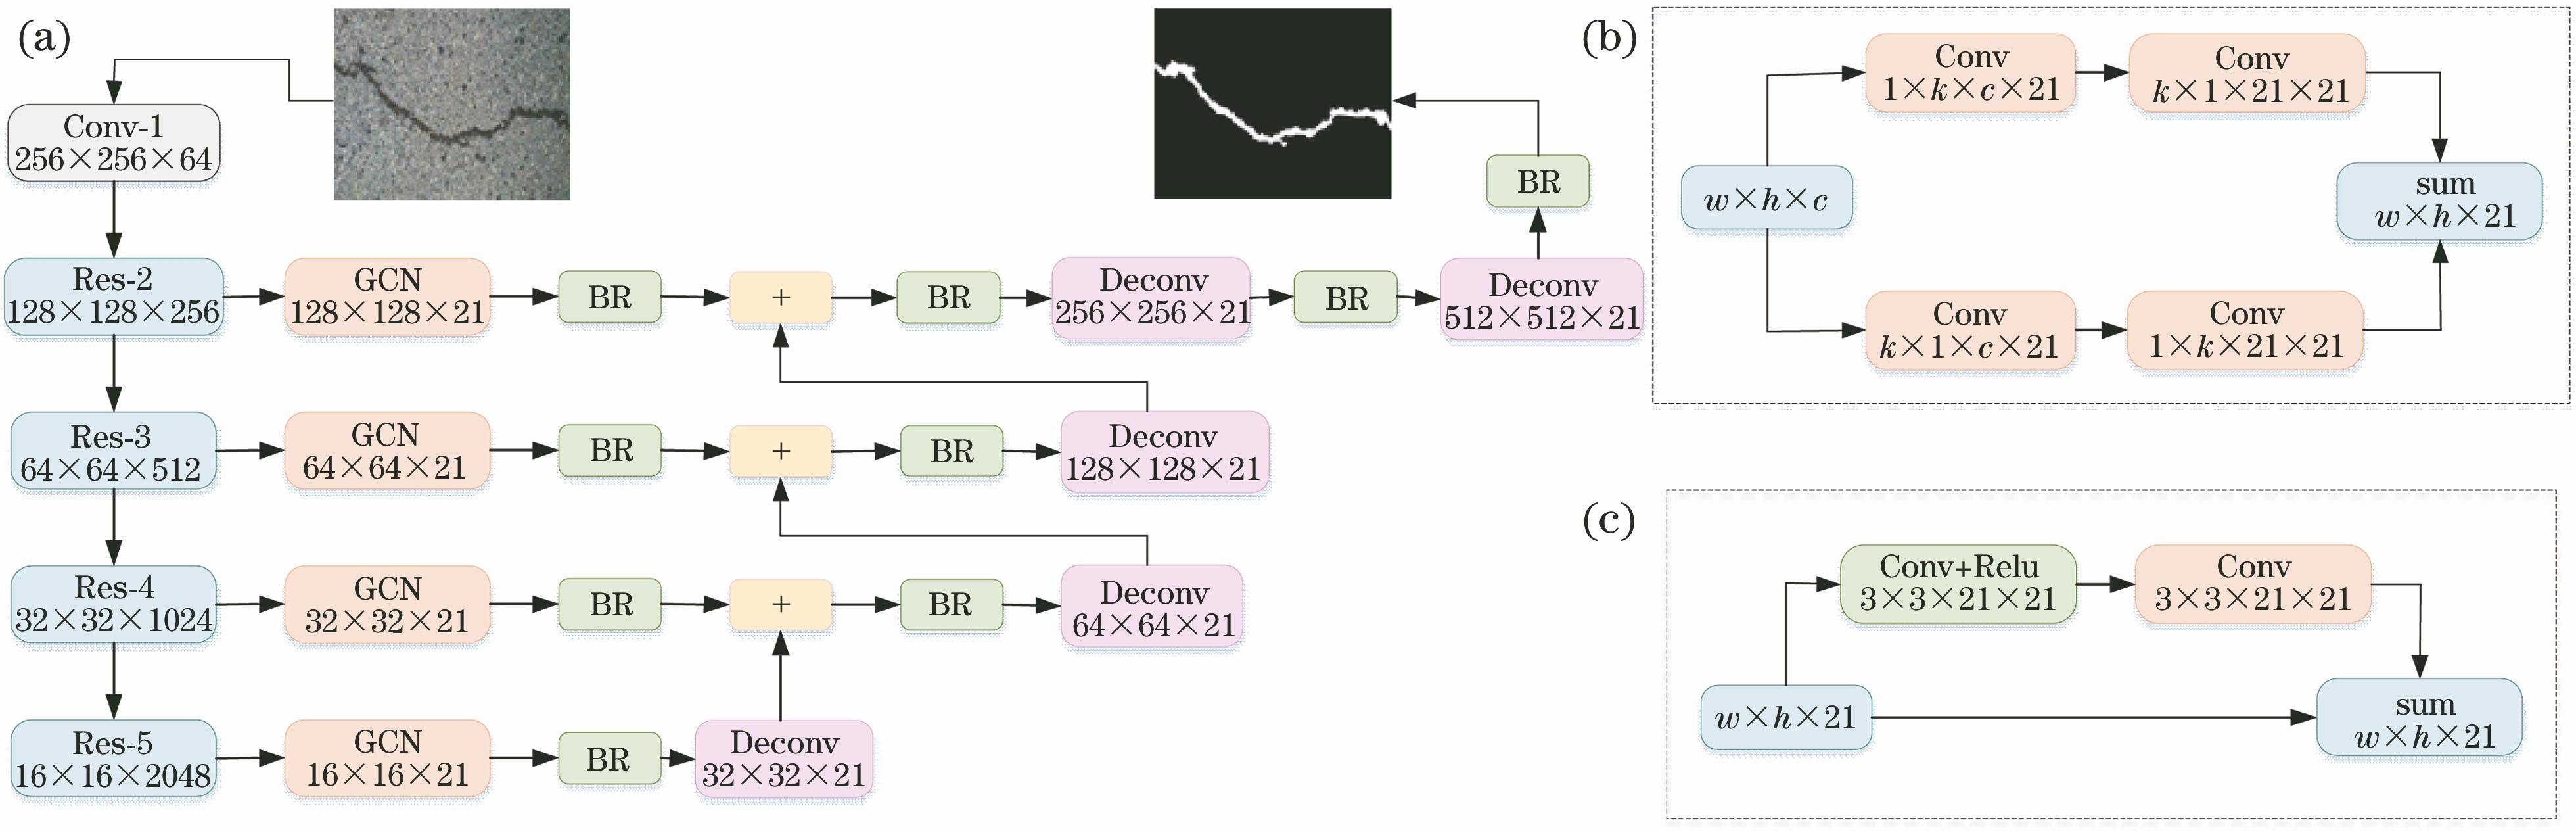
Fig. 2. Overall structure of the ResNet-GCN model. (a) Structure of the entire framework; (b) GCN structure; (c) boundary refinement module
Fig. 3. Dataset containing different crack types. (a) Crack; (b) watery crack; (c) crack with repair seal; (d) crack with lane line; (e) stitching seam; (f) crack containing debris
Fig. 4. Labeling of experimental crack data. (a) (b) (c) Original crack images; (d) (e) (f) manually marked cracks
Fig. 5. Comparision of GCN and ordinary convolution kernel
Fig. 6. Test accuracy of MobileNetv2-GCN model
Fig. 7. Test mIoU of MobileNetv2-GCN model
Fig. 8. Crack segmentation effect of MobileNetv2-GCN model. (a) Original images; (b) label images; (c) prediction results
Fig. 9. Crack skeleton extraction. (a)(b)(c) Binary images after segmentation; (d)(e)(f) extracted crack skeleton images
Fig. 10. Comparison of real and predicted average crack width pixel
|
Table 1. Crack dataset details
|
Table 2. Comparison of GCN results with different convolution kernel sizes
| ||||||||||||||||||||
Table 3. Comparison of GCN and equivalent small kernel stack convolution
| |||||||||||||||||||
Table 4. Comparison of experimental results to reduce the number of stacked convolution layers
|
Table 5. Comparison of experimental results after adding boundary refinement blocks
|
Table 6. Comparison of experimental results of different pre-training fusion models
|
Table 7. Experimental results of MobileNetv2-GCN on different datasets
|
Table 8. Comparison of MobileNetv2-GCN and other crack segmentation models

Set citation alerts for the article
Please enter your email address
© Copyright 2018-2021 | Chinese Laser Press. All Rights Reserved 沪ICP备15018463号-20