Yuta Kawashima, Susumu Shinohara, Satoshi Sunada, Takahisa Harayama, "Self-adjustment of a nonlinear lasing mode to a pumped area in a two-dimensional microcavity [Invited]," Photonics Res. 5, B47 (2017)
Copy Citation Text
We numerically performed wave dynamical simulations based on the Maxwell–Bloch (MB) model for a quadrupole-deformed microcavity laser with spatially selective pumping. We demonstrate the appearance of an asymmetric lasing mode whose spatial pattern violates both the x- and y-axes mirror symmetries of the cavity. Dynamical simulations revealed that a lasing mode consisting of a clockwise or counterclockwise rotating-wave component is a stable stationary solution of the MB model. From the results of a passive-cavity mode analysis, we interpret these asymmetric rotating-wave lasing modes by the locking of four nearly degenerate passive-cavity modes. For comparison, we carried out simulations for a uniform pumping case and found a different locking rule for the nearly degenerate modes. Our results demonstrate a nonlinear dynamical mechanism for the formation of a lasing mode that adjusts its pattern to a pumped area.
Since a close analogy between optical microcavities and open dynamical billiards was pointed out [1], intensive investigations have been carried out for ray-chaotic optical cavities, whose typical shape is a deformation of a circle [2–5]. Combination of total internal reflection and ray chaos is expected to achieve a low-threshold and directional-emission microcavity laser [6,7].
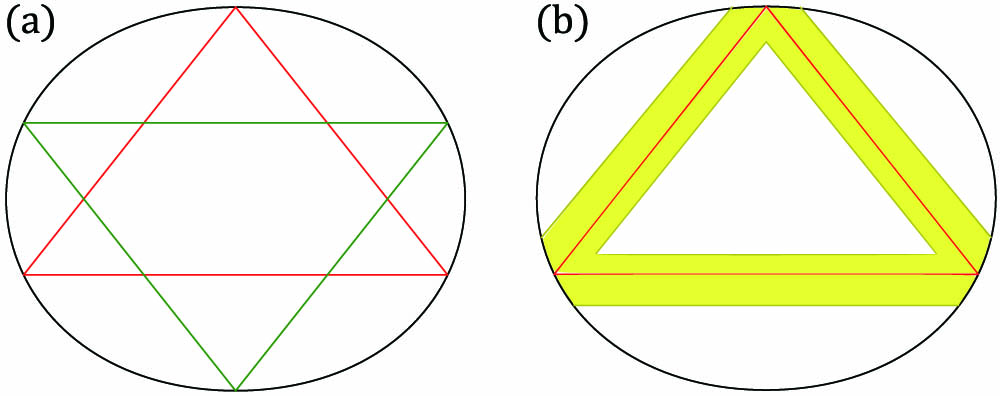
Recently, Aung et al. experimentally demonstrated that threshold current reduction and directional emission can be simultaneously achieved by forming an appropriate selective pumping area in the quadrupole-deformed microcavity laser [8]. In this cavity, there are resonant modes that are localized along twin periodic orbits with the shape of the double triangle consisting of upward-pointing and downward-pointing triangles [see Fig. 1(a)]. In the experiments reported in Ref. [8], the selective pumping area was formed along one of the two triangle orbits, and directional emission was observed. The assumption of the existence of a lasing mode that localizes along the sole triangle orbit plays a key role in explaining the experimental data in Ref. [8]. With this assumption, the directional emission can be explained by the mechanism of unstable-manifold-guided emission [9–11] via dynamical tunneling [12–14], and the threshold current reduction can be attributed to the fact that the triangle orbit is confined by total internal reflection. However, because this lasing mode violates the mirror symmetry of the quadrupole cavity, it cannot be simply regarded as a passive-cavity mode.
Figure 1.(a) Double-triangle orbits in the quadrupole-deformed cavity. (b) Spatial selective pumping (yellow region) along the upward-pointing triangle orbit (red lines).
A theoretical explanation is needed on how selective pumping leads to the formation of the asymmetric lasing mode, which does not have a direct counterpart in the passive-cavity modes. It is the purpose of this paper to numerically demonstrate the existence of the asymmetric lasing mode and theoretically reveal its appearance mechanism. We perform wave dynamical simulations based on the Maxwell–Bloch (MB) model [3,15], which fully takes into account the nonlinear interaction between the light field and a gain medium described by a two-level atom system (i.e., the optical Bloch equations [16]). We numerically reproduce the appearance of the asymmetric lasing mode when the selective pumping condition is adopted, and explain it by the locking of four nearly degenerate modes associated with the double-triangle orbits. Dynamical simulations reveal that clockwise (CW) and counterclockwise (CCW) rotating-wave states are stable stationary solutions of the MB model. For comparison, we perform simulations for a uniform pumping case, and found a different locking rule for the nearly degenerate modes.
2. MODEL
A. MB Model
The MB model is a set of wave dynamical equations describing the nonlinear interaction between the light field and a gain medium [3,15,17]. For transverse-magnetic (TM) polarization, it is given by where , , and are the electric field, polarization, and population inversion, respectively, is the refractive index, and is the permittivity. The constant is introduced phenomenologically to describe the background uniform absorption, is the microscopic polarization, the atomic number density, the coupling strength for the light–matter interaction, the transition frequency of the two-level gain medium, and the pumping strength parameter. and are the transversal and longitudinal relaxation rates, respectively. In the study reported in this paper, we numerically solve Eq. (1) by the finite-difference time-domain method and Eqs. (3) and (4) by the Euler method.
B. Quadrupole-Deformed Cavity
In the MB model, the effect of the cavity shape appears through the refractive index function . We fix the cavity shape to be the quadrupole-deformed cavity defined in the polar coordinates by where is the size parameter, and the deformation parameter is fixed at 0.09 throughout the paper. The refractive indices inside and outside the cavity are fixed at (GaAs) and (air), respectively. In this paper, we focus our attention on the periodic orbits with the shape of the double triangle, consisting of upward-pointing and downward-pointing stable triangle orbits as shown in Fig. 1(a).
In the experiments by Aung et al.[8], the effective refractive index of the cavity is 3.67, and the emitted light is transverse-electric polarized, which are different from our setting. However, we believe that our claims presented in this paper are qualitatively applicable to the microcavity laser studied by Aung et al.
C. Resonant Modes for the Passive Cavity
The resonant modes for the passive cavity are the solutions of Eq. (1) with and . That is, they are the eigensolutions of the following Helmholtz equation: where . Because we assume TM polarization, we impose that both the wave function and its normal derivative are continuous at the cavity boundary. The eigenfrequency takes a complex value with a negative imaginary part, because Eq. (6) is solved with the outgoing wave condition at infinity, i.e., as . Because the quadrupole cavity has mirror symmetries with respect to both the and axes, the resonant modes are divided into four symmetry classes, i.e., where are parity indices.
For the double-triangle orbits, the associated resonant modes can be shown to have fourfold near degeneracy by a symmetry argument [18]. Figure 2 shows an example of the four nearly degenerate modes with , where the even–even () and odd–odd () modes constitute a closer pair, whereas the even–odd () and odd–even () modes form another closer pair. Here we used the scaled eigenfrequency , where is the transition frequency of the two-level gain medium tuned to fit the frequencies of the nearly degenerate modes. We numerically obtained the eigenfrequencies and eigenfunctions by the boundary element method [19].
Figure 2.Intensity distributions of the resonant modes for a passive quadrupole-deformed cavity with refractive index 3.3. The modes are four nearly degenerate modes associated with the double-triangle orbits. The double-triangle orbits (red and green lines) are superposed, and the intensities outside the cavity are plotted in log scale. (a) Even–even mode with scaled frequency . (b) Even–odd mode with . (c) Odd–even mode with . (d) Odd–odd mode with .
Because of the relatively small wavenumbers, the intensity localization along the triangle orbits is less obvious in Fig. 2. However, by investigating the Husimi distributions [20] of the wave functions, we could identify the intensity localization along the double-triangle orbits. Figure 3 shows the upper-half phase space for the ray dynamics [2–4], where the phase space is spanned by with and being the arc length along the cavity boundary and the incident angle for a ray orbit, respectively. In Fig. 3, the islands of stability corresponding to the upward-pointing and downward-pointing triangle orbits are shown by red and green points, respectively. In Fig. 3, we also superpose the Husimi distribution for the resonant mode , whose wave function pattern is shown in Fig. 2(b). In the Husimi distribution, we can see high intensities near the islands of stability. We also checked that modes similar to those in Fig. 2 appear regularly in the plane with a constant modal spacing corresponding to the optical path length of the triangle orbit.
Figure 3.Phase space of the ray dynamics for the quadrupole-deformed cavity. The islands of stability corresponding to the upward-pointing and downward-pointing triangle orbits are indicated by red and green points, respectively. The critical line for total internal reflection is indicated by a line at . Husimi distribution for the mode shown in Fig. 2(b) is superposed.
As can be seen in Fig. 3, the double-triangle orbits are located above the critical line for total internal reflection. The emission of a well-confined mode in a ray-chaotic cavity can be explained by the chaos-assisted emission (CAE) mechanism [12–14]. As Aung et al. have shown [8], the CAE mechanism for the quadrupole cavity results in strong emissions at the far-field angles , 130°, 230°, and 310°.
Figure 4 shows the eigenfrequency distribution of the resonant modes in the complex plane, where represents the decay rate of the mode. The modes encircled by the green circle are the four nearly degenerate modes associated with the double-triangle orbits (the and modes are almost on top each other, and so are the and modes). The longitudinal modal spacing for the double-triangle modes is estimated to be from the optical path length of the triangle orbit. For the numerical simulations reported in this paper, we only consider the cases where a single set of the four nearly degenerate modes has positive gain.
Figure 4.Distribution of the complex eigenfrequencies scaled by , where is the gain center parameter. The four nearly degenerate modes associated with the double-triangle orbits are encircled by a green circle (the and modes are almost on top of each other, and so are the and modes). The modes indicated by filled circles (•) have positive linear gain [i.e., satisfying Eq. (9)] for the selective pumping with , whereas those indicated by crosses (×) do not satisfy Eq. (9).
In the eigenfrequency distribution, we can see that some modes are aligned at . This decay rate value was found to agree with that estimated by the Fresnel-coefficient-weighted ray simulation [3] for chaotic orbits located near the critical line for total internal reflection in the phase space. Thus, these modes are associated with the chaotic orbits.
3. NUMERICAL RESULTS OF THE MB MODEL SIMULATION
A. Positive Linear Gain Condition for a Resonant Mode
The condition for a resonant mode to have positive linear gain is derived in the limit of a single-mode approximation ignoring modal couplings [15]: with where is the eigenfrequency of a passive-cavity mode, denotes the area inside the cavity, and represents a characteristic function that takes 1 inside the pumped area (i.e., the area along the upward-pointing triangle orbit) and takes 0 otherwise. We note that this condition depends on the wave function through Eq. (10), and that the gain center is controlled by the parameter . This condition is useful for estimating which passive-cavity modes have the potential to contribute to a lasing state for given gain center and pumping strength .
For the simulations reported in this paper, we fixed the parameter values as follows: μ, , , , , and . As mentioned in Section 2.C, the value of is chosen so that the double-triangle modes become the nearest to the gain center. The pumping strength parameter is dimensionless, and it is varied in the simulations.
B. Selective Pumping Simulations
Selective pumping in two-dimensional microcavity lasers has been experimentally demonstrated in Refs. [8,13,21–25], and theoretically studied in Refs. [26–30]. The study reported in this paper numerically demonstrates a nonlinear dynamical mechanism for the formation of a lasing mode that adjusts its pattern to a pumped area.
Figures 5(b) and 6 show the results of the selective pumping simulation when the pumping strength is set at , and the initial distribution of the electric field is given by a Gaussian distribution, as shown in Fig. 5(a). For selective pumping with , the number of the modes that satisfy the positive linear gain condition, Eq. (9), turned out to be 10, including the four nearly degenerate modes. In Fig. 4, these 10 modes are indicated by filled circles (•).
Figure 5.Electric field intensity distributions. (a) An initial condition for the MB model simulation. (b) Time-averaged pattern of the stationary lasing state of the MB model for the selective pumping case with . The intensity outside the cavity is plotted in log scale. The boundary of the pumped area is indicated by yellow lines.
Figure 6.Results of the MB model simulation for the selective pumping case with . (a) Time evolution of the total light intensity inside the cavity. (b) Power spectrum of the electric field for the stationary lasing regime. The peak frequency is around .
Figure 6(a) shows the time evolution of the total light intensity inside the cavity, where we can observe the formation of a stationary lasing state after a transient. Figure 6(b) shows the power spectrum of the time series of the electric field at a certain point in the cavity taken in the stationary regime. From this power spectral data, we can confirm the single-mode lasing. The corresponding time-averaged electric field intensity pattern is shown in Fig. 5(b), where the average was taken over the time interval of . This pattern clearly shows that the stationary lasing state is a CW rotating wave, which violates mirror symmetries with respect to both the and axes. Because the MB system with the triangle-orbit pumping pattern is invariant under the transformation , a CCW rotating wave [obtained by reversing the axis in Fig. 5(b)] is also a solution of the MB model.
C. Interpretation of the Stationary Rotating-Wave States of the MB Model by the Resonant Modes
It has been numerically demonstrated for the Schrödinger–Bloch (SB) model that the frequencies of nearly degenerate modes can be locked as a result of a nonlinear modal interaction, and the locking phenomenon results in the appearance of asymmetric emission patterns [31–34]. The SB model is an approximation of the MB model, where the slowly varying envelope approximation of the field variables is adopted for reducing a numerical computation cost.
The power spectrum in Fig. 6(b) shows a single-mode lasing, under the condition of preferential excitation of the four nearly degenerate modes. This result suggests that the locking occurs for these nearly degenerate modes. For confirming this, we computed the superposition of the resonant-mode eigenfunctions. First, we found that intensity localization along the upward-pointing triangle orbit can be reproduced by taking the superpositions of two different parity modes as follows: ≔≔
We plot the intensity distributions of and in Figs. 7(a) and 7(b), respectively. In the same manner, the intensity localization along the downward-pointing triangle orbit can be obtained by ≔ and ≔. Secondly, we found that the CW and CCW rotating-wave states can be reproduced by taking the superpositions of and as follows: ≔≔
Figure 7.Intensity distributions of the superpositions of the resonant-mode wave functions. The triangle orbit is indicated by red lines, and the intensities outside the cavities are plotted in log scale. (a) . (b) . (c) . (d) .
The intensity distributions of and are plotted in Figs. 7(c) and 7(d), respectively. Comparing Figs. 5(b) and 7(c), we can confirm that the CW rotating-wave state of the MB model can be very well reproduced by the superposition of the four nearly degenerate double-triangle modes.
By performing simulations for various initial conditions and pumping strengths, we numerically found that the CW and CCW rotating-wave states are stable solutions of the MB model. Because our selective pumping pattern is symmetric with respect to the axis, when we prepare the initial field distributions symmetric with respect to the axis, we obtained standing-wave stationary states that obey the same symmetry. We checked that these standing-wave stationary states can be reproduced by the resonant-mode superpositions and shown in Figs. 7(a) and 7(b). However, we numerically found that these standing-wave states are dynamically unstable stationary solutions [31].
For selective pumping, we found the lasing threshold to be . Just above the threshold, we already observed the rotating-wave state localized along the triangle orbit. This appears to be reasonable, because the lasing mode needs to adjust its pattern along the pumped area so that it can be excited.
The fact that the lasing mode at the threshold already localizes along the triangle orbit yields the discrepancy between the actual lasing threshold and the positive linear gain condition Eq. (9). In the estimation of by Eq. (10), the resonant-mode wave function does not localize only along the upward-pointing triangle orbit. For the resonant modes , , , and , Eq. (9) predicts the positive linear gain thresholds to be , , , and , respectively, which are all larger than the actual lasing threshold. When we used instead of for the estimation of by Eq. (10), we found that the positive linear gain threshold is around , which is closer to the actual lasing threshold. For a more accurate prediction of the lasing threshold, incorporating the effect of the polarization term (thus the effect of selective pumping) in the linear Helmholtz equation [26,28–30] is expected to be effective, which is, however, beyond the scope of this paper.
D. Uniform Pumping Simulation
To compare with the selective pumping case, we carried out simulations when the cavity is uniformly pumped. We used the same parameter values as in the selective pumping case, except for the pumping strength, which was set at . For this value, the number of the modes satisfying the positive linear gain condition, Eq. (9), turned out to be 11, including the four nearly degenerate double-triangle modes.
Figures 8 and 9 show the results of the MB model simulation with uniform pumping. Figures 8(a) and 8(b), respectively, show the time evolution of the total light intensity inside the cavity and the power spectrum of the electric field for the stationary lasing regime. In the spectral data, we can identify two dominant peaks at and and also observe their beat oscillation in the stationary regime of the time-series data (we note that the ratio of the peak heights depends on the position where the time-series data are acquired). These data suggest that the stationary state consists mainly of the two modes for . For higher pumping strengths (i.e., ), we did not observe the tendency for the two modes to be locked.
Figure 8.Results of the MB model simulation for the uniform pumping case with . (a) Time evolution of the total light intensity inside the cavity. (b) Power spectrum of the electric field for the stationary lasing regime. The frequencies of the primary and secondary peaks are and , respectively.
Figure 9.Time-averaged pattern of the stationary lasing state of the MB model for the uniform pumping case with . The intensity outside the cavity is plotted in log scale.
We show in Fig. 9 the time-averaged electric field intensity pattern for the stationary lasing regime, where we can see a CW rotating-wave state different from the one for the selective pumping case. By investigating the superposition of the resonant-mode wave functions, we found that the pattern in Fig. 9 can be reproduced by and . Their patterns are shown in Figs. 10(a) and 10(b), both of which show CW rotating-wave patterns. We note that the and modes have very close eigenfrequencies, and so do the and modes (see the caption of Fig. 2 for their eigenfrequencies). The scaled eigenfrequency of the former pair is around 0.99908, whereas that for the latter is around 1.000828. These values closely correspond to the peak positions in the spectral data, which provides a strong support for our interpretation that each of the two lasing modes is the locked state of a nearly degenerate pair.
Figure 10.Intensity distribution of the superpositions of the resonant-mode wave functions. (a) . (b) . The intensities outside the cavity are plotted in log scale.
For uniform pumping, we found the lasing threshold to be , which is smaller than the threshold for selective pumping. This result seems to be natural, because the lasing modes are different between the two cases, and for selective pumping, the double-triangle modes are partially pumped.
4. CONCLUSIONS
We numerically demonstrated the lasing of a triangle orbit mode in the quadrupole-deformed microcavity laser with spatial selective pumping along the periodic orbit. We used the MB model to describe the nonlinear interaction between the light field and a gain medium. The nonlinear interaction is essential for the existence of the triangle orbit lasing mode, as there is no corresponding resonant mode for the passive cavity because of the - and -axes mirror symmetries of the quadrupole cavity. By a passive-cavity mode analysis, we concluded that the asymmetric lasing mode can be interpreted as the locked state of the four nearly degenerate modes associated with the double-triangle orbits. In view of our theoretical results, the experimental study by Aung et al.[8] is considered to be a very nice illustration of the nonlinear dynamical effect on the formation of asymmetric lasing modes. Although our results presented here are for , we numerically confirmed that the locking phenomena of the four nearly degenerate modes were similarly observed for (e.g., and ).
We numerically confirmed that the CW and CCW rotating-wave triangle orbit modes are stable solutions for the MB model, whereas standing-wave ones are unstable. It would be an interesting future problem to examine if a CW or CCW rotating-wave stationary state can be obtained even when multiple longitudinal modes are involved in lasing.
Another open issue is the detailed theoretical mechanism for the nonlinear interaction of the four different parity resonant modes. Our comparison between the selective and uniform pumping cases revealed that the modal interaction mechanism does depend on the pumping pattern. Elucidating its mechanism would be useful for better controlling lasing modes through selective pumping.
Regarding device optimization for threshold current reduction by selective pumping, it might be effective to adopt an active–passive structure, where the non-pumped cavity area is made of a passive material so as to suppress material absorption.
Acknowledgment
Acknowledgment. The authors thank Mr. Shunya Sekiguchi for his support in ray-dynamical simulations. T. H. is grateful to Prof. Li Ge for fruitful discussions.
[2] H. G. L. Schwefel, K. Vahala, H. E. Tureci, A. D. Stone, R. K. Chang. Progress in asymmetric resonant cavities: Using shape as a design parameter in dielectric microcavity lasers. Optical Microcavities, 415-495(2004).
[7] O. Kwon, J. Wiersig, B. Lee, J. Unterhinninghofen, K. An, Q. H. Song, H. Cao, M. Hentschel, S. Shinohara. Review on unidirectional light emission from ultralow-loss modes in deformed microdisks. Trends in Nano- and Micro-cavities, 109-152(2011).
Yuta Kawashima, Susumu Shinohara, Satoshi Sunada, Takahisa Harayama, "Self-adjustment of a nonlinear lasing mode to a pumped area in a two-dimensional microcavity [Invited]," Photonics Res. 5, B47 (2017)