• Infrared and Laser Engineering
  • Vol. 51, Issue 2, 20210890 (2022)
Tao He1, Zhonghua Shen1, Fei Chen1, and Li Chen2
Author Affiliations
  • 1School of Science, Nanjing University of Science and Technology, Nanjing 210014, China
  • 2School of Optoelectronic Science and Engineering, University of Electronic Science and Technology of China, Chengdu 611731, China
  • show less
    DOI: 10.3788/IRLA20210890 Cite this Article
    Tao He, Zhonghua Shen, Fei Chen, Li Chen. Measurement of translucent coating thickness based on pulsed thermography[J]. Infrared and Laser Engineering, 2022, 51(2): 20210890 Copy Citation Text show less
    Schematic diagram of theoretical analysis model
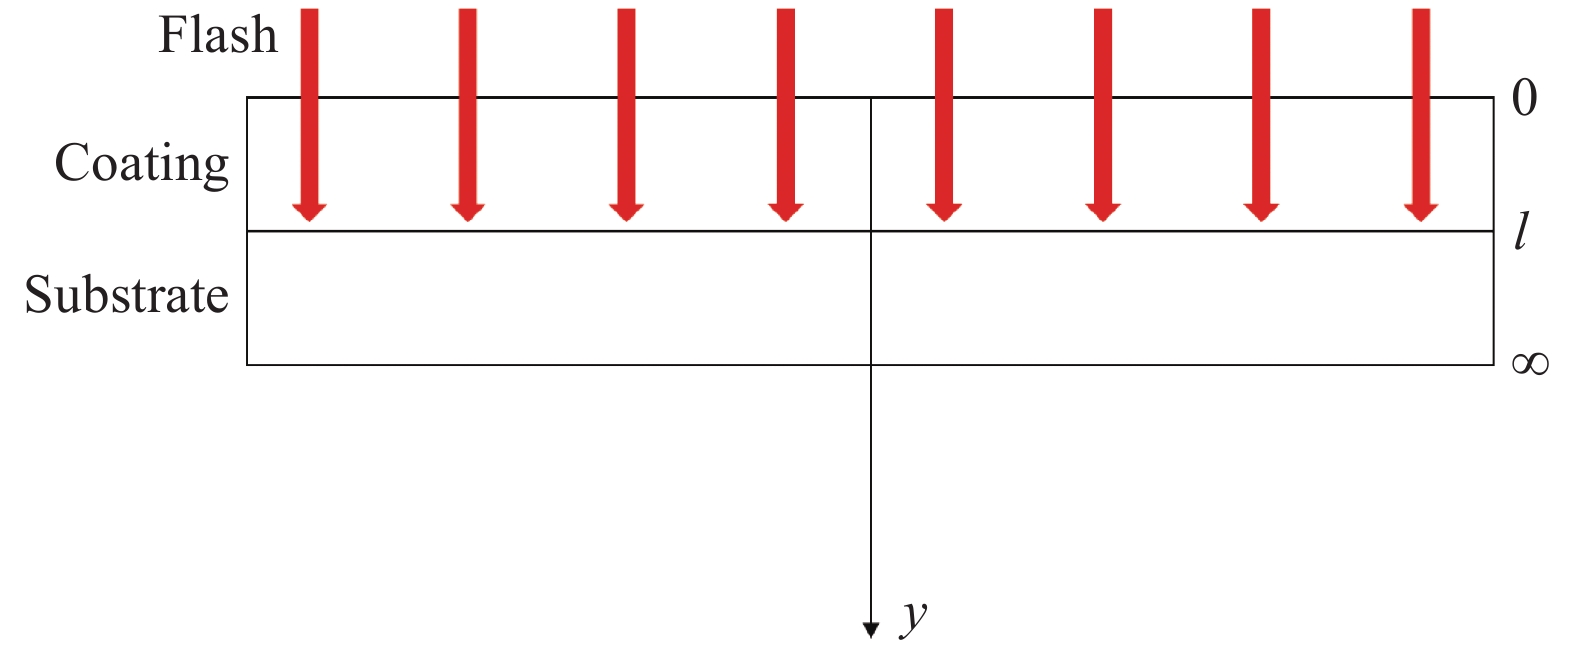
    Fig. 1. Schematic diagram of theoretical analysis model
    Analytical surface temperature of samples with different coating thickness vs time in double logarithm scale
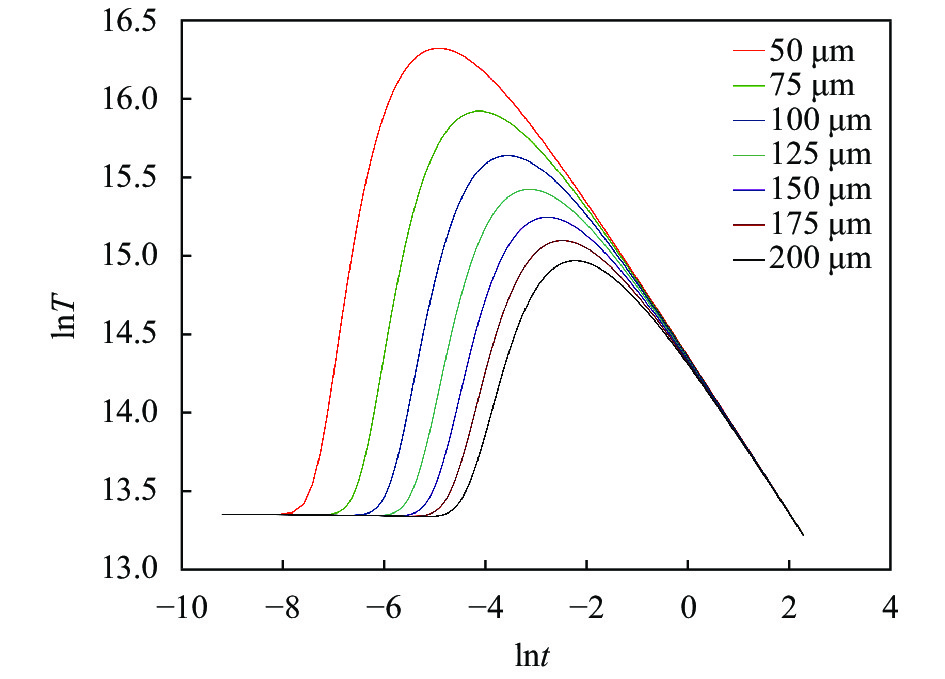
    Fig. 2. Analytical surface temperature of samples with different coating thickness vs time in double logarithm scale
    Coating thickness vs peak time of surface temperature in logarithm scale
    Fig. 3. Coating thickness vs peak time of surface temperature in logarithm scale
    Schematic diagram of numerical calculation model
    Fig. 4. Schematic diagram of numerical calculation model
    Coating thickness vs transmittance
    Fig. 5. Coating thickness vs transmittance
    Simulation surface temperature of samples with different coating thickness vs time in double logarithm scale
    Fig. 6. Simulation surface temperature of samples with different coating thickness vs time in double logarithm scale
    Coating thickness vs simulation peak time of surface temperature in logarithm scale
    Fig. 7. Coating thickness vs simulation peak time of surface temperature in logarithm scale
    Schematic diagram of the coating specimen
    Fig. 8. Schematic diagram of the coating specimen
    Selected frames from the IR image sequence
    Fig. 9. Selected frames from the IR image sequence
    Experimental surface temperature of samples with different coating thickness vs time in double logarithm scale
    Fig. 10. Experimental surface temperature of samples with different coating thickness vs time in double logarithm scale
    Thickness vs experimental peak time in double logarithm scale
    Fig. 11. Thickness vs experimental peak time in double logarithm scale
    Test result of thickness distribution of the specimen
    Fig. 12. Test result of thickness distribution of the specimen
    Density/ $\mathrm{k}\mathrm{g}\cdot{\mathrm{m} }^{-3}$Heat capacity/ $\mathrm{J}\cdot(\mathrm{k}\mathrm{g}\cdot \mathrm{K}$)−1Thermal conductivity/ $\mathrm{W}\cdot(\mathrm{m}\cdot \mathrm{K}$)−1
    Coating120010000.2
    Substrate785047580
    Table 1. Parameters used in the model
    Thickness by micrometer/ μm Thickness by thermography/ μm Difference
    110399.73.3%
    2136139.22.3%
    3158160.61.6%
    4197189.44.0%
    Table 2. Measurement result of coating thickness
    Tao He, Zhonghua Shen, Fei Chen, Li Chen. Measurement of translucent coating thickness based on pulsed thermography[J]. Infrared and Laser Engineering, 2022, 51(2): 20210890
    Download Citation